HAL Id: hal-03010602
https://hal.archives-ouvertes.fr/hal-03010602
Submitted on 17 Nov 2020HAL is a multi-disciplinary open access archive for the deposit and dissemination of sci-entific research documents, whether they are pub-lished or not. The documents may come from teaching and research institutions in France or abroad, or from public or private research centers.
L’archive ouverte pluridisciplinaire HAL, est destinée au dépôt et à la diffusion de documents scientifiques de niveau recherche, publiés ou non, émanant des établissements d’enseignement et de recherche français ou étrangers, des laboratoires publics ou privés.
Examination of crystal dissolution in 3D: A way to
reconcile dissolution rates in the laboratory?
Catherine Noiriel, Matthias Oursin, Damien Daval
To cite this version:
Catherine Noiriel, Matthias Oursin, Damien Daval. Examination of crystal dissolution in 3D: A way to reconcile dissolution rates in the laboratory?. Geochimica et Cosmochimica Acta, Elsevier, 2020, 273, pp.1-25. �10.1016/j.gca.2020.01.003�. �hal-03010602�
1
Examination of crystal dissolution in 3D: a way to
1
reconcile dissolution rates in the laboratory?
2
Catherine Noiriel 1,* Matthias Oursin 1, and Damien Daval 2 3
4
1Géosciences Environnement Toulouse, Observatoire Midi-Pyrénées, Université Paul Sabatier,
5
CNRS, IRD, Université de Toulouse, 14 avenue Edouard Belin, F-31400 Toulouse, France. 6
2Laboratoire d’Hydrologie et de Géochimie de Strasbourg, Université de Strasbourg, EOST,
7 CNRS, 67084 Strasbourg, France. 8 9 10 *corresponding author 11 12 13 14 15 16 *Manuscript
2
KEYWORDS 17
Calcite dissolution, X-ray micro-tomography, 3D crystal geometry, dissolution rate 18
distribution, surface topography, rate mapping, rate variability, face-specific dissolution, edge 19 contribution 20 21 HIGHLIGHTS 22
Determination of the local rates of dissolution of a whole calcite crystal in 3D 23
Etch pits progressively annihilate and disappear as far as dissolution progresses 24
Contribution of calcite crystal faces, edges and corners to dissolution are evaluated individually 25
Crystal edges progressively control the dissolution at the crystal scale 26
Contribution of the edges to the overall dissolution is crystal size and time dependent and was 27
evaluated through a simple geometric model. 28
The technique is limited by imaging resolution but has no limited depth of investigation at the 29 crystal surface 30 31 ABSTRACT 32
Surface reactivity is a major parameter controlling mineral reactivity, and microscopic 33
techniques investigating surface retreat with time have pointed at the heterogeneous and/or 34
anisotropic reactivity of minerals, in relation with the diversity and stochastic distribution of 35
energetic sites. However, in view of the discrepancies between rates determined in the 36
laboratory, a thorough 3D approach of a whole crystal reactivity might be particularly attractive 37
to evaluate the respective contributions of single faces and crystal edges to the dissolution flux, 38
and to fill the gap between the rates derived from face-specific, topography observations at 39
micro-scale (i.e., with no contribution of the edges to dissolution) and those determined on 40
3
crystal powders in continuously stirred reactors (with an overcontribution of the edges and 41
surface defects to dissolution). Here, we provide a detailed 3D characterization of the geometry 42
evolution and dissolution rate of a single crystal of calcite at pH 4.5 and 4.0 using X-ray micro-43
tomography (XMT) with a pixel size of 0.325 µm. Evaluation of the retreat and mapping of the 44
reaction rates at the 3D crystal surface reveals a large range of dissolution rates reflecting the 45
specific contributions of the different regions of the crystal. During dissolution and against all 46
expectation, etch pits forming at the crystal surface progressively annihilate, primarily by 47
intersecting with trains of steps coming from the near edge regions. The global rate determined at 48
the crystal scale integrates the contribution of the local rates of all the crystal features, with '
corner r
49
> '
edge
r > rcleavage' > rmacrostep' ~ r > pit' rmacrostep' base. Crystal rounding reveals that contribution from
50
the crystal edges progressively dominates the dissolution process over pit formation at the 51
{1014} surfaces. The contribution of the edges to dissolution increases the crystal dissolution
52
rate by at least 1.6 to what would be a face-specific dissolution, and will be size- and time-53
dependent, as suggested by a simple geometric model based on uniform or non-uniform 54
dissolution of the faces of a model crystal. Finally, comparison of the method to vertical 55
scanning interferometry measurements and scanning electron microscopy observations on 56
surface portions shows that XMT imaging is robust, suggesting that its application to the 57
dissolution/precipitation of other minerals would be highly beneficial to determine reliable rates 58
that can be further used to model mineral reactivity. 59
60
1. INTRODUCTION 61
Mineral reactivity is fundamentally important in Earth sciences, as it controls many of the natural 62
or anthropogenic geochemical processes, such as continental weathering, diagenesis, 63
hydrothermal alteration, carbon dioxide sequestration, nuclear waste disposal, groundwater 64
contamination, or geothermal energy production (Depaolo and Orr, 2008; Kump et al., 2000; 65
Morse and Arvidson, 2002; Noiriel and Daval, 2017; Steefel et al., 2005). In this regard, a 66
specific attention has been paid over a century to the determination of reliable kinetic rate laws, 67
with the ultimate goal to better understand, quantify and predict chemical transformations and 68
mass transfers over large space and time scales. However, bridging the gap between rates 69
4
measured in the field and determined in the laboratory remains an elusive objective, when 70
already discrepancies exceeding largely the analytical errors have long been reported between 71
reaction rates determined in the laboratory, despite the well-controlled physicochemical 72
conditions of the experiments (Fischer et al., 2014). This aspect points towards an intrinsic 73
variability of mineral reactivity, all extrinsic factors being equal, which must be characterized 74
and understood to ultimately upscale laboratory-derived rates to natural settings. 75
Intrinsic sources of variation have been highlighted through the measure of the distribution of 76
local rates at the crystal surface (Fischer et al., 2012), which can be treated in the framework of 77
the so-called “rate spectra” concept, and reflect the heterogeneous distribution of defects 78
outcropping at the crystal surface. Therefore, it is not surprising that bulk dissolution rate data 79
obtained from reactor experiments on crushed crystals (i.e., mineral powders) differs from 80
dissolution rate data measured locally at the surface of polished or pristine crystals, due to 81
differences in surface reactivity distribution at the two scales of observation, and also because 82
sample preparation may play a key role in the resulting distribution of reactive sites. Surface 83
reactivity, which is ultimately dependent on three parameters, i.e., chemical composition, atomic 84
structure and fine-scale morphology (Hochella, 1990), can exert a crystallographic or 85
microstructural control of mineral reactivity (Daval et al., 2013; Pollet-Villard et al., 2016a; 86
Saldi et al., 2017). In this regard, microscopic techniques measuring the topography at the fluid-87
mineral interface are particularly attractive to investigate mineral reactivity. 88
Changes at the mineral surface can be evaluated in situ or ex situ by measuring the vertical 89
retreat under various experimental conditions with micrometer to nanometer resolutions using 90
methods such as atomic force microscopy (AFM) (Emmanuel, 2014; Hillner et al., 1992; Jordan 91
and Rammensee, 1998; Shiraki et al., 2000; Stipp et al., 1994), vertical scanning interferometry 92
(VSI) (Fischer and Luttge, 2007; Smith et al., 2013), phase shifting interferometry (PSI) (Ueta et 93
al., 2013), confocal profilometry (Godinho et al., 2012), X-ray reflectivity (Fenter et al., 2000), 94
digital holographic microscopy (DHM) (Brand et al., 2017) or X-ray microscopy (Laanait et al., 95
2015). Such methods have enabled measurements of dissolution rates on face-oriented single 96
crystals or polycrystalline aggregates, and evidenced their variability at the mineral surface, with 97
heterogeneous and/or anisotropic reactivity reflecting the energetic diversity of reactive sites. For 98
instance, application of these techniques to the study of cleaved {1014} surface of calcite has
5
provided insightful observations of the contribution of etch pits and step retreat, or their 100
interactions, to dissolution under a large variety of experimental conditions (Arvidson et al., 101
2006; Arvidson et al., 2003; Hillner et al., 1992; Shiraki et al., 2000; Smith et al., 2013 102
Bouissonnié et al., 2018; Duckworth and Martin, 2004; Jordan and Rammensee, 1998; Miyata et 103
al., 2017; Ruiz-Agudo et al., 2009; Teng, 2004; Xu et al., 2010). Fine-scale observations at the 104
crystal surface have also contributed to challenge the conventional treatment of reaction kinetics 105
from mineral powders that has prevailed so far, which relies on the paradigms of homogeneity, 106
isotropy and immutability (Noiriel and Daval, 2017) and on the definition of a unique reaction 107
rate (Fischer et al., 2012). 108
However, these methods are often restricted to small observation surfaces (typically of areas less 109
than 500×500 µm2). In addition, they often require the surface to be well cleaved or polished to 110
provide surfaces as flat as possible, inherent to a limited vertical range (e.g., about 5 µm for 111
AFM, but up to 150 µm for VSI). Consequently, they are often restricted to areas of lower 112
reactivity (Dove and Platt, 1996) and ignore the contribution of surface macro-patterns and 113
crystal edges. It has been pointed out that the missing contribution of the crystal edges and 114
corners to the calculation of reaction rates could explain lower rates obtained from VSI 115
measurements compare to bulk rate determination (Lüttge et al., 2003; Saldi et al., 2017). 116
Although it has long been assumed that crystal edges provide a source of reactive sites (Schott et 117
al., 1989), it is only very recently than the quantitative contribution of crystal edges to 118
dissolution rates has been evaluated experimentally (Noiriel et al., 2019), using X-ray micro-119
tomography imaging (XMT). By enabling true 3D space, XMT should permit a significant 120
extension to current methods and models by singling out the reactivity of crystal corners and 121
edges, and to fill the gap between fine-scale (nm- to µm-scale) measurements of surface 122
reactivity and macroscopic determination of bulk rates on powders. 123
In this study, we have quantified the dissolution rate of a whole crystal of calcite at pH 4.0 and 124
4.5 by providing a direct measurement of the surface retreat rates at the crystal surface using 3D 125
XMT. We illustrate the heterogeneous distribution of the dissolution fluxes of the reacted crystal 126
through time from almost 7.5 million data points analyzed at the crystal surface. The objective is 127
to track the whole crystal topography at different time intervals in order to evaluate the 128
contribution of the different surface and crystal features to the reaction rate distribution. In 129
6
particular, we have evaluated the specific contributions of the crystal faces and edges on the long 130
term, i.e., for an average surface retreat of 22.4 µm. The robustness of the method is discussed by 131
comparing the crystal volume changes to chemical analyses of the calcium released during 132
dissolution, and the 3D imaging of the crystal surface to vertical scanning interferometry and 133
scanning electron microscopy (SEM) observations. As will be shown, the crystal edges play a 134
major role in the dissolution process, which is quantitatively assessed. The average rates, which 135
are in between the range of values reported for studies measuring the surface topography and 136
those derived from experiments on mineral powders can be considered as more representative for 137
dissolution of calcite cements (i.e., sub-mm crystals) in nature. 138
139
2. MATERIAL AND METHODS 140
2.1. Sample preparation 141
A single calcite crystal about 1.8 mm long and 0.6 mm wide was obtained after crushing and 142
sieving a cm-sized single spar crystal. The crystal was mounted on a glass capillary tube 143
(Hilgenberg, 400 µm O.D.) using epoxy resin, which covers the bottom face of the crystal 144
creating a mask that preserves it from dissolution. The crystal faces were not polished before the 145
experiment, so that the different faces are not perfectly cleaved and they exhibit various macro-146
features such as ragged or curved cleavage macrosteps, hillocks, or rippled surface patterns, 147
which are inherited from the breaking and size reduction of the original calcite sample (see 148
further in Figure 3). In particular, three of the four side faces (further named face 1, 2, and 4) 149
exhibit well cleaved portions of surface along the {1014} planes. Surface defects and
150
macrosteps intersecting the aforementioned planes are visible, as well as, for face 1, macrosteps 151
oriented along {0118} parting planes. In contrast, the fourth side face (further named face 3) has
152
a 5° miscut angle with respect to the {1014} plane, and is dominated by macrosteps and rippled
153
surface patterns. The top part of the crystal (further named face 5) is highly rough and stepped 154
with many {1014} plane intersects. Some defects of limited extension such as micro-fractures
155
and cleavages are also noticed inside the crystal, as a few micro-particles at the crystal surface. 156
2.2. Dissolution experiment 157
7
The crystal was reacted at three time steps (t1 to t3) during 22 h with acidic solutions (pH 4.5 or
158
pH 4.0) in a mixed-flow reactor (V = 160 mL) at room temperature (25 ± 2°C) and atmospheric
159
pressure. The inlet solution was prepared with deionized water (18.2 MΩ.cm-1) + 0.01M NaCl 160
and the pH was adjusted to either 4.5 ± 0.1 or 4.0 ± 0.1 using analytical grade HCl. The flow rate 161
Q was set to 8 cm3·h-1 during the experiment using a Chemyx fusion syringe pump to maintain
162
far-from-equilibrium conditions, and the solution was stirred at a rate of 400 rpm. The outlet 163
fluid was collected continuously for analysis of the calcium released with Inductive Coupled 164
Plasma - Mass Spectroscopy (ICP-MS 7500ce, Agilent Technologies). Internal spikes (In-Re), 165
blank and calibration standards were used and replicate analyses were performed to assure 166
accuracy and precision of the chemical analyses. However, because of the low concentration of 167
Ca at the outlet (~10-6 M) and because the inlet solution contains some Ca as trace impurities in 168
NaCl, it limits the accuracy of the mass balance evaluation. 169
The high fluid-to-mineral volume ratio allows for only a slight increase in the Ca concentration 170
in the reactor, from 2.0 10-6 to 6.0 10-6 M, corresponding to a saturation state with respect to 171
calcite of < 10-9 throughout the experiment (calculated with Phreeqc v3.0 using the Phreeqc 172
database, Parkhurst and Appelo, 2013). The experimental conditions are summarized in Table 1. 173
The reaction extent can be evaluated through the calcite amount removed from the crystal during 174
the dissolution experiments. The amount of calcite dissolved at any time, ncalcitechem (mol), is
175 given by: 176
j j j t t t t Ca t t calcite i chem calcite t F t Q t V t n t n i i i Ca) ( Ca) ( ) ( 0 0 0 Eq. 1 177where ncalcite is the change in the amount of calcite (mol), FCa is the flux of calcium at the
178
reactor outlet (mol·s-1), and Ca represents the difference between the outlet and inlet calcium
179
concentrations, i.e., [Ca]out-[Ca]in(mol·m-3), j is the number of aqueous samples collected
180
between t0 and ti and V is their volume (m
3).
181
2.3. 3D imaging with X-ray micro-tomography 182
8
The crystal was imaged before the reaction (t0) and at the three time steps (t1 to t3) over the
183
course of the dissolution experiment using 3D X-ray micro-tomography at the TOMCAT 184
beamline (Stampanoni et al., 2006), Swiss Light Source (Paul Scherer Institute, Switzerland). 185
The crystal was removed from the reactor for imaging in order to avoid any influence of the 186
beam on the experiment (e.g., water radiolysis (Bras and Stanley, 2016; Laanait et al., 2015)). 187
Indeed, in the range 5 < E < 40 keV, the photons do not possess enough energy to induce atomic 188
displacements directly in crystalline materials (Bras and Stanley, 2016), so that the effects of 189
radiation are non-significant. 190
A total of four data sets were collected during two different data acquisition sessions, with a 191
pixel size of 0.325 µm, using a 10× magnification diffraction-limited microscope optics. Due to 192
the large height of the crystal compared to the field of view of the sCMOS camera (pco.Edge 5.5, 193
2560×2160 pixels), three vertical scans were taken to image the whole crystal. Each data set is 194
composed of 1701 radiographs collected over a 180° rotation range. Each radiograph was 195
recorded with a monochromatic and parallel beam at the energy of 20 or 21 keV and an exposure 196
time of 200 or 250 ms depending on the data acquisition session. Volume reconstruction was 197
performed from the radiographs corrected from flat field and background noise using an 198
algorithm based on the Fourier transform method (Marone and Stampanoni, 2012). 199
Image processing was achieved with Avizo® software. After reconstruction, the different sub-200
volumes at a given stage were stitched, resulting in volumes of about 1900×1250×5800 voxels. 201
Note that due to the large displacement of the vertical stage and recalculation of the rotation axis 202
during reconstruction, a slight mismatch at the junction between the different sub-volumes might 203
be observed. Then, the 3D grayscale volumes were normalized, converted to 8-bit integers, and 204
denoised with a 3D median filter. The crystals were subsequently registered in the same 205
coordinate system using the mutual information-based image registration approach (Maes et al., 206
1997). The different target volumes were aligned with the reference volume (at t0), using a
tri-207
linear interpolation technique to recalculate the gray value of the target voxels in the new 208
coordinate system (Gonzales and Woods, 1992). Registration efficiency was evaluated thanks to 209
marks identifiable inside the crystal, like micro-defects or micro-cracks. 210
9
2.3.1. Evaluation of the crystal volume and surface area. 211
Evaluation of the crystal volume was performed following two different ways. The first method 212
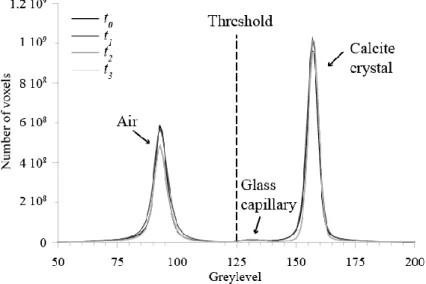
is based on the grayscale histograms of the XMT data sets. The three peaks for air, calcite and 213
glass capillary are clearly identifiable on the histograms (Figure 1), so that a simple threshold 214
value half-way between the peak for air and the peak for calcite is chosen, after removal of the 215
glass capillary peak. The calcite peak area represents the number of calcite voxels, and changes 216
in the peak area of calcite are directly linked to the amount of calcite removed by dissolution. 217
The second method is based on segmentation of the grayscale data sets to provide a discretized 218
geometry of the crystal. However, due to the large size of the data sets (~14 Gb), the volumes 219
were resampled by a factor of two in every direction and interpolated with a Lanczos window 220
function (Meijering et al., 2001) to reduce the volume size by an eight-fold factor before 221
segmentation. The voxel resolution of the resulting volumes is thus 0.65 µm. A region-growing 222
algorithm (Pitas, 2000) was used to separate the whole images into two phases, i.e. air and solid, 223
by selecting, based on their gray-level, a certain amount of voxels which belong with certainty to 224
one of the phases, and incrementally assigning indeterminate voxels to either the solid or the air 225
phase. Although the peaks for air and calcite are well separated on the histograms, this technique 226
is preferred over a simple thresholding method in order to remove the star artifacts present in the 227
air phase, especially at t0. Indeed, the star artifacts are very common at the intersection points of
228
angulated elements such as the crystal, pits or macro-steps edges, and they can be confused with 229
solid as they are very bright. After segmentation, the solid objects, i.e., crystal and capillary 230
glass, and the artifacts were labeled in order to separate and remove the capillary glass and the 231
artifacts from the images. The resulting volumes contain only the crystal. 232
The crystal volume Vcrystal (µm
3) is calculated at
i
t from the number of element solid voxels nsol,
233
i.e., Vcrystalnsol Vvoxel, with Vvoxel the volume of a voxel (0.65×0.65×0.65 µm
3). The amount of
234
calcite removed, ncalciteXMT, can be evaluated at any stage of dissolution from the XMT
235
volumes according to: 236 cal crystal i crystal t t calcite crystal i XMT calcite t V t V t t V t n i ( ) ( ) ) ( 0 0
Eq. 2 23710
where cal is the molar volume of calcite (m
3∙mol-1).
238
The crystal surface area (µm2) is calculated at ti from the number of solid-air pixel interfaces
239
(nsolair), i.e. Scrystal nsolairSpixel, withSpixel the surface area of a pixel (0.65×0.65 µm
2), which
240
is the smallest element of surface area at the fluid-crystal interface. Note that the whole crystal 241
was considered in the calculations, the surface area of the unreacted part of the crystal 242
representing only about 0.05 % of the surface area of the crystal. 243
244
245
Figure 1. Normalized histograms for the different XMT grayscale data sets. The differences in 246
the peak areas for calcite and air both show the amount of calcite removed by dissolution (i.e., a 247
decrease of the peak area of calcite and, as a result, an increase of the peak area of air). 248
249
2.3.2. Examination of surface topography evolution 250
Surface topography evolution was evaluated locally on some small portions of the crystal faces. 251
A few volumes of interest (VOIs) were extracted on faces 1, 2, and 3, from the grayscale data 252
sets, with the voxel size of 0.325 µm. The mean planes of the crystal surface extracts were 253
determined at t0 and registered in a horizontal plane. The transformation was applied to the other
254
VOIs, so that the topography evolution of the surface extracts is directly comparable. This 255
11
technique is preferred over the extraction of the VOIs from the segmented images, the direct 256
registration of which, in a horizontal plane, would highlight interpolation steps at the crystal 257
surface, which can be confused with crystal surface steps (see for instance Figure 2 shown in 258
Noiriel et al., 2019). After segmentation of the grayscale VOIs using the same procedure as 259
described above (see section 2.3.1), the topography of the fluid-solid interface was extracted. 260
When the surface displays some overlaps (as it is the case, for instance, when micro-cracks are 261
visible inside the crystal), the interface with the lowest surface elevation is selected. 262
2.3.3. Crystal dissolution rate 263
The global crystal dissolution rates rdiss (mol·s
-1) and rates normalized to the surface area of the
264
crystal rdissnorm (mol·m-2·s-1) were calculated after segmentation of the XMT data sets according
265
to the following equations, respectively: 266 t V r cal crystal diss Eq.3 267 and 268 t S V r cal crystal crystal norm diss , Eq.4 269
with t a time interval (s), and Vcrystal and Scrystal the change in crystal volume (m
3) and the
270
average crystal surface area (m2) between two stages of dissolution, respectively. 271
2.3.4. Measure and mapping of the local dissolution rate at the crystal surface 272
Following the methodology described in Noiriel et al., 2019, the local dissolution rate r'diss
273
(µm·h-1) can be determined at any element (i.e., fluid-crystal pixel interface) of the crystal 274
surface by analysis of the surface height retreat after each dissolution stage. In their study, the 275
surface retreat was calculated normal to the closest {1014} surface. In the present paper,
276
however, we have adopted a slightly different method in order to calculate the surface retreat 277
normal to any element of the crystal surface instead of the retreat normal to the {1014} surface.
278
This methodology is motivated by the fact that: (i) every dissolution stage at ti (starting from t1)
12
is compared with the previous one (ti1), and accounts for the changes of crystal morphology at
280
the edges and corners at any stage of dissolution, and (ii) the crystal has a morphology far more 281
complex than a simple rhombohedron. The method permits to measure the dissolution rate at the 282
crystal surface regardless the crystal geometry or orientation. 283
Practically, the 3D Euclidean distance maps (Akmal Butt and Maragos, 1998; Russ, 2011) 284
outside of the crystal were computed at any time ti (for i1 to i3). Consequently, each voxel
285
outside the crystal at a given time is labeled with the distance normal to its surface, starting from 286
the position of the fluid-crystal interface. Combining the distance map at ti with the position of
287
the fluid-crystal interface at ti1 gives the surface retreat of the crystal normal to the surface of
288
the crystal at the previous stage of experiment, as illustrated in Figure 2. In this case, for 289
instance, the surface retreat at the crystal edges (or corners) is the distance normal to the 290
considered edge (or corner), not the shortest distance (i.e., the distance normal) to the closest 291
{1014} surface.
292
Then, the local dissolution rate normal to the crystal surface is calculated according to: 293
dt d
r'diss Ifcn, Eq. 5
294
with If c the fluid-crystal position vector, and n the normal to the crystal surface; the product
295
n
Ifc is the surface retreat, i.e., the distance normal to the surface. The rate is expressed as a
296
retreat velocity at the surface (nm·s-1 or µm·h-1), but can be averaged at the crystal scale and 297
normalized to the surface area by (e.g., Arvidson et al., 2004): 298
fluid soln cal sol fluid dt d n
r Ifc n
1
'diss-norm , Eq. 6
299
with nsolfluid the number of voxels at the fluid-solid interface. It is also possible to determine the
300
rate of specific faces, edges or other crystal features by averaging the local dissolution rates from 301
VOIs defined in these areas: 302 j k dt d j r' 1 If c n , Eq. 7 303
13
with k being a face, an edge, a corner or another crystal pattern, and j the number of fluid-solid
304
interface pixels covering its surface. For the faces, VOIs of the same width (i.e, 150 pixels) were 305
chosen in the central part of the flat portions of the faces (except for face 3) to limit as much as 306
possible the contribution of edges to the determination of the rates. For the edges, VOIs of the 307
same section, i.e. 150×150 pixels for the obtuse edges (i.e., edges 4-1 and 2-3, between face 4 308
and 1, and face 2 and 3, respectively; see Figure 3 for location) and 125×150 pixels for the acute 309
edges (i.e, edges 1-2 and 3-4) were defined at the same location for the different stages of the 310
crystal evolution. As the crystal does not exhibit well identified corners, only one VOI around a 311
large 5-4-1 corner (i.e., at the intersection between faces 5, 4 and 1, see Figure 3 for location) 312
was selected. 313
The local dissolution rates are computed between the two first experiment stages (i.e., between 314
0
t and t1, and between t1 and t2) and can be directly mapped at the crystal surface, providing an
315
overview of the dissolution rate distribution. The rates are provided in terms of surface retreat 316
velocity, so that direct comparison is possible with data derived from AFM or VSI, provided that 317
the retreat is also measured normal to the surface with these techniques. Appendix A gives 318
further information about the measurement uncertainty, specifically inherent to the fluid-mineral 319
positioning and registration issues. Since the number of fluid-crystal interface pixels decreases as 320
dissolution progresses and the bin width of the histograms decreases with increasing dt, the
321
dissolution rate distributions are normalized to the distribution at t2 to allow for a better
322
visualization. 323
14
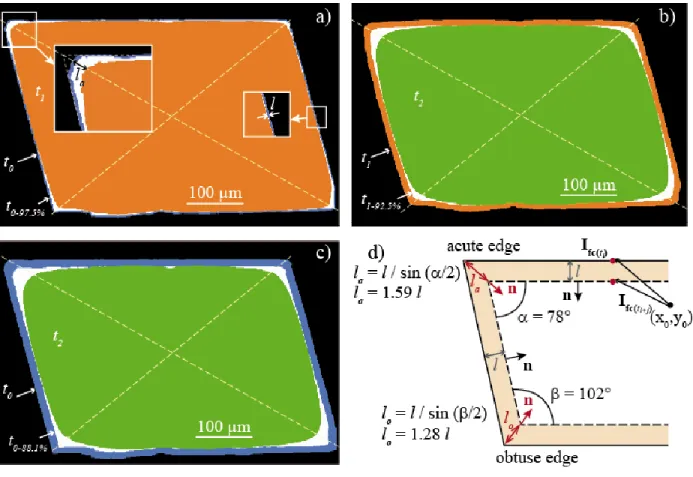
Figure 2. Determination of the surface retreat between two stages of dissolution. (a) 3D distance 325
map (grayscale) outside of the crystal (blue) at t1 (shown in 2D cross-section), which represents
326
the distance normal to the fluid-solid interface. Distance contours of 10 and 20 pixels (i.e., 6.5 327
and 13 µm) normal to the crystal surface are shown in red. (b) Combining the distance map with 328
the crystal at t0 (yellow) gives the retreat at the crystal surface between t0 and t1(inset (c)). Inset
329
(d) highlights that, assuming a uniform dissolution of the crystal faces, the distance measured at 330
the edge is actually the normal-distance to the edge, i.e. le, not the normal-distance to the surface
331
{1014} itself, i.e., l. n is the normal to the crystal surface at any point belonging to the
fluid-332
crystal interface. 333
2.4. Additional microscopic observations 334
In addition, characterization of the post-reacted sample was conducted using vertical scanning 335
interferometry (VSI) and scanning electron microscopy (SEM) to provide a higher resolution 336
characterization of the crystal surfaces. A Zygo New View 7300 VSI with a 50× Mirau objective 337
allowed for mapping surface topographies with a spatial sampling of 0.219 µm along the x and y 338
directions and an effective height resolution of 2-3 nm. The vertical scan range is however, 339
limited to 150 µm, so that observations were restricted to quite flat surfaces. SEM observations 340
were performed with a Jeol JSM-6360LV using the secondary electron mode. These 341
measurements and observations at finer resolution are complementary and will be compared to 342
XMT observations. 343
3. RESULTS 344
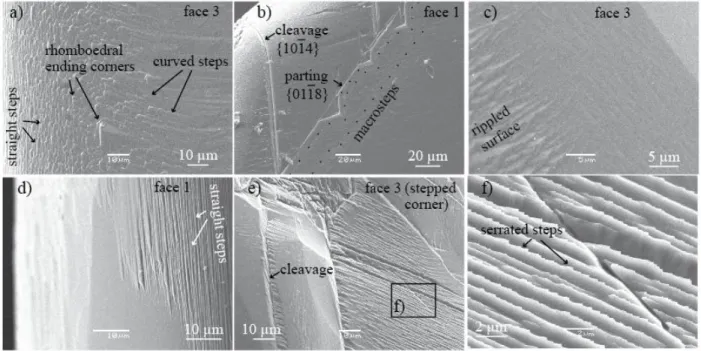
3.1. Evolution of the crystal morphology and surface topography 345
The initial crystal morphology, as described in section 2.1, is shown in Figure 3. Dissolution 346
proceeds with heterogeneous face retreat at different scales. 347
At the crystal scale, dissolution of the surface macro asperities such as macro-steps, crystal edges 348
and corners is faster than the average surface retreat (Figure 4), due to the development of 349
numerous steps over the crystal surface. As a result, the flat cleaved surfaces evolve 350
progressively toward curved-shaped surfaces and the crystal becomes rounder with time (Figure 351
15
4; see also topography profiles in Figure 7). In contrast, dissolution of the topographic lows and 352
at the base of the macro-steps is slower than in the surrounding areas (Figure 4c). 353
At the face scale, the crystal topographies exhibit different evolutions depending on the initial 354
face morphology. At t1, the flat faces (i.e. portions of face 1, 2 and 4) are covered by sparse,
355
macro etch pits (Figure 5 and Figure 6), whereas the step-like face (i.e., face 3) does not exhibit 356
any etch pits (Figure 8). The pits certainly result from merging of smaller pits that were formed 357
at the surface at t8h, similarly to what has been observed in a comparable experiment at
358
shorter times (Noiriel et al., 2019). The pits are about 90-160 µm in size and 4-7 µm in depth. 359
Their density is variable depending on the face and location, about 100-130 per mm2. Several 360
etch pits are likely formed with the assistance of surface micro-defects, i.e., surface scratches, or 361
micro-cracks that can be evidenced inside the crystal (Figure 6a). Their geometry is complex 362
(Figure 6e), and they are generally deeper and remain longer visible than the others. With further 363
reaction (i.e., at t2 and t3), the pits of the flat faces tend to annihilate, with a density decreasing
364
to about 40 per mm2. This observation confirms the trend in decreasing pit density with 365
increasing dissolution observed in Noiriel et al., 2019. In fact, the development over the surface 366
of numerous steps from the edges progressively annihilate the development of macro-pits, which 367
vanish either by coalescence or by intersecting train of steps coming from the near edge region 368
(Figure 5b,c). Some pits whose dissolution rate becomes at some point slower than the surface 369
average retreat are also evidenced (Figure 5b,c). The anisotropy in step velocitiesbetween obtuse 370
and acute steps developed parallel to the crystallographic directions [441] and [481], which
371
results in asymmetrical pit formation, is also visible (Figure 5b and Figure 6b). 372
The evolution of face 3 with a 5° miscut angle is different from the cleaved faces. The surface, 373
which contains a much higher density of steps, does not exhibit any etch pit formation (apart a 374
few small ones along a cleavage continuity (Figure 8)), but the initially curved macro-steps 375
evolve to rippled or serrated steps with potentially rhombohedral endings near the edges (Figure 376
9a). 377
In addition, dissolution is enhanced along straight asymmetric topographic lows corresponding to 378
{1014} cleavages (Figure 5 and Figure 8) or {0118} parting planes (Figure 9b) that were
379
certainly created during crushing and size reduction of the original crystal. For example, the 380
16
{1014} cleavage identified at the bottom surface of face 1 reaches about 10 µm in depth from t2
381
(Figure 5a and Figure 7a). Dissolution at cleavages is also anisotropic along the [481] direction,
382
similarly to what is observed at etch pits. Conversely, dissolution at parting planes does not 383
appear anisotropic. Nevertheless, it generates macrosteps at the crystal surface, probably inherent 384
to step propagation along these discontinuities (Figure 9b). 385
Finally, the edges are covered with either macrosteps with long straight edges or highly kinked 386
macrosteps with rhombohedral ending (Figure 9a,c,d). Their morphology actually depends on the 387
intersection between the calcite dissolution planes with the curved topography of the crystal 388
(Figure 8 and Figure 9). The patterns have similarities with those observed at finer scale on 389
misoriented polished surfaces (Bisschop et al., 2006; Smith et al., 2013). However, with further 390
dissolution, it is worth noting that some flat surface portions reappear near the crystal edges 391
(Figure 9c,d and Figure 5), often in the continuity of former etch pit propagation direction. 392
17
Figure 3. (a) Volume rendering of the initial calcite crystal obtained from XMT and (b) 394
schematic representation of the crystal morphology, with numbering of the different faces, edges, 395
and corner. (c)-(d) Detailed surface patterns: (c) detail from face 1, showing a well cleaved 396
{1014} surface plane with macrosteps; the face is also intersected by several {0118} parting
397
planes, (d) detail from top part of face 3 covered by curved macrosteps and view of the rough 398
crystal top showing many intersecting {1014} planes.
399
400
Figure 4. Volume rendering of the calcite crystal obtained from XMT at time (a) t1 and (b) t3.
401
(c) Cross-section of the superimposed segmented volumes from t0 to t3 showing heterogeneous
402
surface retreat and rounding of the edges. The retreat between t0 and t1 is shown in light blue,
403
between t1 and t2 in dark blue, and between t2 and t3 in red; the crystal at t3 is in green. (d)
404
Volume rendering of the top part of face 3 at t1.
405 406
18 407
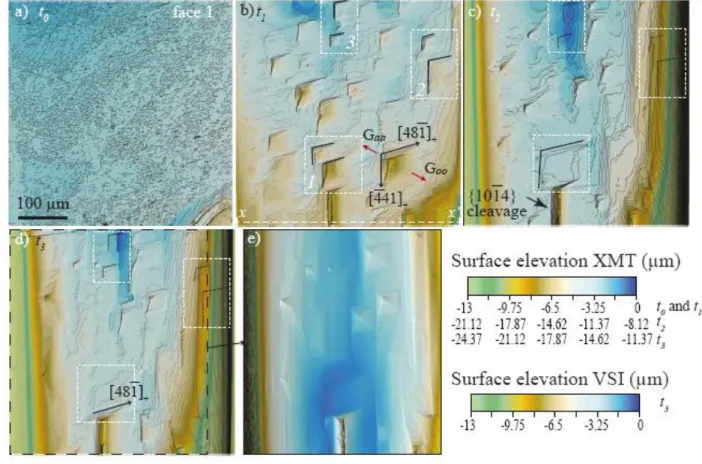
Figure 5. Evolution of etch pit morphologies at the crystal surface. (a)-(d) XMT-derived 408
topography for a surface extract of face 1 (455 × 455 µm2), from t0 to t3. Note that the highest
409
surface elevation at t0 was set arbitrarily to 0, and that the range of elevations was shifted by
410
8.12 and 11.37 µm for t2 and t3, respectively. The figure shows pit annihilation by coalescence
411
of two pits (inset 1), by intersection with a train of steps (inset 2) or by decrease of its rate of 412
formation compared to the average surface retreat (inset 3). The black dotted lines correspond to 413
the reported position of some etch pits at t1. The white dotted xx’ line in (b) denotes the position
414
of the topographical profiles shown in Figure 7a. (e) VSI-derived topography at t3. Note that the
415
image is not exactly superimposable with the corresponding XMT image and that the origin for 416
vertical range is arbitrary. 417
19 418
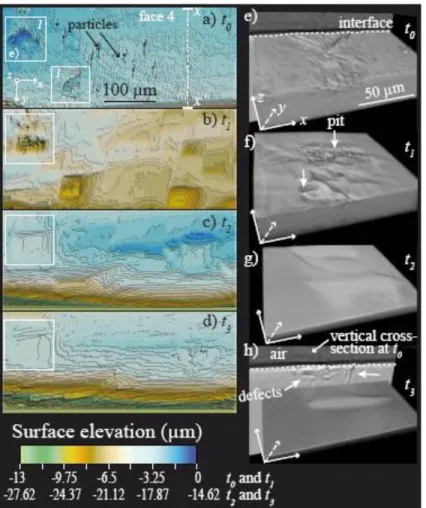
Figure 6. Evolution of etch pit morphologies at the surface of face 4 (surface extract of 455 × 419
195 µm2) (a)-(d) XMT-derived topography from t0 to t3. Note that the highest surface elevation
420
at t0 and t1 was set arbitrarily to 0, and that the range of elevations was shifted by 14.62 µm for
421
2
t and t3. (e)-(h) Details of the evolution of a pit geometry (3D rendering view) which initiated
422
thanks to macro-defects that are visible at the surface (inset 1) and also inside the crystal. Note 423
that the views are flipped vertically compared to the orientation in (a)-(d). The vertical white 424
dotted xx’ line in (a) denotes the position of the topographical profiles shown in Figure 7b. 425
20 426
Figure 7. Topography evolution (xx’ profiles) of (a) face 1 (b) face 4 and (c) face 3 at the 427
different times of the experiment (see Figure 5, Figure 6 and Figure 8 for the localization of the 428
profiles). The red dashed line underlines the position of the {1014} cleavage direction. The blue
429
dashed lines underline the direction of the [481] and [481] facets at t2.
430 431
432
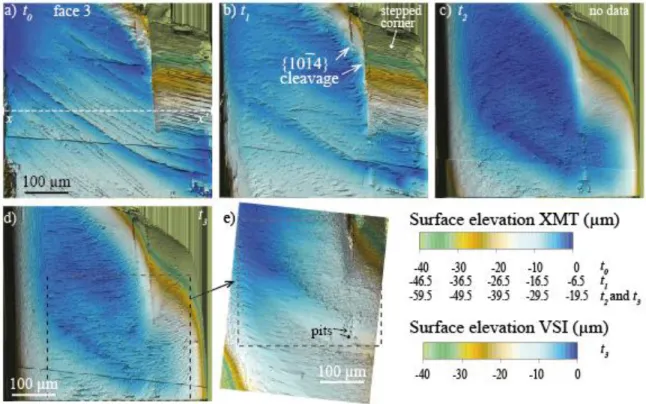
Figure 8. Evolution of the surface morphology of face 3. (a)-(d) XMT-derived topography from 433
0
t to t3 (surface extract of 487 × 487 µm2). Note that the highest surface elevation at t0 was set
434
arbitrarily to 0, and that the range of elevations was shifted by 6.5 µm for t1, and by 19.5 µm for
21
2
t and t3. (e) VSI-derived topography at t3. Note that the image is not superimposable with the
436
corresponding XMT image and that the origin for vertical range is arbitrary. The horizontal 437
dotted xx’ line denotes the position of the topographical profiles shown in Figure 7c. 438
439
Figure 9. SEM observations of the calcite crystal at t3. (a) Rhombohedral ending corners at the
440
junction between straight steps and curved steps at the crystal edge 2-3. (b) Anisotropic 441
dissolution across a {1014} cleavage and dissolution across a {0118} parting plane intersecting
442
several {1014} cleavages; the black dots underline macrosteps propagating at the crystal surface
443
from the parting plane. (c) Transition between rippled steps and flat surface portion at the crystal 444
edge 3-4. (d) Transition between straight steps and flat surface portion at the crystal edge 1-2. (e) 445
Highly cleaved and fractured area near cleavages (stepped corner of face 3, see Figure 8 for 446
location) exhibiting (f) serrated steps. 447
448
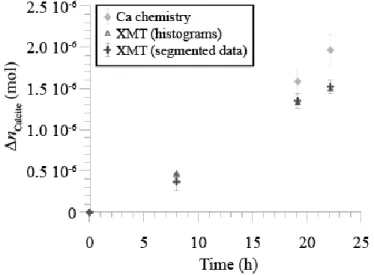
3.2. Global dissolution rate and surface rate distributions 449
The experimental calcite crystal dissolution takes place under far-from-equilibrium conditions, 450
with the saturation state (IAP /Kscalcite) remaining below 10
-9. The amount of dissolved
451
calcite derived from XMT and chemical balance is depicted in Figure 10. First, the figure shows 452
22
that the amount of calcite derived from the XMT processing techniques, i.e. the (i) grayscale 453
histograms and (ii) segmented data sets, are in very good agreement. However, at t2 and t3, the
454
results are slightly lower than ncalcitechem derived from chemical analyses.
455
456
Figure 10. Amount of calcite dissolved during the experiment, calculated from XMT grayscale 457
or segmented data sets (ncalciteXMT) and from Ca chemical balance (ncalcitechem). The error bar
458
on the data derived from XMT segmented data set is calculated assuming an error of ± 1 pixel 459
(i.e., 0.65 µm) on the position of the fluid-crystal interface. 460
461
Analysis of the XMT segmented data shows that both the crystal volume and surface area 462
decrease during dissolution (Table 2). At the end of the experiment, 21.4% of the crystal was 463
dissolved. The global dissolution rates, rdiss, as well as the average surface normalized rates,
464
norm diss
r , are also presented in Table 2. In this study, the global rate was normalized to the
465
surface area determined at the scale of the XMT imaging technique. The specific surface area of 466
the unreacted crystal determined this way is 43.9 cm2·g-1, which is 2.7 times smaller than the 467
surface area determined by BET (Brunauer et al., 1938) on similar calcite crystals (120 cm2·g-1, 468
Noiriel et al., 2012). As expected, the global rate is higher at pH 4.0 (9.25×10⁻⁶ molm-2s-1) than 469
at pH 4.5 (5.46×10⁻⁶ ± 1.21×10⁻⁶ molm-2s-1). The rate determined at pH 4.0 is in good 470
agreement with the data obtained by Noiriel et al., 2019 using the same technique and at the 471
23
same pH value. The rate determined at pH 4.5 seems to increase with increasing dissolution time, 472
but it is difficult to decipher whether it results from the crystal geometry changes or from the 473
preceding dissolution stage at pH 4.0 (i.e., between t1 and t2).
474
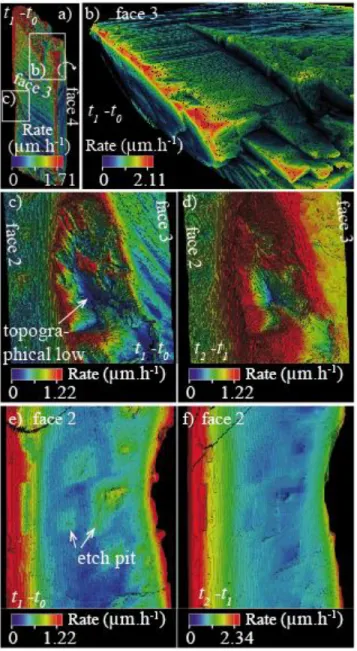
More interesting is the evaluation of the local dissolution rates directly mapped at the crystal 475
surface (Figure 11), as well as the derived rate distributions (Figure 12). The local dissolution 476
rates at the crystal surface reaches on average 0.59 (between t0 and t1), 1.34 (between t1 to t2),
477
and 0.94 µm·h-1 (between t2 to t3) (Table 2). The average local normalized rates, '
norm diss
r , differ
478
slightly from the average global rates, rdissnorm, which are in turn normalized to the total crystal
479
surface area (Table 2). Mapping of the dissolution rates confirm the observations made from the 480
surface retreat. The average dissolution rate results from the contribution of the different crystal 481
surface patterns to dissolution at very different rates. The reactivity extracted from small VOIs at 482
the crystal corner ( ' corner
r ) and edges (redge' ) appears to be the fastest process, followed by the
483
reactivity of the cleavage micro-fractures and parting planes ( ' cleavage
r ), macrosteps (rmacrostep' ) and
484
etch pits ( ' pit
r ), faces, and finally topographic lows and base of macrosteps (rmacrostep' base) (Figure
485
11 and Figure 12b,c). 486
24 487
Figure 11. Mapping of the local dissolution rate '
diss
r (µm·h-1) at the crystal surface. (a) Mapping
488
of the whole crystal between t0 and t1, showing higher rates at the crystal edges and corners. (b)
489
Detail of the stepped corner in face 3. (c)-(d) Detail of the topographic low at the edge 2-3 at (c) 490
pH 4.5 (i.e., between t0 and t1) and (d) pH 4.0 (i.e., between t1 and t2). (e)-(f) Detail of the
491
local rates at the surface of face 2 at (e) pH 4.5 (i.e., between t0 and t1) and (f) pH 4.0 (i.e.,
492
between t1 and t2). Note that values in red exceed the maximum values indicated in the scale
493
bars. 494
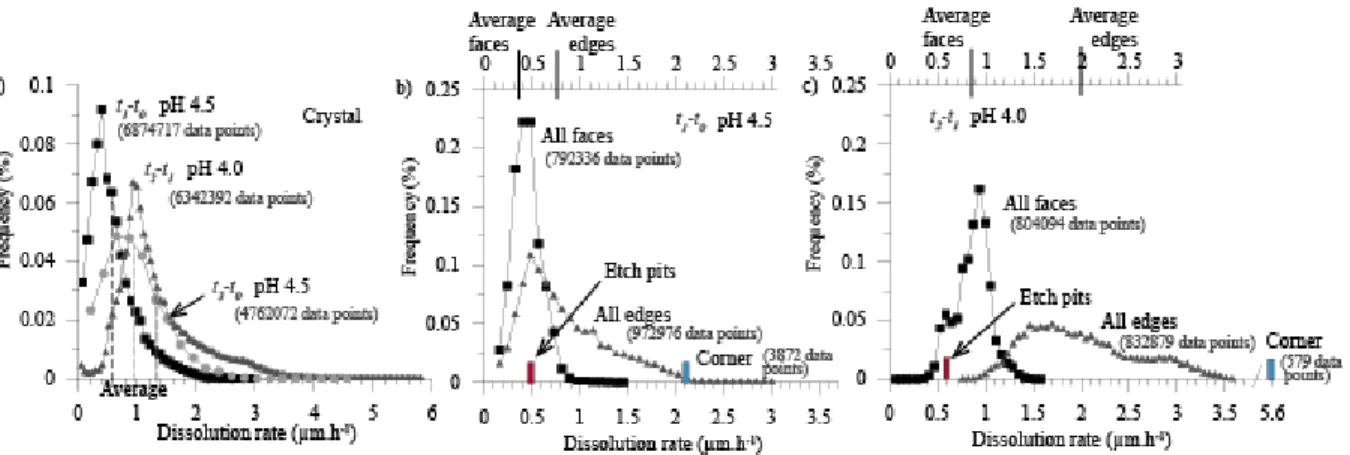
25 496
Figure 12. (a) Local rate distribution at the surface of the whole crystal. The rates are normalized 497
to the distribution at t2 for the sake of visualization. (b)-(c) Averaged rates determined for the
498
four faces and edges (extracted from 8 different VOIs), and for the corner (extracted from 1 499
VOI) at (b) pH 4.5 (i.e., between t0 and t1) and (c) pH 4.0 (i.e., between t1 and t2). The rates
500
evaluated for the etch pits shown in Figure 11e,d are also presented. The number of data points 501
in the VOIs used for the calculation of the histograms is also indicated. 502
503
4. DISCUSSION 504
4.1. Application of X-ray micro-tomography for tracking crystal reactivity 505
XMT is a noninvasive and nondestructive imaging technique relying on the 3D reconstruction of 506
a sample from a series of 2D radiographic projections taken at about a thousand of different 507
angular positions over 180°. The development of fast detection systems, high-quality optics, high 508
data rate streaming and computational capabilities has resulted in new perspectives for the 509
application of XMT imaging (Marone and Stampanoni, 2012; Villanova et al., 2017), such as in 510
situ dynamic tracking of fast reactions with a micrometric resolution, or ex situ imaging with a
511
submicrometric resolution (i.e., with a pixel size up to about 50 nm) at well-spaced intervals, like 512
in this study. 513
Admittedly, XMT has a lower resolution than VSI, especially in the direction perpendicular to 514
the surface. For instance, XMT and VSI maps reported in Figure 5d,e and Figure 8d,e show that 515
26
the finest details are not resolved, like the pit topography or some surface details. However, there 516
is a high degree of consistency between the methods, and all the etch pits observed with VSI are 517
identifiable with XMT. XMT reveals also a good match with SEM observations in areas where 518
VSI is unable to capture the surface elevation due to steep topographical changes (Appendix B). 519
Comparison of VSI and XMT techniques for five different profiles at the surface of face 1 520
(Figure A.1 in Appendix A) shows that XMT effectively may misestimate the position of the 521
fluid-mineral interface, especially at high elevations. An uncertainty estimate of ±1 pixel seems 522
nonetheless reasonable when comparing the different profiles. The inability of XMT to capture 523
some surface details does not arise only from the imaging resolution, and some inherent noise 524
can also alter the images. Indeed, XMT does not provide a direct measurement of the surface 525
topography. Conversely, the topography is extracted from the 3D reconstructed grayscale 526
volumes of the crystal after segmentation. This makes the accuracy on the fluid-mineral 527
positioning dependent on the grayscale image quality. In particular, the star artifacts, which are 528
noticed over the crystal surface (especially in the data set at t0), manifest themselves as bright or
529
dark streaks where angular shapes exist, like at the crystal edges, in micro-cracks and etch pits. 530
Consequently, they can introduce a bias locally on the topography extracted by altering image 531
segmentation (see, for instance, the vertical depressed area around the particles in Figure 6a). In 532
particular, they were identified to be the cause of the topography alteration near the high 533
elevation patterns. 534
Nevertheless, the technique has advantages over other surface-sensitive methods, as there is no 535
restriction on the crystal orientation or geometry, especially in terms of face orientation or 536
surface roughness, so that any type of crystal or surface morphology can be analyzed. No 537
specific preparation that can affect mineral reactivity (e.g., polishing or crushing) is required, and 538
the whole crystal geometry is provided, accounting for the reactivity of all the faces, edges and 539
corners. In addition, experiments are not restricted to small surface retreat due to unlimited 540
vertical range, so that exploration of reactivity on the long term is possible. The technique also 541
allows for recalculating the changes in the geometric surface area with time, something useful 542
for the conventional rate normalization. Finally, XMT can provide extra information about 543
defects that are located below the surface, i.e., inside the crystal, such as micro-cracks, 544
27
cleavages, fluid or mineral inclusions, which can contribute at some point to the reactivity, but 545
are hidden from the view of other techniques measuring the topography. 546
Then, the reliability of the method to provide accurate rate distributions from experiments 547
performed ex situ relies on the ability to perfectly reference the sample in the same coordinate 548
system, as the crystal has to be moved in and out of the beamline between acquisitions and 549
dissolution experiments. In this case, registration problems can also affect the accuracy of the 550
surface retreat determination (Figure A.2 in Appendix A). In the present study, for instance, 551
clipping of the crystal in three sub-volumes which exhibit a small mismatch and rotation axis tilt 552
did not make registration of the crystal perfectly accurate. When the retreat is too small 553
compared to the pixel size (e.g., between t2 and t3), it increases the relative error on the retreat
554
determination. However, this problem of registration could be easily overcome in the future by 555
limiting imaging of the whole crystal to one data set, thus decreasing the pixel size for the crystal 556
to fit in the field of view of the camera, or by creating some masked areas at the crystal surface 557
to facilitate 3D registration of the different data sets. 558
4.2. Contribution of the crystal edges and corners 559
Dissolution at edges and corners increases the population of step and kink sites over time 560
(Arvidson et al., 2003; Briese et al., 2017; Chen et al., 2014; Lüttge et al., 2013), consistently 561
with larger dissolution rates measured at the crystal edges and corners. During dissolution of 562
calcite at pH 4.0, Noiriel et al., 2019 estimated the dissolution rate of the crystal edges to be 1.7 563
times higher than the faces. The results are consistent with this study, where the rate was found 564
to be 2.0 (pH 4.5) and 2.1 times (pH 4.0) higher in average at the crystal edges (Figure 12b,c). 565
The only difficulty in quantifying the contribution of the crystal edges is that their limits become 566
undefined from t0, i.e. from the time that the sharp edges evolve to rounded ones, so that the rate
567
distribution at the edges depends on their extension in the VOIs used for calculation. 568
Although the edge regions are likely to be dominated by macro-steps, i.e., merged steps formed 569
by step bunching, step pinning and step-step interactions (Bonzel, 2003; Smith et al., 2013), 570
whose velocity is decreased compared to monolayer steps (Akutsu, 2014), it does not limit the 571
lateral extension of the vicinal r-plane edge surfaces from the edges, as suggested by the rounded 572
topographical profiles (Figure 7). By extending the asymmetrical facets of the cleavage in the 573
28
] 1 48
[ and [481] directions up to the initial surface (red and blue dashed lines in Figure 7a),
574
we estimate obtuse (v) and acute (v) step velocities of 1.5 and 0.64 nm·s-1 between t0 and t2
575
(Figure 7a), two values lower but in reasonable agreement with the velocities obtained at pH 4.3 576
by De Giudici, 2002 (i.e., 4.3 and 1.1 nm·s-1 for steps oriented along the two equivalent 577
directions [441] and [481], and [441] and [481], respectively). These values are largely
578
higher than the face-specific (i.e., normal to the surface) average retreat velocities of 0.1 (pH 4.5) 579
and 0.24 nm·s-1 (pH 4.0) (Figure 12b,c), that could be assumed to result, in first approximation, 580
of the layer-by-layer stripping during stepwave propagation. Compared to the average retreat 581
velocities of 0.21 (pH 4.5) and 0.55 nm·s-1 (pH 4.0) determined at the crystal edges, this also 582
supports the assumption that the step density coming from the edges is higher than those coming 583
from the flat surface. Consequently, contribution of the crystal edges to dissolution through the 584
propagation of high velocity trains of steps overrides progressively the effects of the dissolution 585
normal to the {1014} faces through pit formation and growth (i.e., the face-specific dissolution).
586
This finding compares also well with a macroscopic comparison model between the 587
experimental dissolution of the crystal (hereinafter referred to as the experiment) and a 588
hypothetic, uniform dissolution of the crystal faces (hereinafter referred to as the uniform 589
dissolution case). Uniform dissolution of 2.5% (from the crystal geometry at t0) and 7.9% (from
590
the crystal geometry at t1) in volume of the crystal faces allows for the faces of the scaled crystal
591
to fit in the faces of the real crystal at t1 and t2, respectively (Figure 13a,b). Based on the
592
volume ratios of the crystal in the experiment over the uniform case, accounting for the 593
contribution of the edges shows that the dissolution rate in the experiment is roughly 2.1 time 594
faster between t0 and t1, and 1.5 time faster between t1 and t2compared to what would be a
595
face-specific contribution in the uniform dissolution case. Overall, between t0 and t2, the
596
dissolution rate is 1.6 time higher in the experiment compared to the uniform dissolution case. 597
These results are consistent with the edge-to-surface retreat ratios, as defined by: la /l and lo /l
598
for acute or obtuse edges (with l the retreat normal the face surface, and la and lo the retreat
599
normal to the acute and obtuse edges, respectively). The ratios la /l and lo /l are equal to 1.59
600
and 1.28, respectively, for a uniform dissolution of a parallelogram, as illustrated in Figure 13d. 601
Calculating the ratios from the XMT data show that the dissolution along the edge bisectors is 602
29
overall 2.4 time faster in the experiment compared to the uniform dissolution case. Rounding of 603
the crystal edges is thought to decrease the edge to surface retreat ratio with increasing 604
dissolution, although it is still visible at t3 (pH 4.5) that the edges have a higher surface retreat
605
than the faces (Figure 4c). 606
Finally, it is also possible that the crystal edges experience a higher diffusive flux at their surface 607
in relationship with local hydrodynamic conditions, as dissolution of calcite is diffusion-limited 608
far from equilibrium under acidic pH (Plummer et al., 1978; Rickard and Sjöberg, 1983), with 609
the result of enhancing their progressive control to crystal dissolution. Nevertheless, Saldi et al., 610
2017 suggested that the reactivity of edges and corners is not limited to low pH and far-from-611
equilibrium conditions, and should also be considered carefully at basic pH and near equilibrium 612
conditions, as the edges can also be the main source of steps moving while etch pit nucleation at 613
point defects and dislocation would be comparatively unfavorable in these conditions. 614
615
Figure 13. Superimposed cross-sections of the crystal (a) at t0 (blue) and t1 (orange), (b) t1 and
616
2
t (green), and (c) t0 and t2, and comparison with a hypothetic, uniform dissolution of the
30
crystal faces of 2.5% (a), 9.7% (b) and 11.9% (c) in volume (white). Inset 1 shows that the edges 618
are not necessarily sharp, even at t0. The white area corresponds to the difference of volume of
619
material removed between the experimental data and the model of uniform dissolution of the 620
crystal faces (i.e., ignoring the edge contribution). (d) Sketch comparing the surface retreat 621
normal to the {1014} faces (l) and at the acute (la) and obtuse (lo) edges for a uniform
622
dissolution of the crystal faces; n is the normal to the surface. 623
624
4.3. Size- and time-dependent reactivity model 625
The rate data determined in this study are characteristic of the present crystal (i.e., with a given 626
size and aspect ratio), but, all in all, these observations point out that the edge to face-specific 627
contribution will be size-dependent. To the first order, the respective contribution of edges and 628
faces to crystal dissolution can be modeled using simple geometric considerations that are 629
detailed in Appendix C. To emphasize the role of the crystal edges, an ideal case of uniform 630
dissolution of the faces, similar to the actual sketch represented in Figure 13d was compared to a 631
dissolution case including extra contribution of the edges to the dissolution flux (hereinafter 632
referred to as the non-uniform dissolution case). The contribution of the edges to the dissolution 633
flux was approximated to that of the development of facets with an orientation normal to the 634
bisectors of the four angles that define an ideal parallelogram. Importantly, our approach is not 635
mechanistic but geometric; as a consequence, it provides a lower bound for the actual 636
contribution of edges, since the lateral propagation of steps from the edges on the surface is 637
ignored. 638
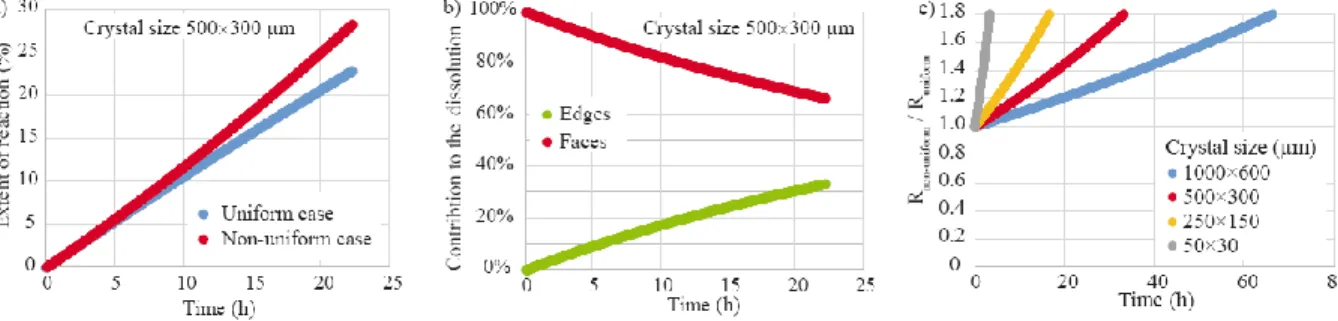
The evolution of the expected extent of reaction of a model crystal with dimensions similar to the 639
one used in the present study (500×300 µm) with no extra contribution of the edges (uniform 640
dissolution case) is compared to that of a crystal with preferential dissolution occurring at the 641
edges (non-uniform dissolution case) (Figure 14a,b). The rate parameters were derived from the 642
dataset discussed in the previous section. As can be seen, the contribution of edges is responsible 643
for a deviation from the sub-linear trend depicted by the trend observed for the uniform case 644
(Figure 14a). After 22.1 hours (corresponding to the duration of the experiment), the extent of 645
reaction is 25% greater because of the contribution of edges, whose dissolution is roughly 646
31
responsible for one third of the dissolution flux (Figure 14b). This contribution is anticipated to 647
become increasingly significant as the dissolution proceeds and the crystal shrinks. 648
As a consequence, an important concern is how these results obtained with a crystal having the 649
dimensions of the one used in the present study translates to crystals with other grain sizes 650
typical of those used in powder dissolution experiments. To address this question, sensitivity 651
tests were performed and are depicted in Figure 14c, which represents the evolution of the ratio 652
of the non-uniform (i.e., where the reactivity of edges is considered to be similar to that 653
measured in the present study) over uniform (i.e., where the reactivity of edges is dictated by the 654
inwards progression of faces) calcite dissolution rate as a function of time. A ratio greater than 1 655
corresponds to a dissolution rate that is gradually driven by edges, whereas a value of 1 indicates 656
that the contribution of edges is not significant, and that the classical normalization of the rates to 657
the surface area may remains valid. As can be expected, the contribution of edges increases when 658
the grain size decreases (Figure 14c). Over durations as short as ~3 days, the enhanced 659
dissolution at edges is responsible for doubling the dissolution flux for crystals with arbitrary 660
dimensions of 50×30 µm. The time required to reach such a value is obviously much longer as 661
the crystal size increases, and can be as high as ~2 months for crystals in the mm-size range. 662
These results illustrate how sensitive is the dissolution of calcite crystals to the crystal size, an 663
effect which must be taken into account when running powder dissolution experiments, and 664
which is less significant for, for instance, VSI experiments conducted with cm-sized crystals. 665
These results also challenge the proper definition of a unique and time-invariant “dissolution rate 666
constant” for crystals, as previously emphasized by Pollet-Villard et al., 2016a or Briese et al., 667
2017, with similar arguments. 668
669
Figure 14. (a-b) Outputs of the geometric model of calcite dissolution, for a 500×300 µm crystal 670
size similar to the one investigated by XMT. (a) Evolution of the extent of reaction for uniform 671