HAL Id: hal-00318122
https://hal.archives-ouvertes.fr/hal-00318122
Submitted on 9 Aug 2006
HAL is a multi-disciplinary open access
archive for the deposit and dissemination of
sci-entific research documents, whether they are
pub-lished or not. The documents may come from
teaching and research institutions in France or
abroad, or from public or private research centers.
L’archive ouverte pluridisciplinaire HAL, est
destinée au dépôt et à la diffusion de documents
scientifiques de niveau recherche, publiés ou non,
émanant des établissements d’enseignement et de
recherche français ou étrangers, des laboratoires
publics ou privés.
Gadanki radar observations of daytime E region echoes
and structures extending down to 87 km
A. K. Patra, S. Sripathi, P. B. Rao, R. K. Choudhary
To cite this version:
A. K. Patra, S. Sripathi, P. B. Rao, R. K. Choudhary. Gadanki radar observations of daytime E
region echoes and structures extending down to 87 km. Annales Geophysicae, European Geosciences
Union, 2006, 24 (7), pp.1861-1869. �hal-00318122�
www.ann-geophys.net/24/1861/2006/ © European Geosciences Union 2006
Annales
Geophysicae
Gadanki radar observations of daytime E region echoes and
structures extending down to 87 km
A. K. Patra1, S. Sripathi2, P. B. Rao3, and R. K. Choudhary4 1National Atmospheric Research Laboratory, Tirupati, India
2Indian Institute of Geomagnetism, New Panvel, Navi Mumbai, India 3National Remote Sensing Agency, Balanagar, Hyderabad, India
4Institute of Space and Atmospheric Studies, University of Saskatchewan, Saskatoon, Canada
Received: 6 February 2006 – Revised: 25 May 2006 – Accepted: 8 June 2006 – Published: 9 August 2006
Abstract. Observations of daytime E region echoes
extend-ing to altitudes as low as 87 km made usextend-ing the Gadanki MST radar are presented. The echoing regions display de-scending layer resembling the characteristics of tidal winds and show structures with periods 2-4 min having both pos-itive and negative slopes. At the center of the layer where strongest SNR is observed, the velocity is maximum and spectral width is minimum. At altitudes slightly above and below, where SNR is relatively low, velocity is low but spec-tral width is maximum. Daytime observations of echoes ex-tending to such a low altitude and associated structures akin to nighttime quasi-periodic echoes throughout the observa-tional period are the most significant results, not reported earlier from Gadanki and other locations. Other notable re-sults are large SNR (as high as 15 dB) and spectral width (as high as 70 m/s) at the bottommost altitudes, where collisional damping of the plasma waves is significant.
Keywords. Ionosphere (Equatorial ionosphere; Ionospheric
irregularities; Plasma waves and instabilities) – Meteorology and atmospheric dynamics (Turbulence)
1 Introduction
In the last one and half decade, there have been remark-able efforts to characterize and understand the generation mechanisms of mid- and low-latitude E region electron den-sity irregularities and structures. Much attention has been paid to understand the genesis of quasi-periodic (QP) echoes, which were discovered by Yamamoto et al. (1991) using MU radar at Shigaraki, Japan. Initially thought to be an exclu-sive mid-latitude phenomenon, these echoes, although not as frequent, have now been detected from the low latitude stations like Gadanki (13.5◦N, 79.2◦E, 6.4◦N Geomagnetic
Correspondence to: A. K. Patra
(akpatra@narl.gov.in)
Latitude) in India (Choudhary and Mahajan, 1999; Choud-hary et al., 2005) and Piura (5.2◦S, 80.63◦W, 7◦N
Geomag-netic Latitude) in Peru (Chau and Woodman, 1999) as well. They usually occur above 100 km during the night and have periods in the range of 2–20 min.
Another interesting aspect that has caught the researchers’ attention are the plasma irregularity structures coming from the altitude below 100 km which have periods in the range of a few tens of seconds to 3 min (Urbina et al., 2000; Rao et al., 2000; Patra et al., 2002; Pan and Rao, 2002; Sripathi et al., 2003). Due to their occurrence at lower altitudes, they are also referred to as low-altitude-QP (LQP) echoes to dif-ferentiate them from the well-known QP echoes occurring at higher altitudes. While LQP echoes are known to occur both at low- and mid-latitudes, their occurrence during day-time have been reported only from low-latitude over Gadanki (Pan and Rao, 2002; Sripathi et al., 2003).
In this paper, we revisit the daytime plasma irregularity structures coming from lower E region using an experiment conducted with the Gadanki radar at a very high range res-olution (∼150 m). Observations show a descending echo layer, which is about 3–4 km thick in altitude and has quasi-periodic structures embedded in it. A descending echo layer having a thickness of ∼3 km in altitude and extending down to height region as low as 88 km over Gadanki has already been reported by Choudhary et al. (1996). However, since the observations were taken for 10 min every half an hour with a range resolution of 600 m, there was not enough tempo-ral and spatial information to go beyond the mere discovery stage. Later on, Sripathi et al. (2003) showed the structures associated with the descending daytime echo layer, but since those were detected only for a limited time interval above 93 km, many details of these irregularity structures could not get revealed. In the present communication, we present the observations, which show the occurrence of field aligned ir-regularity echoes almost continuously during the entire ob-servation period of about 7.5 h. Of special interest is the
1862 A. K. Patra et al.: Lower E-region irregularities at Gadanki
Table 1. Radar specifications and important parameters used for the
E region field-aligned irregularities experiment.
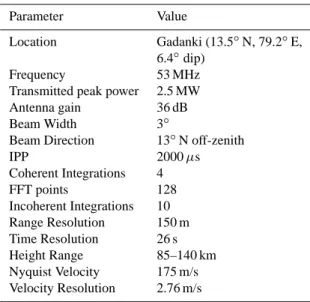
Parameter Value
Location Gadanki (13.5◦N, 79.2◦E, 6.4◦dip)
Frequency 53 MHz Transmitted peak power 2.5 MW Antenna gain 36 dB Beam Width 3◦
Beam Direction 13◦N off-zenith
IPP 2000 µs Coherent Integrations 4 FFT points 128 Incoherent Integrations 10 Range Resolution 150 m Time Resolution 26 s Height Range 85–140 km Nyquist Velocity 175 m/s Velocity Resolution 2.76 m/s
generation of plasma irregularities itself, which produce such coherent echo layer and the quasi-periodic structures embed-ded there in from the height range where collisional damping of the plasma waves is believed to be significant. We believe that the present observations provide a number of important information as far as the daytime low altitude E region FAI and associated structures are concerned.
2 Observations
The low altitude radar echoes reported here were made using the 53 MHz MST radar (Rao et al., 1995) located at Gadanki (79.2◦E, 13.5◦N, 6.3◦N dip latitude). The experimental
parameters used for the observations are given in Table 1. The experiment was conducted at a high range resolution of 150 m. Since for the E-region experiments, the radar beam is generally pointed 13◦away from vertical and our two-way beam width is about 2◦, the ambiguity in converting range to an actual altitude is of the order of only 550 m (Patra et al., 2002). In other words, a displacement in horizontal position as opposed to altitude could introduce a 550 m uncertainty in the determination of the altitude. This includes the uncer-tainty introduced by the refraction of the incident wave.
Figure 1 shows height time intensity (HTI) map of a low altitude echoes observed at Gadanki from the height range between 87 km and 98 km during 12:12 to 19:48 LT on 3 September 1997. The blank spaces in the HTI map rep-resent the period when the radar was shutdown due to tech-nical reasons. Height represents the vertical distance above the radar site, which is located about 400 m above the mean-sea-level. In this event, a ∼3 km thick echoing region
de-scends from 98 km to 87 km with an average descent rate of
∼0.3 m/s. While descending, the echoing region also under-goes sinusoidal height variation. We will see later that in-side the echo layer, there are some remarkable structures in terms of the variation of signal-to-noise ratio (SNR) with re-spect to time and height throughout the observational period of ∼7.5 h. The periods of the structures, however, vary as a function of height and time.
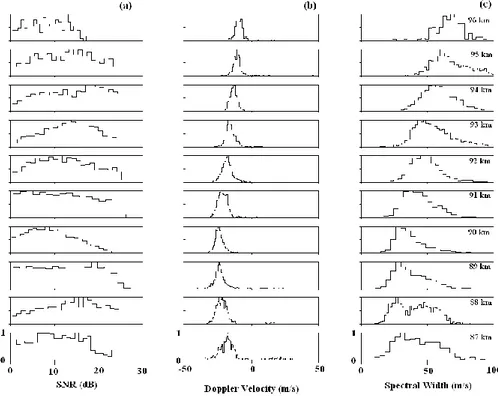
It is interesting to note in Fig. 1 that field aligned irreg-ularities appear from the altitudes as low as 87 km. How-ever, before we proceed for a detailed presentation of our result on the structures that we see inside the echo layer, we would like to summarize the spectral information of the en-tire dataset and their field alignment in order to compare them with what is commonly observed from neutral turbulence as-sociated mesospheric echoes. This is in view of not to have any confusion on these echoes as high altitude mesospheric echoes. The spectral parameters (SNR, mean Doppler veloc-ity and spectral width) are plotted in the form of histogram in Figs. 2a–c. SNR is found to be as high as 15 dB at 87 km and 30 dB at higher altitudes (0 dB detectability level is about – 5 dB in this case) leading to a dynamic range of the echoes as high as 35 dB. The Doppler velocities are towards the radar (negative) and are less than 30 m/s. Spectral widths (2σ , where σ is the square root of the velocity variance) are in the range 10–100 m/s with higher values corresponding to higher altitudes. Notably, spectral width is found to be as high as 70 m/s at 87 km. Although no simultaneous observa-tions with other beams were made on this day, experiments conducted at other times have clearly shown that such strong echoes are observed only from the direction that satisfies the perpendicularity with the magnetic field. While the field aligned property is valid for these echoes, we have not yet measured the exact aspect angle of these low altitude echoes. Coming back to our Fig. 1, wherein we mentioned to see some fine structures embedded inside the echo layer, we may notice that the power associated with the echo structures ap-pear to maximize in the middle of descending layer. In or-der to see the structures more clearly, we present two seg-ments of data in Figs. 3 and 4 corresponding to the echoes coming from the higher and lower altitudes, respectively. In Figs. 3a–c, we present height-time maps of the three param-eters, namely the SNR, mean velocity and spectral width corresponding to the observation seen between 93 km and 98 km, during 12:12 to 13:17 LT. In Figs. 4a–c, similarly, we show the height-time variations of same parameters but for height region 87 to 92 km observed during the time period between 18:54 LT and 19:48 LT. As mentioned before, SNR maps show that the power of echoes maximizes at the cen-ter of echo layer and decreases as we go above and below of the center maximum. Corresponding to the power maxima, it is interesting to note that while the Doppler velocity is also maximum at the center, the Doppler width is minimum and tends to maximize at the top and bottom of the layer. Ob-viously, therefore, the strongest SNR are associated with the
0 5 10 15 20 25 30 13 14 15 16 17 18 19 86 88 90 92 94 96 98 TIME (IST) HEIGHT (km) Gadanki, September 03, 1997
Fig. 1. Height-time-intensity (SNR) map of backscattered signals from E region observed on 3 September 1997. The blank spaces in the
HTI map represent data gaps.
1864 A. K. Patra et al.: Lower E-region irregularities at Gadanki 0 10 20 30 12:24 12:36 12:48 13:00 13.12 93 94 95 96 97 98 HEIGHT (km) Gadanki, September 03, 1997 −30 −20 −10 0 12:24 12:36 12:48 13:00 13:12 93 94 95 96 97 98 HEIGHT (km) 20 40 60 80 12:24 12:36 12:48 13:00 13:12 93 94 95 96 97 98 TIME (IST) HEIGHT (km)
Fig. 3. Height-time variations of (a) SNR, (b) velocity, and (c)
spectral width for the time period 12:12–13:17 LT.
larger Doppler velocity and small spectral width at the cen-ter of the layer while at the edges of layer, the SNR is low coupled with smaller velocity and larger spectral width. This observation is quite in contrast with what has been presented for the quasi-periodic striations associated with the echoes coming for height region above 100 km during night-time (Choudhary et al., 2005) wherein the power maxima at the center of echo layer always gets associated with a shear max-ima (minimum Doppler velocity) and an enhanced Doppler width. We will discuss this aspect further in Sect. 3.2.
Altitude variation of SNR with respect to time shown in Figs. 3a and 4a further shows some remarkable structures inside the echo layer. While separated striations are clearly visible in SNR map of Fig. 4a, similar structures can also be discerned in Fig. 3a where the quasi-periodic structures gets reflected only in temporal and spatial variation of the signal intensity. Interestingly, distinct striated structures are more visible in the Doppler velocity and width maps than in the SNR maps, which are quite in contrast with the general understanding about QP echoes, which always seem to get associated with the intensity variation. It is worth mentioning here that a similar feature has been noted in the rest of the data set. 0 10 20 30 19:00 19:12 19:24 19:36 19:48 87 88 89 90 91 92 HEIGHT (km) Gadanki, September 03, 1997 −30 −20 −10 0 19:00 19:12 19:24 19:36 19:48 87 88 89 90 91 92 HEIGHT (km) 0 20 40 60 19:00 19:12 19:24 19:36 19:48 87 88 89 90 91 92 TIME (IST) HEIGHT (km)
Fig. 4. Same as Fig. 3, but for period 18:54–19:48 LT.
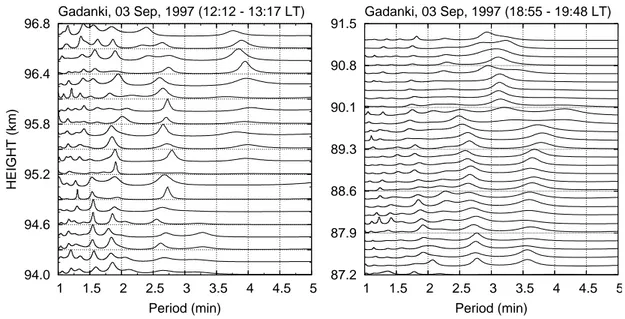
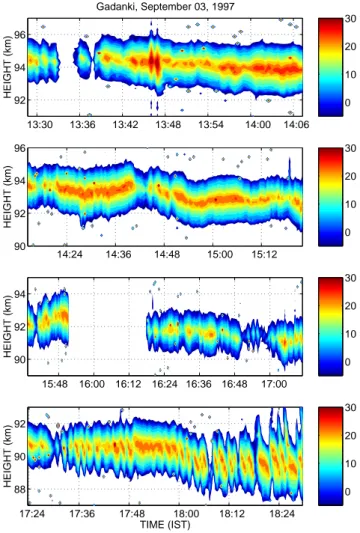
An eyeball estimation of the periodicity in the occur-rence of striations inside the descending echo layer shown in Figs. 3 and 4 would suggest it to be of the order of 2 min. However, to accurately estimate the dominant periodicity of the structures, a spectral analysis using maximum entropy method along the line suggested by Barrodale and Erickson (1980) has been employed on the time series of SNR shown in Figs. 3a and 4a. The results are shown in Figs. 5a and 5b. Although the appearance of the echo structures in the SNR maps is so different, the dominant periods are quite similar and lie in the range of 2–4 min. The lower periods, how-ever, are found to dominate in the first segment of the data shown in Fig. 3. Noteworthy is the periods, which are less than the Brunt Vaisala period (∼5 min at this height region). Structures with quite similar periodicity have been observed in the other segments of the data as well. To show that in-deed the observations have similar structures, we present the time-height variation in the intensity of the rest of the data in Figs. 6a–d. Important point to note in these figures is the existence of both the positive and negative slopes in the struc-tures, sometimes resembling to a saw-tooth shape.
To gain further insight into the observations, we exam-ined the velocity data assuming that the mean Doppler ve-locities are due to meridional neutral wind (Krishna Murthy
94.0 94.6 95.2 95.8 96.4 96.8 1 1.5 2 2.5 3 3.5 4 4.5 5 HEIGHT (km) Period (min) Gadanki, 03 Sep, 1997 (12:12 - 13:17 LT) 87.2 87.9 88.6 89.3 90.1 90.8 91.5 1 1.5 2 2.5 3 3.5 4 4.5 5 Period (min) Gadanki, 03 Sep, 1997 (18:55 - 19:48 LT)
Fig. 5. Spectral density of dominant periods obtained through MEM for the observational period (a) 12:12–13:17 LT, and (b) 18:54–19:48 LT
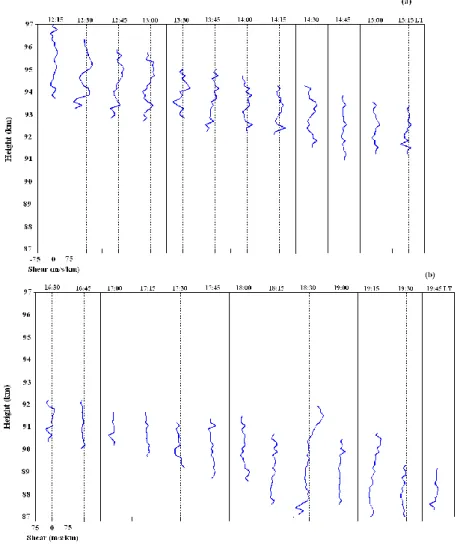
et al., 1998). Meridional winds are estimated and found to be as high as 135 m/s southward corresponding to line-of-sight Doppler velocity of –30 m/s. Similar magnitude winds have been observed using rocket experiments (Larsen and Odom, 1997; Larsen et al., 1998) and hence are quite realistic. We then calculate the wind shears, which are shown in Fig. 7. These represent wind shear averaged over 15 min to smooth out the noise-like fluctuations. The shear values are mostly within ±20 m/s/km and occasionally exceeding this limit.
3 Discussion
From the observations presented above, we can summarize the main results as: (1) the daytime field-aligned echoes display descending echoing region resembling the tidal ion layer, (2) they occur at altitudes as low as 87 km and have re-markably large SNR and spectral width, (3) SNR variations show structures with periods 2–4 min, and (4) strongest SNR are associated with the larger Doppler velocity and small spectral width at the center of the layer as against the smaller SNR which are associated with smaller velocity and larger spectral width close to the edges of the layer.
Echoing layers having thickness of 2–3 km and descent rate of ∼0.5 m/s have already been reported from Gadanki observations (Choudhary et al., 1996; Patra et al., 2004; Pan and Rao, 2004). However, such echoes during daytime have been observed at Gadanki only. Descending E region echoing structures have been observed also at Piura in Peru (Woodman et al., 1999), a low-latitude station quite similar to Gadanki. A statistical study on the occurrence of coherent echoes from E region at Piura, reported by Chau et al. (2002), however clearly show that echoes, although occur down to
∼90 km, they are seen mostly at night between 19:00 LT
and 07:00 LT. Such type of echoes has also been observed at Chung-Li (Pan and Tsunoda, 1998) and Arecibo (Urbina et al., 2000, 2004) as well, but again they have been seen only at night. In the light of above discussion, the irregu-larity structures observed during daytime at Gadanki assume special significance. Keeping in mind that all the features presented above are of vital importance to gain insight into the processes involved, we discuss them below in details. 3.1 Descending echoing layer and relevance of tidal ion
layer
One important aspect of the present observations is the de-scending layer characteristics associated with these echoes observed in our data and also observed at other low-/mid-latitudes. They are reminiscence of tidal ion layers (Math-ews, 1998) and suggest the possible role of tidal wind fields for manifesting the descending features. Another important and interesting aspect of the descending echoing region is the occurrence of echoes at altitudes as low as 87 km. Dy-namics of E region layers in the height region of 80–160 km has been extensively studied both experimentally and theo-retically over Arecibo (Mathews and Bekeny, 1979; Tong et al., 1988) and more recently using ionosonde at Milos (Haldoupis et al., 2006). Arecibo observations showed that the layer could come down to altitude as low as 85 km. It has been shown that below 100 km the layer dynamics is controlled by diurnal tide wherein the diurnal tide drags the layer down to altitude as low as 85 km (Mathews and Bekeny, 1979; Tong et al., 1988; Haldoupis et al., 2006). The fact that the echoing layer descended to altitude of 87 km with an average descent rate of 0.3 m/s suggests that the descending characteristics is very much consistent with the action of di-urnal tide. The average descent rate of 0.3 m/s correspond
1866 A. K. Patra et al.: Lower E-region irregularities at Gadanki 0 10 20 30 13:30 13:36 13:42 13:48 13:54 14:00 14:06 92 94 96 HEIGHT (km) Gadanki, September 03, 1997 0 10 20 30 14:24 14:36 14:48 15:00 15:12 90 92 94 96 HEIGHT (km) 0 10 20 30 15:48 16:00 16:12 16:24 16:36 16:48 17:00 90 92 94 HEIGHT (km) 0 10 20 30 17:24 17:36 17:48 18:00 18:12 18:24 88 90 92 TIME (IST) HEIGHT (km)
Fig. 6. Zoomed in version of height-time SNR maps for period (a)
13:28–14:07 LT, (b) 14:14–15:22 LT, (c) 16:37–17.12 LT, and (d) 17:23–18:31 LT.
to vertical tidal wavelength for the diurnal tide of about 26 km, which is very close indeed to the 25–30 km wave-length predicted by theory for the S(1,1) diurnal tide (Ha-gan and Forbes, 2002). Further, Urbina et al. (2000) have observed VHF radar echoes at altitudes as low as 90 km and have shown that they are associated with tidal ion layer observed simultaneously by the Arecibo incoherent scatter radar. Based on these facts, we infer that similar tidal ion layers must be responsible for the echo layer observed at Gadanki also.
3.2 Source of quasi-periodic structures
The structures have dominant periods of 2–4 min and have been observed throughout the observational period of ∼7.5 h. The fact that the growth of large-scale (kilometer scale) gra-dient drift waves (GDI) is not preferred in the height re-gion of our interest ( <97 km) (Pfaff, 1991; Wang and Bhat-tacharjee, 1994), the possibility of large-scale GDI as the causative mechanism for the observed features can be ruled
out. Then when we turn to view these observations in terms of QP echoes, we have essentially three mechanisms: grav-ity wave related Es layer modulation and associated po-larization process (Woodman et al., 1991; Tsunoda et al., 1994), wind shear driven Kelvin-Helmholtz (KH) instabil-ity (Larsen, 2000), and wind shear driven Es layer instabilinstabil-ity (Cosgrove and Tsunoda, 2002).
We will have to rule out the Cosgrove-Tsunoda (CT) mechanism out rightly at Gadanki because of its geometry. The Es layer in the CT theory has to be perpendicular to the magnetic field to start with. Since the magnetic field lines at Gadanki are almost horizontal the implication is that the distorted Es layer would start with a near vertical position. This is, in a way, very difficult to achieve from a simple hor-izontal starting point created by the usual zonal wind shear mechanism. Further, the echoing layer is located in the colli-sion dominated lower E region, where it would be difficult to realize polarization field required for the instability to grow.
Choudhary et al. (2005) have made a detailed study on the QP echoes of periodicities less than Brunt Vaisala period (∼5 min) observed at altitudes above 100 km by the Gadanki radar. Based on their observed periodic upward and down-ward velocity patterns as a proxy of KH flow pattern, they suggested the KH instability as the most plausible candidate responsible for their observations. Choudhary et al. (2005), however, based their discussion for KH billows on the fol-lowing three facts: (1) Power maximum at the center of bil-lows, (2) Enhanced Doppler width at the power maximum, and (3) the shear maximum at the power maximum. How-ever, if we compare these preambles with what we have in our observations, we see that these conditions are not satis-fied. We have (1) Power maximizing at center – as with the KH case, (2) the shear is minimum at the power maximum – opposite to the KH thesis, and (3) Doppler width maximizes at the top and bottom of layers where the shear is maximum - another point, which does not agree with KH hypothesis.
For the KH instability to set in, the Richardson number Ri
should be <0.25, where Ri=N2/ (dv/dz)2, N is the Brunt
Vaisala frequency and dv/dz is the vertical shear in the hor-izontal wind. Considering the Brunt Vaisala period to be 5 min for the height of our interest, the required wind shear for the growth of the instability comes out to be >40 m/s/km. But the shears in the meridional winds are found to be much less. The possibility, however, may lie with zonal wind shear but we have no evidence for that. Although in principle, zonal wind shear can form a layer as well as make it unsta-ble when it satisfies the condition of KHI, it may not do both simultaneously and for such a long time. When we analyzed our velocity data like that done by Choudhary et al. (2005), we found that the velocity perturbations are in the range 5– 10 m/s, which are much less than their values (20–50 m/s). These facts further indicate that the likelihood of KHI is also remote.
Coming to the gravity wave theory of Woodman et al. (1991), Choudhary et al. (2005) have argued that there is
Fig. 7. Meridional wind shears computed from 15 min averaged velocity data.
a genuine difficulty to account for the short periods since very large winds are required to reduce the intrinsic period to the level of observed periodicity. While this may be logi-cal to think for the gravity waves propagating in the magnetic meridian plane, we propose instead that zonally propagating short period acoustic gravity waves can be considered as a potential candidate for the observed features. In this case, the structures can be considered as enhanced density layers moving downward with the maximum shear zone associated with the upward propagating gravity waves. Urbina et al. (2004) have put forward quite similar mechanism to explain their observations. This, however, needs to be examined crit-ically.
3.3 Generation of meter scale irregularities
As far as the low-altitude echoes are concerned, signal strength and spectral width are remarkably high as compared to their mesospheric counterpart. Further, the field-aligned properties of these irregularities suggest that these
irregular-ities are not directly generated by neutral turbulence (Gure-vich et al., 1997). Neutral turbulence, however, can have im-print on plasma at larger scale to excite plasma instability (Tsunoda et al., 1999).
The plasma instability process, that we know, relevant for the lower part of the E region is the gradient drift instabil-ity. But this instability also has limitation when we consider the collision dominated lower altitudes. For the radar geom-etry employed here, the 3-m waves are basically secondary waves. For the vertically propagating 3-m waves in the lower part of the equatorial electrojet, Kudeki et al. (1987) showed that the smallest possible threshold velocity required is 80– 100 m/s when L values are 120–150 m. They have also ar-gued that such scale lengths can be justified when the den-sity gradients associated with intermediate-scale (50–100 m) waves are considered. Since the waves are observed with very small phase velocities, they suggested that the nonlinear mode coupling (Sudan and Keskinen, 1979) might be an ef-ficient mechanism for transferring the energy from the large scale to small scale. In this sense, the characteristics of 3-m
1868 A. K. Patra et al.: Lower E-region irregularities at Gadanki
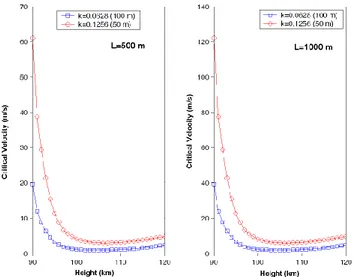
Fig. 8. Threshold velocity required for the growth of 50 m and
100 m gradient drift waves when L values are 500 m and 1000 m
irregularities at the lower E region reported here appears to be identical to the low altitude electrojet echoes (Kudeki et al., 1987).
For inclined magnetic field line geometry, it is important to consider the field line shorting effects while dealing with large-scale primary waves (Woodman et al., 1991). At the E region height over Gadanki, the dip angle is 13◦. Cor-responding to a layer of 1 km thickness (similar to that ob-served by Urbina et al. (2000), the length of the field line connecting the top and bottom of the layer is about 4.5 km. The electric potential mapping relation has been given as
λ⊥≤λk/ (σσo
p)
1/2 (Farley, 1960), where λ
⊥ and λk are the
perturbation wavelengths perpendicular and parallel to the magnetic field, respectively and σo and σp are the parallel
and perpendicular conductivity, respectively. For the height region of 90 and 100 km, (σo
σp)
1/2is 50 and 70, respectively.
Accordingly, for a 1 km thick electron density layer, the cor-responding longest waves that will grow are 90 m and 65 m. Since waves with larger wavelength will be damped, struc-tures with wavelengths more than these, in principle, are not expected through gradient drift instability. This has impor-tant implication, since shorter the wavelength, larger is the threshold velocity required for their growth.
To elucidate the problem, we calculated the threshold ve-locity required for the growth of 50 and 100 m using vertical L value of 500 and 1000 m. L represents the vertical elec-tron density gradient scale length. The results are shown in Fig. 8. It may be noted that the required drift velocity in-creases rapidly with decreasing height. At 90 km, for L of 500 m and 1000 m, the lowest value of drift velocity required for 50 m wave to grow are 60 m/s and 120 m/s, respectively. These values become 20 m/s and 40 m/s for 100 m wave. The above analysis suggests that the threshold values required are quite realistic. Once these intermediate scale waves grow, the
3-m scale waves responsible for the radar observations may grow subsequently through mode coupling as suggested by Kudeki et al. (1987).
While the intermediate scale waves are assumed to be in-strumental for the generation of meter-scale irregularities, the quasi-periodic structure and the descending echoing layer suggest the potential role of neutral dynamics. In this con-text, the rocket borne observations of the lower E region ir-regularities made by Prakash et al. (1969) appears to be rele-vant, which have shown superposition of two different spec-tra: one due to neutral turbulence and the other due to electric fields.
4 Concluding remarks
We have presented observations of field-aligned E region ir-regularities and structures in a daytime descending echoing region from 98–87 km. The descent rate agrees with the de-scending phase speed of diurnal tide. The structures having periods of the order of 2–4 min throughout the observational period is most remarkable result among other results viz., large SNR and spectral width at the bottommost height. Al-though the generation mechanism of these structures is not singled out, we propose that zonally propagating short pe-riod acoustic gravity waves may be potential candidate. Acknowledgements. The authors are grateful to the NARL
techni-cal staff whose dedicated efforts made possible the observations reported here. We acknowledge a very useful discussion with J. P. St-Maurice. The work of R. K. Choudhary has been supported by Canadian National Science and Engineering Research Council. Helpful suggestions from the referees of this paper are gratefully acknowledged.
Topical Editor M. Pinnock thanks two referees for their help in evaluating this paper.
References
Barrodale, I. and Erickson, R. E.: Alogrithm for least-square linear prediction and maximum entropy spectral analysis-Part I: The-ory, Geophysics, 45, 420–432, 1980.
Chau, J. L. and Woodman, R. F.: Low-latitude quasiperiodic echoes observed with Piura VHF radar in E-region, Geophys. Res. Lett., 26, 2167–2170, 1999.
Chau, J. L., Woodman, R. F., and Flores, L. A.: Statistical char-acteristics of low latitude ionospheric field aligned irregularities obtained with the Piura VHF radar, Ann. Geophys., 20, 1203– 1212, 2002.
Choudhary, R. K. and Mahajan, K. K.: Tropical E-region field aligned irregularities: Simultaneous observations of continuous and quasiperiodic echoes, J. Geophys. Res., 104, 2613–2619, 1999.
Choudhary, R. K., Mahajan, K. K., Singh, S., Kumar, K., and Anandan, V. K.: First VHF radar radar oservations of tropical latitude E-region field aligned irregularities, Geophys. Res. Lett., 23, 3683–3686, 1996.
Choudhary, R. K., St.-Maurice, J.-P., Kagan, L., and Mahajan, K. K.: Quasi-periodic backscatter from E region at Gadanki: ev-idence for Kelvin-Helmholtz billows in the lower thermosphere, J. Geophys. Res., 110, doi:10.1029/2004JA010987, 2005. Cosgrove, R. and Tsunoda, R. T.: A direction-dependent
instabil-ity of sporadic-E layers in the nighttime midlatitude ionosphere, Geophys. Res. Lett., 29(18), 1811, doi:10.1029/2002GL014669, 2002.
Farley, D. T.: A Theory of Electrostatic Fields in the Ionosphere at Nonpolar Geomagnetic Latitudes, J. Geophys. Res., 65, 869– 877, 1960.
Gurevich, A. V., Borisov, N. V., and Zybin, K. P.: Ionospheric tur-bulence induced in the lower part of the E region by turtur-bulence of the neutral atmosphere, J. Geophys. Res., 102, 379–388, 1997. Hagan, M. E. and Forbes, J. M.: Migrating and nonmigrating
diurnal tides in the middle and upper atmosphere excited by tropospheric latent heat release, J. Geophys. Res., 107, 4754, doi:10.1029/2001JD001236, 2002.
Haldoupis, C., Meek, C., Christakis, N., Pancheva, D., and Bour-dillon, A.: Ionogram Height-Time-Intensity observations of de-scending sporadic E layers, J. Atmos. Solar-Terr. Phys., 68, 539– 557, 2006.
Krishna Murthy, B. V., Ravindran, S., Viswanathan, K. S., Sub-barao, K. S. V., Patra, A. K., and Rao, P. B.: Small-scale (−3 m) E region irregularities at and off the magnetic equator, J. Geo-phys. Res., 103, 20 761–20 773, doi:10.1029/98JA00928, 1998. Kudeki, E., Fejer, B. G., Farley, D. T., and Hanuise, C.: The Condor
equatorial electrojet campaign – Radar results, J. Geophys. Res., 92, 13 561–13 577, 1987.
Larsen, M. F.: A shear instability seeding mechanism for quasiperi-odic radar echoes, J. Geophys. Res., 105, 24 931–24 940, 2000. Larsen, M. F. and Odom, O. D.: Observations of altitudinal and
lat-itudinal E region neutral wind gradients near sunset at the mag-netic equator, Geophys. Res. Lett., 24, 1711–1714, 1997. Larsen, M. F., Fukao, S., Yamamoto, M., Tsunoda, R. T., Igarashi,
K., and Yamamoto, M.: The SEEK chemical release experiment: Observed neutral wind profile in a region of sporadic E, Geophys. Res. Lett., 25, 1789–1792, 1998.
Mathews, J. D.: Sporadic E: Current views and recent progress, J. Atmos. Solar Terr. Phys., 58, 413–435, 1998.
Mathews, J. D. and Bekeny, F. S.: Upper atmospheric tides and ver-tical motion of ionospheric sporadic layers at Arecibo, J. Geo-phys. Res., 84, 2743–2750, 1979.
Pan, C. and Rao, P.: Morphological study of the field-aligned E-layer irregularities observed by the Gadanki VHF radar, Ann. Geophys., 22, 3799–3804, 2004.
Pan, C. J. and Rao, P. B.: Low altitude quasi-periodic radar echoes observed by the Gadanki VHF radar, Geophys. Res. Lett., 29, 3799–3804, 2002.
Pan, C. J. and Tsunoda, R. T.: Quasiperiodic echoes observed with the Chung-Li VHF radar during the SEEK campaign, Geophys. Res. Lett., 25, 1809–1812, 1998.
Patra, A. K., Sripathi, S., Sivakumar, V., , and Rao, P. B.: Evidence of kilometer-scale waves in the lower E region from high resolu-tion VHF radar observaresolu-tions over Gadanki, Geophys. Res. Lett., 29, doi:10.1029/2001GL013340, 2002.
Patra, A. K., Sripathi, S., Sivakumar, V., and Rao, P. B.: Statistical characteristics of VHF radar observations of low latitude E re-gion irregularities over Gadanki, J. Atmos. Solar-Terr. Phys., 66, 1615–1626, 2004.
Pfaff, R. F.: Rocket observations in the equatorial electrojet: Cur-rent status and critical problems, J. Atmosp. Terr. Phys., 53, 709– 7288, 1991.
Prakash, S., Gupta, S. P., and Subbaraya, B. H.: Irregularities in the equatorial E region over Thumba, Radio Sci., 4, 791–796, 1969. Rao, P. B., Jain, A. R., Kishore, P., Balamurlidhar, P., Damle, S. H., and Viswanathan, G.: Indian MST radar, 1. System description and sample wind measurements in ST mode, Radio Sci., 30, 1125–1138, 1995.
Rao, P. B., Yamamoto, M., Uchida, A., Hassenpflug, I., and Fukao, S.: MU radar observations of kilometer-scale waves in the mid-latitude lower E-region, Geophys. Res. Lett., 27, 3667–3670, doi:10.1029/2000GL003820, 2000.
Sripathi, S., Patra, A. K., Sivakumar, V., and Rao, P. B.: Shear instability as a source of the daytime quasi-periodic radar echoes observed by the Gadanki VHF radar, Geophys. Res. Lett., 30, 2149, doi:10.1029/2003GL017544, 2003.
Sudan, R. N. and Keskinen, M. J.: Theory of strongly turbulent two-dimensional convection of low-pressure plasma, Phys. Flu-ids, 22, 2305–2314, 1979.
Tong, Y., Mathews, D, J., Ying, and W-P: An upper E region quar-terdiurnal tide at Arecibo?, J. Geophys. Res., 93, 10 047–10 051, 1988.
Tsunoda, R. T., Fukao, S., and Yamamoto, M.: On the origin of quasiperiodic radar backscatter from midlatitude sporadic E, Ra-dio Sci., 29, 349–366, 1994.
Tsunoda, R. T., Buonocore, J. J., Saito, A., Kishimoto, T., Fukao, S., and Yamamoto, M.: First observations of quasiperiodic echoes from Stanford, California, Geophys. Res. Lett., 26, 995–998, 1999.
Urbina, J., Kudeki, E., Franke, S. J., Gonzalez, S., Zhou, Q., and Collins, S. C.: 50 MHz radar observations of mid-latitude E-region irregularities at Camp Santiago, Puerto Rico, Geophys. Res. Lett., 27, 2853–2856, doi:10.1029/2000GL000028, 2000. Urbina, J., Kudeki, E., Franke, S. J., and Zhou, Q.: Analysis of
a mid-latitude E-region LQP event observed during the Coqui 2 Campaign, Geophys. Res. Lett., 31, L14 805, doi:10.1029/ 2004GL020031, 2004.
Wang, X.-H. and Bhattacharjee, A.: Gradient drift eigenmodes in the equatorial electrojet, J. Geophys. Res., 99, 13 219–13 226, 1994.
Woodman, R. F., Yamamoto, M., and Fukao, S.: Gravity wave mod-ulation of gradient drift instabilities in midlatitude sporadic E ir-regularities, Geophys. Res. Lett., 18, 1197–1200, 1991. Woodman, R. F., Chau, J. L., Aquino, F., Rodriguez, R. R., and
Flo-res, L. A.: Low-latitude ionospheric field-aligned irregularities observed in the E-region with Piura VHF radar, Radio Sci., 34, 983–990, 1999.
Yamamoto, M., Fukao, S., Woodman, R., Ogawa, T., Tsuda, T., and Kato, S.: Midlatitude E-region field aligned irregularities ob-served with the MU radar, J. Geophys. Res., 96, 15 943–15 949, 1991.
