HAL Id: insu-03002933
https://hal-insu.archives-ouvertes.fr/insu-03002933
Submitted on 13 Nov 2020
HAL is a multi-disciplinary open access
archive for the deposit and dissemination of
sci-entific research documents, whether they are
pub-lished or not. The documents may come from
teaching and research institutions in France or
abroad, or from public or private research centers.
L’archive ouverte pluridisciplinaire HAL, est
destinée au dépôt et à la diffusion de documents
scientifiques de niveau recherche, publiés ou non,
émanant des établissements d’enseignement et de
recherche français ou étrangers, des laboratoires
publics ou privés.
Relationship between the Northern Hemisphere Joule
heating and geomagnetic activity in the southern polar
cap
P. Ballatore, L. J. Lanzerotti, G. Lu, D.J. Knipp
To cite this version:
P. Ballatore, L. J. Lanzerotti, G. Lu, D.J. Knipp.
Relationship between the Northern
Hemi-sphere Joule heating and geomagnetic activity in the southern polar cap. Journal of
Geophysi-cal Research Space Physics, American GeophysiGeophysi-cal Union/Wiley, 2000, 105 (A12), pp.27167-27177.
�10.1029/1999JA000390�. �insu-03002933�
JOURNAL OF GEOPHYSICAL RESEARCH, VOL. 105, NO. A12, PAGES 27,16%27,177, DECEMBER 1, 2000
Relationship between the Northern Hemisphere
Joule heating and geomagnetic activity
in the southern polar cap
P. BallatoreLaboratoire de Physique et Chimie de l'Environnement/CNRS, 45071 Orleans, France L. J. Lanzerotti
Bell Laboratories, Lucent Technologies, Murray Hill, NJ 07974, USA
G. Lu
NCAR, UCAR, Boulder, CO 80307, USA
D. J. Knipp
Department of Physics, U.S. Air Force Academy, Colorado Springs, CO 80840, USA
Abs[rac[. One of the most important effects from the coupling of the solar
wind to the magnetosphere-ionosphere
system is the Joule heating (JH) of the
atmosphere that is produced by the energy dissipation of ionospheric currents andgeomagnetic
field-aligned precipitating particles. At present, the most commonly
used technique to estimate the global JH rate is the Assimilative Mapping of
Ionospheric
Electrodynamics
(AMIE) procedure. Here we describe
a study of the
relationship of the Northern Hemisphere JH and the Southern Hemisphere polargeomagnetic
index AES-80 during a magnetic
storm on October 18-23, 1995 (when
both quantities are available). The purpose
is to study the effects
of the Northern-
Southern Hemispherical asymmetry on the correlation between JH and geomagnetic indices. Our results confirm a higher contribution to JH from regions associated with eastward currents. Moreover, we find that the best correspondence between the northern JH and the AES-80 occurs during negative interplanetary magneticfield (IMF) Bz and By conditions.
We discuss
how this result is in agreement
with
the magnetospheric-ionospheric model that considers, during negative IMF Bz and
By, an increase
of conductance
in the regions
associated
with eastward
currents
in the Northern Hemisphere. Our observations related to the best estimation of Southern Hemisphere JH are in agreement with the same model too. We also find a "saturation" effect for large values of northern JH: the JH-AES-80 correlation
breaks down for intervals with JH • 190 gigawatt (GW), during the highest
geomagnetic perturbations, and a negative IMF Bz that exceeds -20 nT. This "saturation" is in part attributed to the onset of hemispherical asymmetry due to the solar wind pressure with respect to the Earth-dipole orientation under severe storm conditions.1. Introduction
One of the more important effects that arises from the coupling of the solar wind with the magnetosphere- ionosphere system is the atmospheric Joule heating (JH) that is produced by the dissipation of ionospheric currents and geomagnetic field-aligned precipitating par-
Copyright 2000 by the American Geophysical Union.
Paper number 1999JA000390.
0148- 0227 / 00 / 1999J A000390 $ 09.00
ticles [e.g., Akasofu, 1981]. Presently, the technique most commonly used for estimating the global JH rate is the Assimilative Mapping of Ionospheric Electrodynam- ics (AMIE) procedure [Richmond and Kamide, 1988].
The calculation of the global JH rate is complex and requires the use of simultaneous ground-based multi-
instrument data and satellite observations. Because of
this complexity, the possibility of using one or more ge- omagnetic indexes as a proxy for the JH rate has been considered in the past. Examinations of the correla- tions of calculated JH rates with the cross-polar-cap 27,167
potential, the AE index, or the polar cap (PC) index suggested that each might be a reasonable proxy for the JH rate [Chun et al., 1999, and references therein].
Because of the significantly sparser data availabil- ity for the Southern Hemisphere than for the north, previous calculations of the JH rate have been car- ried out mainly for the Northern Hemisphere; compar- isons between the JH and other geomagnetic parame- ters have been made using only Northern Hemisphere geomagnetic indices. Although rather good magneto- spheric conjugacy is expected between the Northern and Southern Hemispheres, north-south asymmetries have also been observed, mostly related to different lo- cal seasonal ionospheric conductivities [e.g., Mizera et al., 1987; Newell and Meng, 1988; Maclennan et al., 19911 .
Recently, a new geomagnetic index, AES-80, has been calculated and studied for southern polar geomagnetic activity. This index was derived to take advantage of the increasing amount of data from high-latitude Auto- matic Geophysical Observatories (AGOs) in the Antarc- tic [Rosenberg and Doolittle, 1992]. In particular, in its present embodiment the determination of the AES-80 index uses multistation geomagnetic data from Antarc- tic stations spaced at about-80øcorrected geomagnetic (CGM) latitude [Ballatore et al., 1998a]. Similar to other AE-like indices [e.g., $aroso et al., 1992], AES- 80 indicates the global geomagnetic disturbances (and associated ionospheric currents) above the region con- sidered [Ballatore et al., 1998a, 1998b; Ballatore and Maclennan, 1999]. AES-80 covers a wider geomagnetic range near the southern polar cap than does the single station-determined polar cap index (e.g., described by
Troshichev et al., [1988]).
In this paper we compare the Northern Hemisphere integrated JH rate with the geomagnetic activity at high southern latitudes as represented by the AES-80 param- eter for a large magnetic storm in 1995, when both pa- rameters, the JH integrated in the northern hemisphere (JH(N)) and AES-80, were available. In the context of previous results that demonstrated good correspon- dence between the northern JH rate and geomagnetic activity in the northern polar cap (including the use of the northern polar cap index [Chun et al., 1999]), the present study was implemented as an investigation of
north-south asymmetry.
In the following we consider only the AES-80 index as the indicator of southern high-latitude geomagnetic activity because, during the large storm period under investigation, it is the only Southern Hemisphere index available. In fact, at present the PC index from Vostok is not available for the year 1995.
2. Experimental
Observations
and Data Analysis
Both the JH(N) rate and the AES-80 data were avail- able for the magnetic storm event of October 18-23,
1995. The JH(N) rate data were derived, at 5-min res- olution, using the AMIE procedure [Richmond et al., 1990]. Possible limitations of the AMIE estimation of JH(N) have been previously identified. These include effects of neutral winds [Cooper et al., 1995; Lu et al., 1995] and/or unaccounted-for small-scale variations in the electric field [Codrescu et al., 1995]. Moreover, if smaller grid scale sizes are used in the AMIE computa- tion, the obtained JH can be as much as a factor of 2 larger than the rate given by the standard computation [Liet al., 1998]. Therefore it is not excluded that, at times, the real physical JH rate could be larger than the
values used here.
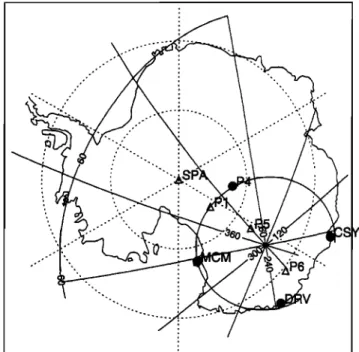
The AES-80 polar index is derived according to a standard procedure [Ballatore et al., 1998a] using ge- omagnetic data from the four Antarctic stations illus- trated in Figure 1. With respect to the AES-80 index
used in previous studies, the index used herein does not
include data from the station AGO P1, as they were not available for the period considered. However, P1 is relatively close to P4, and the four stations illustrated in Figure I are sufficiently regularly spaced in longi-
tude that this four-station AES-80 can be considered
a good approximation of AES-80 in the southern polar geomagnetic region. This index (and its components ALS-80 and AUS-80) have been derived at l-rain reso-
lution, and their median values over intervals of 5-min
have been calculated for comparison with the 5-min- resolution JH(N) data.
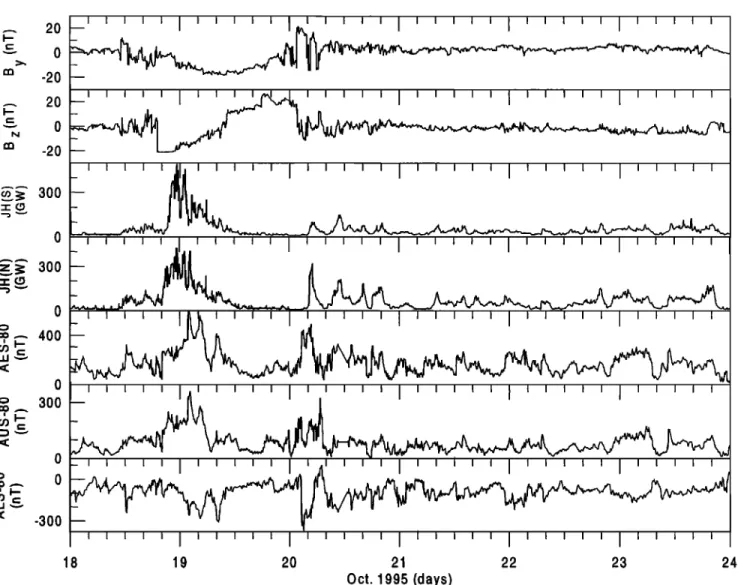
Increasing from the lowest panel, Figure 2 contains plots as a function of UT of the southern polar in- dexes ALS-80, AUS-80, and AES-80 and the JH(N) and JH(S) (this is the best estimation of the JH integrated in
'
ooo
Figure 1. Stations used for the computation of AES- 80.
BALLATORE ET AL.' NORTHERN-SOUTHERN HEMISPHERICAL ASYMMETRY 27,169 2O •' 300
300
o •--- 400 0 o 300 0 o 0 "=: -300 18 19 20 21 22 23 24 Oct. 1995 (days)Figure 2. From the top to the bottom the panels
show
IMF By, IMF Bz, JH(N) rate, JH(S)
rate, AES-80, ALS-80, and AUS-80 for the period from October 18 until October 23 1995.
the Southern Hemisphere) rates. The upper two panels plot the two interplanetary magnetic field (IMF) com- ponents Bz and By (retrieved from the WWW site of the Wind satellite database). The passage of an inter- planetary magnetic cloud (ICME) during the last por-
tion of October 18 and on October 19 is very evident in the variation of the IMF Bz component.
Visually, the intensity-time plots in Figure 2 show rather good correspondences between variations of AES- 80 and the JH(N) rate under conditions of large IMF
By and Bz (e.g., during day 19) and when IMF By
and Bz are smaller. There are also a few occasions of
high AES-80 during small JH(N). Such cases might be instances of underestimation of JH(N) or instances of hemispherical asymmetry of Joule heating.
In order to quantify the comparison between the JH(N) and the AES-80 we have calculated correlation coefficients using the data at 5-min resolution. The cor- relation coefficients are reported in the first column of Table 1. We find rather good correlations with the JH(N) for AES-80 and AUS-80. Similar correlations
were calculated after averaging the JH(N) and the po- lar indexes over longer time intervals. These correlation
coe•cients are also shown in Table 1. An increase in the values of the correlation coe•cients is found for the
longer averages. The confidence levels for the correla- tion coe•cients shown in Table 1 are all higher than 99.9% for AES-80 and AUS-80; the confidence level is only •95% for ALS-80 when time intervals of 3 hours or longer are considered.
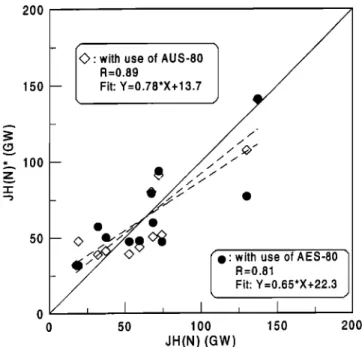
Considering the best fits given by the correlations of JH(N) with AES-80 and AUS-80 on a 12-hour timescale (coe•cients 0.81 and 0.89, respectively; Table l) we de- termined estimated proxy values for JH(N), JH(N)*, from the southern index (AES-80). In Figure 3 we show the scatterplots for the JH(N)* versus JH(N). The
data points have a rather small scatter around the line
JH(N)*=JH(N) (indicated by the solid line). Similar JH(N)* estimates were previously calculated by Chun et al. [1999] using geomagnetic indices calculated in the
Northern Hemisphere. The correlation coe•cients that
Table 1. Correlation Coefficients of AES-80, ALS- 80, and AUS-80 With JH(N) for Various Averaging Intervals a
Time Resolution
5-min 1-hour 3-hour 6-hour 12-hour
n=1693 n=144 n=48 n--24 n=12
AES-80 0.64 0.69 0.75 0.76 0.81 ALS-80 0.34 0.38 0.47 0.47 0.57 AUS-80 0.71 0.75 0.80 0.87 0.89
allere n indicates the number of data points used in each
correlation.
than similar ones obtained by Chun et al. [1999] for the
Northern Hemisphere.
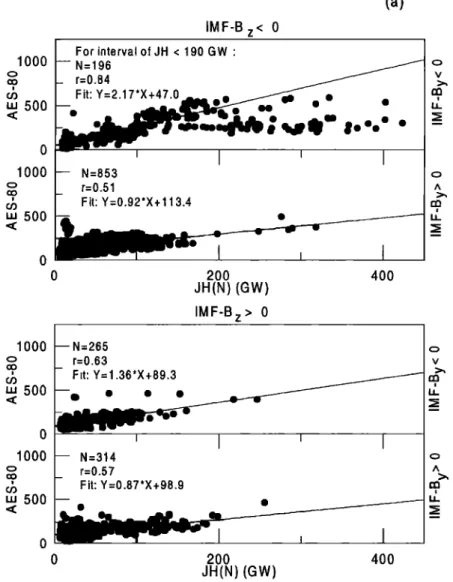
In order to study the JH(N)-AES-80 relationship un- der different disturbance conditions of the geomagnetic field, we redetermined the correlations reported in the
left-hand column of Table I for different orientations of
the interplanetary magnetic field (IMF). The results are shown in Figure 4a for AES-80 versus JH(N), in Figure 4b for ALS-80 versus JH(N), and in Figure 4c for AUS- 80 versus JH(N) for IMF Bz < 0 and IMF Bz > 0 and for the two cases of IMF By • 0 and IMF By • O. The 12 correlations are all significant at a confidence level above 99.9%. Smaller correlations are again ob- tained for the ALS-80-JH(N) investigation. The IMF direction that gives the best correlation is for Bz and By both negative. The correlation coefficients that are shown in these cases have been calculated using only data for JH(N) < 190 gigawatt (GW). Above about
this value, no clear correlation exists.
The same correlations as examined in Figure 4 were also calculated including a delay (5-rain to 1-hour) be- tween the interplanetary values and the ground-based data. No significant differences were found.
In order to examine further the apparent "saturation"
effect for JH > 190 GW that was obtained for the cor-
relations with the negative IMF By and Bz values, we have plotted in Figure 5 the histograms of the distri- butions of IMF By and Bz values (bottom and middle panels) and of the modulus BT of the vector sum of B• and By (top panel). We note that B•- has values > 15 nT only for JH(N) > 190 GW and that the distribution of Bz is clearly shifted to larger negative numbers for JH(N) > 190 GW than for JH < 190 GW. These char- acteristics are also evident when a delay (delays of 1/2 hour and I hour were considered) is introduced between the interplanetary and the ground-based data.
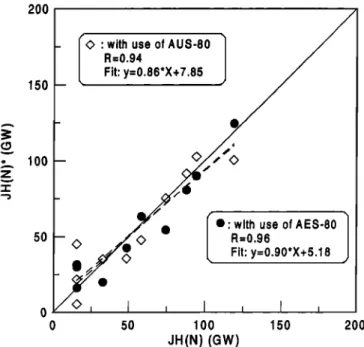
Next, the estimates of JH(N)* from AES-80 and AUS-80 were calculated using only data with negative IMF By and Bz and JH(N) < 190 GW. The results are illustrated in Figure 6 for data averaged over 12-hour intervals. Comparing Figure 3 with Figure 6, we see that the correlations are larger in the latter case, with
the slopes of the linear correlation lines all close to one.
3. Discussion
Previous studies using the AES-80 index demonstra- ted a significant correlation of this parameter with other planetary geomagnetic indexes, including Northern He- misphere indices [Ballatore et al., 1998a, 1998b; Balla- tore and Maclennan, 1999]. Therefore, since Northern Hemisphere geomagnetic indices are in agreement with JH rates calculated in the Northern Hemisphere [Chun et al., 1999], one might expect that the AES-80 can also provide information about the JH rates, especially
in the Southern Hemisphere.
The time-intensity relationships shown in Figure 2
resemble similar plots as a function of UT that were
reported for JH rates and AE (the northern Auroral Electrojet index) by Baumjohann and Kamide [1984]. In that paper, Baumjohann and Kamide [1984] exam- ined 3 days of data at 5-rain resolution, and a correla-
tion coefficient of 0.74 was found between AE and JH.
We have investigated the correlation at 5-min resolu-
tion between JH and the AE index calculated with the
use of 61 stations, AE(61), between 55øand 76øCGM latitude (in the Northern and Southern Hemispheres, however, the addition due to the Southern Hemisphere is not very significant owing to fewer stations being there) for our period October 18-23, 1995. This lat- itude range should cover the maximum electrojet in- tensity better than the standard AE index, which is determined from 12 longitudinally spaced stations be-
tween 0øand 70øCGM latitude. We find a correlation
200
150
lOO
:with
use
of
AUS-80
1
R=0.89 / Fit: Y=0.78*X+13.7
$
50 • 0 o 50O'
with
R=0.81use
of
AES-80
1
Fit: Y=0.65*X+22.3
100 150 200
JH(N) (GW)
Figure 3. Scatterplot of data points (averaged over 12-hour intervals) of JH(N)* estimated using AES-80 and AUS-80 parameters versus JH(N) determined by the AMIE procedure. The dashed lines correspond to the best fits for the two groups of data. The corre- lation coefficients R and the equations of the fits are indicated. The solid line corresponds to the ideal case JH(N)*=JH(N).
BALLATORE ET AL.- NORTHERN-SOUTHERN HEMISPHERICAL ASYMMETRY 27,171
ol 000
• 500
0 lOO0 ! LU 500IMF-B
z< 0
(a) For interval of JH < 190 GW ' -- N=196 _ r=0.84Fit:
Y=2.17*X+47.0•
ee•...__..---•-
ß ß
ß
N=853 r=0.51 Fit' Y=0.92*X+113.4 0 2OO 4OO JR(N) (GW) IMF-B z > 0 1000 o ! Lu 500 1000 ! Lu 500 --N=265 r-0.63
Fit'
Y=
1.36'X+89.3
I N=314 r--0.57 Fit: Y=0.87*X+98.9 I ' I 0 200 JH(N) (GW) I 400 c) vFigure 4. Scatterplots of (a) AES-S0, (b) ALS-S0, and (c) AUS-S0 versus JH(N), separately for positive and negative IMF Bz and IMF By. For each panel the number of data points used, the correlation coefficient, and the best fit line equation (which is drawn as a solid line) are given.
coefficient of 0.82. The correlation coefficients of JH
with AU(61) and AL(61) are found to be 0.71 and 0.74, respectively. The correlation value that is obtained for AU(61) is equal to the one obtained for AUS-80 at the same 5-min resolution (Table 1). This is a very com- pelling result, especially considering the fact that the compared parameters are for opposite hemispheres.
When we calculated JH(N)* from AES-80 (or AUS- 80) and compared it with the measured JH(N) (Figure 3), we found significant, but lower, correlations than
were found for estimates from the northern AE or PC
indices [Chun et al., 1999]. This result might be in part
related to the seasonal dependence of ionospheric con-
ductance, which can affect results obtained in opposite
hemispheres.
The JH(N) rates have higher correlation with AUS- 80 than with ALS-80, or even with AES-80 itself (Table 1). This could be related to a better correspondence
of AUS-80 with the Northern Hemisphere with respect
to ALS-80. In fact, the correlation coeificient between
ALS-80 and AL(61) is 0.40 for the October 18-23 inter- val, and it is 0.49 between AUS-80 and AU(61). This result is rather surprising, and it has to be considered specifically in the context of the large storm period stud- ied here. In fact, on much larger timescales it has been previously reported that the ALS-80 parameter has a higher correlation than does AUS-80 with any north- ern or planetary geomagnetic indices [Ballatore et al., 1998a; Ballatore and Maclennan, 1999].
Additional geomagnetic causes could affect the fact
that we find that AUS-80 correlates better with the
northern JH during the magnetic storm than does ei- ther ALS-80 or AES-80. In the previously cited paper by Baumjohann and Kamide [1984], they also reported the correlations of AU and AL with Joule heating. How- ever, for these two parameters (AU and AL), instead of using the global JH, Baumjohann and Kamide [1984] used the JH integrated over cells of only eastward cur-
rents and of only westward currents, respectively. Even
they obtained for AU (0.73) was still slightly higher than the value that they obtained for AL (0.67), which is consistent with our results.
We can therefore interpret our apparent contradic-
tory result by noting that the eastward currents are localized in a region of typically lower ionospheric con- ductivity in comparison to westward currents [Vickrey et al., 1982]. Therefore the higher electric field re- gions (corresponding to the eastward currents; AUS- 80 in our case) are contributing relatively more to the global Joule heating.
We calculated the correlations of JH with AU(61) and AL(61) using values of AU(61) and AL(61) between 0 and [500[ nT (the number of 5-min-resolution data points was 1649 and 1512 for AU(61) and AL(61), re- spectively). We found correlation coefficients of 0.70 and 0.58 for AU(61) and AL(61), respectively. These results confirm the expectation of a higher contribution
of eastward currents to JH in comparison to the west-
ward currents.
We find a much better agreement between AES-80 and the measured JH(N) for the cases of IMF Bz < 0 and By • 0 (Figure 4a). During southward IMF, nega- tive By conditions are known to produce enhancements
in the conductivity associated with eastward currents at
northern high latitudes and enhancements in the con-
ductivity associated with westward currents at southern
high latitudes. Positive IMF By conditions produce just the opposite enhancements [e.g., Friis-Christensen and
Wilhjelm, 1975; Be!ehaki and Rostoker, 1996]. There- fore a negative IMF By, with its correspondingly en- hanced conductivity in the eastward current region in the Northern Hemisphere, will. tend to reduce the higher contribution to JH(N) from seasonally dependent east-
ward current with respect to westward. The opposite
will be true for positive By, and a larger hemispherical difference will occur.
We found a "saturation" effect to occur in the correla-
tion of JH(N) with the southern high-latitude AES-80 when IMF Bz and By are both negative (Figure 4a):
lOOO c)
m, 500
IMF-B
z < 0
(b)
For interval ofJH < 190 GW' o
N=196 • r=0.66 ea Fit' Y=-1.09*X-25.3 ,,'
-5oo
'
I
'
I
lOOO c, N=853 m, 500 r=0.30 • Fit: Y=-O.39*X-73.8 0 -500I
© I
^•,, 0 200 400 JH(N) (GW)IMF-B
z> 0
1000 -- N=265 c• r=0.50 •, 500 Fit' Y=-O.73*X-32.78 < 0-500
•
I
1000
-- N=314
oo 500
r=0.40
c• Fit: Y =-0.54'X-49.27 0 -500 0 200 JH(N) (GW) 400 Figure 4. continuedBALLATORE ET AL.' NORTHERN-SOUTHERN HEMISPHERICAL ASYMMETRY 27,173 (c)
IMF-B z < 0
1000•500
0 1000 500 1000 500 lOOO ! ::3 500 -- For interval of JH < 190 GW: N=196- r=0.81 ,
_ Fit:
Y=1.09
X+22.5
••1'•
• I•e• leeee
ß
' I ' I • N=853 r=0.58 - Fit: ¾=0.54'X +•0.8 2OO JH(N) (GW) IM F-Bz > 0 __ 400 N=265 r=0.52 Fit: Y=0.63*X+57.5 N=314 r=0.39 Fit: Y=0.33*X +50.2 2OO JH(N) (GW) 400 Figure 4. continuedno correlation was found between the two quantities for JH(N) > 190 GW. We also found that larger values of JH(N) occurred under conditions of larger values of negative Bz and BT (Figure 5), where BT is equal to
R211/2
(B•
2 + _y, . In contrast,
an investigation
(not
shown
here) of the distributions of other interplanetary param- eters (such as the solar wind speed and proton density) showed no similar features for JH(N) larger than 190
GW.
Values of Bz and By that are close to zero nT corre-
spond
to the establishment
of an effect
of the interplan-
etary flow on the magnetospheric configuration which is relatively symmetric with respect to the north-south geomagnetic axis compared to the case of larger values of Bz and By [e.g., Belon et al., 1969, and references therein]. In order to investigate how much this effect might affect our results, we computed the same correla- tions as in Table i for values of By and Bz in intervals of (-2, 2) nT or (-1, 1) nT. We found no statistical in- crease in the correlations. Also, if we include a delay between IMF and JH(N) (related to the propagation time from the satellite to the magnetosphere), no in-
crease of correlation is found. Nevertheless, large values of BT (> 15 nT) produce different magnetic pressures on the Northern and Southern Hemispheres such that a decrease of hemispherical conjugacy might be expected during some seasons. The open northern and southern polar caps, which are more directly associated with the interplanetary medium than other latitudes, will likely be affected differently by this north-south inclination of the IMF and of the solar wind flow. Concerning this, we mention the previous findings of Belon et al.
[1969], who found that during disturbed periods (con- trary to the quietest periods) the similarity of details of north-south auroral features, irrespective of their conju- gacy, deteriorate rapidly with increasing latitude. This was attributed to the large stretching of magnetic field lines toward the magnetospheric tail and the presence of localized electric/magnetic fields in the magnetosphere [Belon et al., 1969]. In particular, in a geomagnetically disturbed period during March 1968 the displacement
of the auroral zone was attributed to the existence of an
asymmetric distortion of geomagnetic field lines due to solar wind pression and Earth-dipole orientation, and it
80 40 JH < 190 GW JH :,.190 GW 8O 5 10 15 20 25
IMF
B
T (nT)
40 8O -25 I I I -20 -15 -10 -5 0 IMF-B z (nT) 40-- 0 -25 -20 -15 -10 -5 0IM
F-By
(nT)
Figure 5. Histogram of the distribution of IMF B.
and
Bz values
and
of their
vectorial
sum
BT for JH(N
( 190 GW (solid line) and ( 190 GW (dashed line).
was found that this distortion is a very strong function of the geomagnetic activity at latitudes between 65øand 72ø[Belon et al., 1969, and references therein].
Furthermore, conditions of very negative Bz are asso- ciated with a high degree of merging of the IMF with the magnetosphere and therefore with the associated high increase of geomagnetic activity. Such conditions can
also affect the observed decrease in the correlation for
JH • 190 GW. Under conditions of high geomagnetic activity a shift of the auroral oval to lower latitudes is expected [Kamide et al., 1976]. Therefore the polar cap (and its related AES-80 index) will be located far- ther from the source of major JH in comparison to the quieter periods. This will also affect the correlations.
We did show that, if we calculate the proxy-estimated JH(N), JH(N)*, from the AES-80 index for small values of JH(N) (and therefore for small values of the IMF Bz
and By), a correlation
coefficient
well above 0.9 was
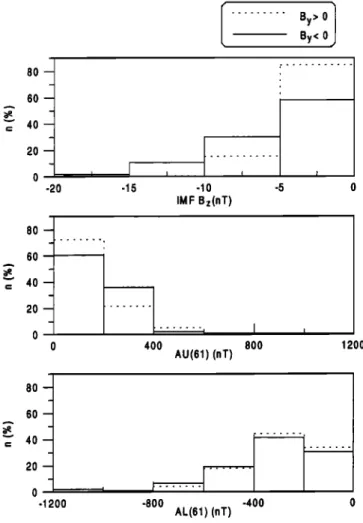
found between the estimated and the measured JH(N) (Figure 6).In Figure 7, histograms of occurrence of IMF Bz, AU(61), and AL(61) are shown separately for positive and negative IMF By conditions for the October 1995 geomagnetic storm interval. Only data occurring during intervals of JH ( 190 GW are plotted. The histograms in Figure 7 show a shift of IMF Bz toward higher nega- tive values during negative IMF By, which could affect, in part, our results. However, such a shift would also be
associated with an increase of both eastward and west-
ward currents for negative By. While the histograms of Figure 7 show a clear shift for AU(61) toward higher values, the AL(61) shift toward more negative values is very slight. This result is consistent with the ex- pected increase of ionospheric conductivity associated with eastward currents during negative IMF By for the Northern Hemisphere [Friis-Christensen and Wilhjelm, 1975; Belehaki and Rostoker, 1996].
In order to verify that the results that we obtained are significantly affected by the north-south conjugacy or asymmetry of the magnetospheric system, we have con- sidered the best estimate of the Southern-Hemisphere- integrated JH, JH(S), which is plotted in Figure 2 (third panel from the top) for the time interval considered. We have reported results of the correlations between AES-80, ALS-80, and AUS-80 with the 5-min JH(S) in
Table 2 for different orientations of the IMF. We stress
that this is not a quantitatively significant comparison between the southern polar cap geomagnetic activity and the JH(S), owing to lower reliability of JH(S). In fact, the data availability for the Southern Hemisphere
200
I•: with
R=0.94use
of
AUS-80
1
.._. Fit:
y=0.86*X+7.85
150 50 ^ /_ I R=0.96 I0
0 50 100 150 200 JH(N) (GW)Figure 6. Scatterplot of data points (averages over
12-hour
intervals)
of JH(N)* estimated
using AES-80
and AUS-80 parameters versus JH(N) using only datawith JH(N) • 190 GW and negative
IMF By and Bz.
The dashed lines correspond to the best fits for the two groups of data. The correlation coefficients R and the
equation of the fits are indicated. The solid line corre-
BALLATORE ET AL.' NORTHERN-SOUTHERN HEMISPHERICAL ASYMMETRY 27,175
I ...
By>
By< 00
1
80-- 0 -20 -15 -10 -5 0 IMF Bz(nT)80
--•
...
.
60 4O 2O 0 0 400 800 1200 AU(61) (nT) 80 60 40 2O o .12oo -800 -400 o AL(81) (nT)Figure 7. Histograms of IMF Bz, AU(61) and AL(61) shown separately for positive and negative IMF B u dur- ing intervals of JH < 190 GW.
is rather sparse since the total number of magnetomet-
ric stations used for the Southern Hemisphere in our
time interval is .-•14% of the total number in the North-
ern Hemisphere, and there is only one Southern Hemi- sphere radar, at Halley Base, in comparison with the seven radars in the Northern Hemisphere. However, the
JH(S) is presently
the best estimation
of JH(S) avail-
able, and the comparison in Table 2 could be in any case of some qualitative interest, with some warnings. In particular, the fact that the correlation coefficients
of the polar cap geomagnetic activity with the JH(S) (shown in Table 2) are smaller than with the JH(N) (shown in Figure 4) can be attributed to the small data coverage in the Southern Hemsiphere.
However, one result of interest shown in Table 2 is related to the fact that, in effect, JH(S) is more directly
related to AUS-80 than to ALS-80, and this effect is
more important during the southward IMF, when sub-
storm occurrence is associated with an increase of iono-
spheric conductance in the region of westward currents
[Vickrey
et al., 1982; Kamide et al., 1994]. This is in
agreement with our results.
We note that we cannot find any level of JH(S)
or IMF Bz above which the correlations in Table 2
break down similarly to the "saturation" found for JH(N). This might imply (with the warnings above about JH(S)) that this "saturation" is significantly af- fected by the hemispherical asymmeties [Belon et al., 1969].
Moreover, Table 2 shows the occurrence of the best correlation between AES-80 and JH(S) during positive IMF B, (coefficients 0.55 for positive By and 0.67 for negative By), which is in agreement with the expected polar shift of the auroral oval during northward IMF [Kamide et al., 1976].
Finally, we note that during southward IMF the cor-
relation coefficient shown in Table 2 between AUS-80 and JH(S) is higher during negative By than during positive. This is in agreement with the fact that a neg- ative IMF B, and By are associated with a higher con- tribution to JH(S) from eastward currents. Taking into account the model of interplanetary-magnetospheric in- teraction above, this means a smaller contribution to JH(N) of eastward current during negative IMF B, and
By [Belehaki
and Rostoker,
1996],
which
is in agreement
with our expectations.
4. Summary and Conclusions
We have compared the JH(N) with the AES-80 re- gional index for the southern polar cap. This compar- ison is significant in the context of previous findings about the possibility of using the PC index from Thule as a proxy of the JH(N), which implies an optimal cor-
Table 2. Correlation Coefficients of AES-80, ALS-80, and AUS-80 With JH(S) for Different Orientations of IMF By and Bz a
By >0-Bz >0 By <0-Bz >0 By >0-B• <0 By <0-B• <0
n=314 n=265 n=853 n=261
AES-80 0.55 0.67 0.49 0.51
ALS-80 0.38 0.51 0.26 0.23
AUS-80 0.40 0.52 0.55 0.65
respondence of polar cap geomagnetic activity with the
hemispherical JH production rate.
The period under study includes a very intense geo- magnetic storm during the days October 18-23, 1995. During this interval the correlation between JH(N) and the southern polar index AES-80 is statistically signifi- cant at a confidence level above 99.9%, regardless of the hemispherical dependence of the observations.
The correspondence of AUS-80 to JH(N) is better than the one of ALS-80 to JH(N). This result has been interpreted in terms of the higher electric field charac- terizing the regions of eastward currents with respect to
the regions
of westward
ones
[e.g., Vickrey
et al., 1982].
The correspondence between JH(N) and the geomag- netic activity in the southern polar cap is better during periods of negative IMF By and Bz. Taking into ac-count the above association of eastward currents and
JH, our result is in agreement with the magnetospheric model that considers an increase of conductivity in the regions of eastward currents associated with negative IMF By and Bz in the Northern Hemisphere [Belehaki
and Rostoker, 1996]. According to the same magneto- spheric model, for negative IMF Bz, the contribution to JH(S) from regions associated with eastward currents is expected to be higher during negative than during positive By. In order to verify this, we calculated the best AMIE estimation of JH(S), and we found that for negative IMF B•, the correlation between AUS-80 and JH(S) is higher during negative than during positive
By. Therefore
JH(S) results
are in agreement
with ex-
pectations too.
When the JH(N) is higher than 190 GW, the corre- spondence of southern polar cap geomagnetic activity and the JH(N) becomes null, in association with the occurrence of very high geomagnetic disturbances and
of an IMF B• component that exceeds -20 nT. This "saturation" effect is in part attributed to the shift of
the auroral oval electrojets toward lower latitudes, more distant from the nominal polar cap. Moreover, it is in agreement with the expectation of a hemispherical asymmetric distortion of geomagnetic field lines due to solar wind pressure with respect to the Earth-dipole orientation [Belon et al., 1969, and references therein].
We note that the agreement between JH estimated from AES-80, JH(N)*, and the JH(N) estimated by the AMIE procedure can be optimized (reaching correlation coefficient well above 0.9) by taking into account the previous considerations about geomagnetic activity and IMF orientation. This result might suggest the possible use of AES-80 as a Southern Hemisphere proxy for JH.
Acknowledgments. We thank C. G. Maclennan for
valuable comments. The research at McMurdo and the Au-
tomatic Geophysical Observatories is supported in part by
the Office of Polar Programs of the U.S. National Science
Foundation.
Janet G. Luhmann thanks Barbara Emery and another referee for their assistance in evaluating this paper.
References
Akasofu, S.-I., Energy coupling between the solar wind and the magnetosphere, Space Sci. Rev., 28, 121, 1981. Ballatore, P., and C.G. Maclennan, Significance of the high-
latitude geomagnetic index AES-80: Comparison with the
PC index, Earth Planets Space, 51, 425, 1999.
Ballatore, P., C.G. Maclennan, M.J. Engebretson, M. Can- didi, J. Bitterly, C.-I. Meng, and G. Burns, A new south- ern high-latitude index, Ann. Geophys., 16, 1589, 1998a. Ballatore, P., C.G. Maclennan, and M.J. Engebretson, A new geomagnetic index for Antarctic latitudes, in Con- ference Proceedings, vol.62, edited by M. Colacino et al., pp. 377-380, Soc. Ital. di Fis., Bologna, Italy, 1998b.
Baumjohann, W., and Y. Kamide, Hemispherical Joule
heating and AE index, J. Geophys. Res., 89, 383, 1984. Belehaki, A., and G. Rostoker, Relationship between the
dayside auroral electrojets and the DPY current, J. Geo- phys. Res., 101, 2397, 1996.
Belon, A.E., J.E. Maggs, T.N. Davis, K.B. Mather, N.W. Glas, and G.F. Hughes, Conjugacy of visual auroras dur- ing magnetically quiet periods, J. Geophys. Res., 7•, 1, 1969.
Chun, F.K., D.J. Knipp, M.G. McHarg, G. Lu, B.A. Emery,
S.Vennerstrm, and O.A. Troshichev, Polar cap index as a proxy for hemispheric Joule heating, Geophys. Res. Left., 26, 1101, 1999.
Codrescu, M.V., T.J. Fuller-Rowell, and J.C. Foster, On
the importance of E-field variability for Joule heating in the high latitude thermosphere, Geophys. Res. Left., 22,
2393, 1995.
Cooper, M.L., C.R. Clauer, B.A. Emery, A.D. Richmond, and J.D. Winningham, A storm time assimilative map- ping of ionospheric electrodynamics analysis for the severe geomagnetic storm of November 8-9, 1991, J. Geophys.
Res., 100, 19,329, 1995.
Friis-Christensen, E., and J. Wilhjelm, Polar cap currents for different directions of the IMF in the Y-Z plane, J. Geophys. Res., 80, 1248, 1975.
Kamide, Y., J.L. Burch, J.D. Winningham, and S.I. Aka- sofu, Dependence of the latitude of the cleft on the inter- planetary magnetic field and substorm activity, J. Geo-
phys. Res., 81, 698, 1976.
Kamide, Y., et al., Ground-based studies of ionospheric con- vection associated with substorm expansion, J. Geophys. Res., 99, 19,451, 1994.
Li, F., T.L. Killeen, A.G. Burns, W. Wang, Q. Wu, R. Roble, L.A. Frank, and J.B. Siywarth, Modeling of high-latitude
thermosphere Joule heating at high spatial/temporal res-
olution (abstract), Eos Trans. AGU, 79(17), Spring Meet.
Suppl., S32, 1998.
Lu, G., A.D. Richmond, B.A. Emery, and R.G. Roble, Ma- gnetosphere-ionosphere-thermosphere coupling: Effects of neutral winds on energy transfer and field-aligned current,
J. Geophys. Res., 100, 19643, 1995.
Maclennan, C.G., L.J. Lanzerotti, S.-I. Akasofu, S.-I. Za-
itzev, P.J. Wilkinson, A. Wolfe, and V. Popov, Compari-
son of "electrojet" indices from the northern and southern hemispheres, J. Geophys. Res., 96, 267, 1991.
Mizera, P.F., D.J. Gorney, and D.S. Evans, On the conju-
gacy of the aurora: High and low latitudes, Geophys. Res.
Left., 1•, 190, 1987.
Newell, P.T., and C.-I. Meng, Hemispherical asymmetry in cusp precipitation near solstices, J. Geophys. Res., 93, 2643, 1988.
Richmond, A.D., and Y. Kamide, Mapping electrodynamic features of the high-latitude ionosphere from localized ob-
servations: Technique, J. Geophys. Res., 93, 5741, 1988. Richmond,A.D., et al., Global measures of ionospheric elec-
BALLATORE ET AL.: NORTHERN-SOUTHERN HEMISPHERICAL ASYMMETRY 27,177
trodynamic activity inferred t¾om combined incoherent scatter radar and ground magnetometer observations, J. Geophys. Res., 95, 1061, 1990.
Rosenberg, T.J., and J.H. Doolittle, Studying the polar ionosphere and magnetosphere with automatic geophys-
ical observatories: The U.S. program in Antarctica, Ant- arct. J. U.S., 29 (5), 347, 1992.
Saroso, S., M. Sugiura, T. Iyemori, T. Araki, and T. Kamei, Derivation of polar cap AE indices, Proc. NIPR Syrup.
Upper Atmos. Phys., 5, 35-45, 1992.
Troshichev, O. A., V. G. Andrezen, S. Vennerstrm, and E.
Friis-Christensen, Magnetic activity in the polar cap - A
new index, Planet. Space Sci., 36, 1095, 1988.
Vickrey, J. F., R. R. Vondrak, and S. J. Matthews, Energy
deposition by precipitating particles and Joule dissipa-
tion in the auroral ionosphere,J. Geophys. Res., 87, 5184,
1982.
P. Ballatore, Laboratoire de Physique et Chimie de
l'Environnement/CNRS, Avenue de la Recherche Scien- tifique, 45071 Orleans, France. ([email protected])
D.J. Knipp, Department of Physics, U.S. Air Force Academy, Colorado Springs, CO 80840.
L.J. Lanzerotti, Bell Laboratories, Lucent Technologies,
Mountain Avenue, Murray Hill, NJ 07974. (ljl@bell-labs. G. Lu, NCAR, UCAR, Boulder, CO 80307. (ganglu@hao. ucar.edu)
(Received October 18, 1999; revised July 10, 2000; accepted July 10, 2000.)