HAL Id: hal-01437403
https://hal.archives-ouvertes.fr/hal-01437403
Submitted on 30 Apr 2021HAL is a multi-disciplinary open access
archive for the deposit and dissemination of sci-entific research documents, whether they are pub-lished or not. The documents may come from teaching and research institutions in France or abroad, or from public or private research centers.
L’archive ouverte pluridisciplinaire HAL, est destinée au dépôt et à la diffusion de documents scientifiques de niveau recherche, publiés ou non, émanant des établissements d’enseignement et de recherche français ou étrangers, des laboratoires publics ou privés.
Small-scale structures in the far-infrared background
U. Herbstmeier, P. Abraham, D. Lemke, R. j. Laureijs, U. Klaas, K. Mattila,
C. Leinert, C. Surace, M. Kunkel
To cite this version:
U. Herbstmeier, P. Abraham, D. Lemke, R. j. Laureijs, U. Klaas, et al.. Small-scale structures in the far-infrared background. Astronomy and Astrophysics Supplement Series, EDP Sciences, 1998, 332, pp.739-747. �hal-01437403�
SUPPLEMENT SERIES
Astron. Astrophys. Suppl. Ser. 133, 171–179 (1998)
The Marseille Schmidt survey
?
for active star-forming galaxies
??
I. Data on 92 emission line objects in two fields
C. Surace1,2and G. Comte2
1 Max Planck Institut f¨ur Astronomie, K¨onigstuhl 17, D-69117 Heidelberg, Germany
e-mail: [email protected]
2 Observatoire de Marseille et Institut Gassendi, 2 place Le Verrier, 13248 Marseille, France
Received February 11; accepted June 4, 1998
Abstract. We present data from a moderately deep spec-troscopic Schmidt survey (Blim = 17.5) of “active
galax-ies” selected by the presence of emission lines in their spectra and/or their UV excess. The redshift, magnitudes, color and diameter reduction methods have been discussed in a previous paper. Here we explain the emission line equivalent width determination method.
92 emission line objects have been found in two adja-cent fields (approximately 50 deg2) in the direction of the southern extension of the Virgo cluster. We give a cata-log containing positions, photographic R and B magni-tudes, U−R colors, effective diameters, redshifts, equiva-lent widths and intensity ratios of the [OIII]λλ4959, 5007, Hβand [OII]λ3727 emission lines. On these fields, we
eval-uate the completeness limit of the survey at a pseudo B magnitude value of 15.7.
A more elaborate astrophysical analysis will appear in a forthcoming paper.
Key words: surveys — galaxies: general — galaxies: starburst — methods: data analysis
1. Introduction
It is expected that, in a nearby future, extragalactic pho-tographic Schmidt surveys will be superseded by CCD-based observations that will go much deeper and are free from the well-known caveats of photographic emulsions.
Send offprint requests to: C. Surace
? The table is also available in electronic form at the CDS
via anonymous ftp to cdsarc.u-strasbg.fr (130.79.128.5) or via http://cdsweb.u-strasbg.fr/Abstract.html
?? Finding charts, including information on star
for-mation location is available in electronic form via http://www.edpsciences.com
However the giant CCD mosaic detectors that are needed to cover a field of several square degrees are either just beginning operations or still under development. Further, the technical problem due to the field curvature of Schmidt telescopes have prevented the complete coverage of their field with CCDs and lead to build special telescopes based on different optical designs dedicated to CCD wide-field imaging. Therefore, several groups in the recent years have pursued efforts on classical photographic surveys, still fairly well adapted to the statistical study of the galaxian population in the nearby Universe, especially in the field of active galaxy search. Aside from continuing surveys be-gun long ago and producing large numbers of objects in very homogeneous data bases, such as the Case survey (Pesch & Sanduleak 1983) or the Kiso survey (Takase & Miyauchi-Isobe 1984), other attempts have been directed to a more complete retrieval of the information content of the Schmidt plates, thanks to the capabilities of modern digitization machines and subsequent digital image pro-cessing systems. The UC Madrid survey (Zamorano et al. 1994; Gallego et al. 1995), the Montreal Blue Galaxy sur-vey (Coziol et al. 1993, 1994), and the Hamburg Schmidt survey (Hopp et al. 1995; Popescu et al. 1996) are exam-ples of these improvements that enable to go beyond the information content of previous catalogs.
Except for far-infrared selected samples, the search for active galaxies with conventional ground-based telescopes has always been inspired by two basic ideas: to search for emission line spectra or to search for an ultraviolet excess in the continuum of the objects. The two major facets of “activity” in a galaxy are the non-thermal Seyfert-like nu-clear phenomena and the enhanced stellar formation pro-ducing massive ionizing and rich hot main-sequence stars. They are known to produce uv-excess, or at least enhanced blue color, and emission lines. However, the emission lines could be of small equivalent widths in an active object, and therefore very difficult to detect. For instance if the
172 C. Surace and G. Comte: The Marseille Schmidt survey for active star-forming galaxies. I.
Fig. 1. Configuration of the observed Schmidt plates. The fields used in this study are identified by a central star
star formation burst is seen in an evolved state most of the ionizing fraction of the newborn population has al-ready disappeared. An ideal survey aimed at detecting the totality of the active galaxy population should therefore search for emission lines (including Hα, which in some ob-jects is the only line with substantial equivalent width in the visible), search for ultraviolet excess in the continuum, and be carefully cross-correlated with a deep far-infrared survey to add the dusty objects that escape detection in the visible because of considerable extinction of the active areas.
As a first step to build a sample of “Starburst Galaxies” as complete as possible without constraints ei-ther on the morphology or on the cause and/or age of the starburst phenomenon, we have conducted a Schmidt pho-tographic survey using the two modes of selection: ultra-violet excess and emission lines (as for the 2nd Byurakan: Markarian & Stepanian 1983 and Case surveys: Pesch & Sanduleak 1983; Salzer et al. 1995). This allows us to get galaxies experiencing a recent and strong starburst as well as those showing an old dying burst. One of the aim was to get the maximum astrophysical information output di-rectly from the Schmidt plates without any CCD follow-up. For that purpose we have developed specific proce-dures to process the digitized plates (Surace & Comte 1994, hereafter referred as Paper I).
The present paper focusses on the part of the data reduction not discussed in Paper I (determination of spectrophotometric parameters from the Schmidt photo-graphic low-resolution spectra), an estimate of the com-pleteness of the spectroscopic survey on 2 fields (46.5 square degrees) and contains a catalog of the 92 emission line objects found in these two fields.
2. Observations and digitization
The observational strategies, digitization technique and methods used to retrieve the redshifts, magnitudes, colors and diameters on an homogeneous system are discussed in Paper I. Let us briefly remind that we used the ESO 1 meter Schmidt telescope with and without objective prism (O.P.), taking 3 plates for each field: two O.P. plates on Kodak IIIaJ emulsion, and one bicolor direct plate (U and R exposures separated by 30 arcsec on the same Kodak IIIaF plate). This allows a limiting magnitude on point sources of B = 17.5 on O.P. plates and R = 19.5 for bi-color plates. The selection of candidate active galaxies is based on the visual evaluation of the ultraviolet excess of the object on the bicolor plate and/or the presence of at least one emission line in its O.P. spectrum. The IIIaJ emulsion allows to study the spectra of the objects in the range 3600 ˚A – 5330 ˚A. Thus, the spectral features used to select the active objects are [OIII]λλ4959, 5007, Hβ and [OII]λ3728 emission lines up to a limiting reshift
z = 0.065. Meanwhile some objetcs can be detected at further redshift using only the [OII] line. After eye se-lection of candidate targets using binocular microscope, parts of the plates (100× 100 or 200× 200) centered on the objects are digitized by the MAMA (Machine A Mesurer pour l’Astronomie) machine of the Observatoire de Paris. (For a description of the MAMA machine see Guibert et al. 1984; Berger et al. 1991; Guibert & Moreau 1991; Soubiran 1992) O.P. plates were doubled in order to avoid false detections and coadded to improve the signal to noise ratio (cf. Paper I).
11 fields covering a total sky area of some 200 square degrees have been observed in the years 1989-1991 (Fig. 1). This paper deals with the emission line extragalactic ob-jects (hereafter ELGs) found in two adjacent fields in the direction of the South extension of the Virgo Cluster:
α = 13h12mn00s, δ = − 20◦3000000, and
α = 13h12mn53s, δ = − 25◦1000500(equinox 1950).
3. Data reduction
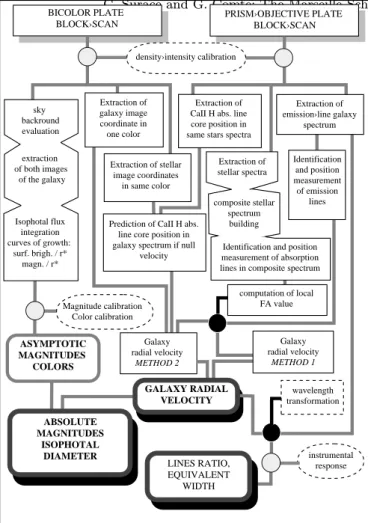
In order to avoid, at least for statistical studies, the diffi-cult long-term task of follow-up observations we have built a reduction system based on automatic procedures using MIDAS imaging package developped at ESO (Fig. 2).
We suggest the reader to refer to Paper I for a com-plete description of the calibrations, redshift determina-tion technique and photometric measurements. We remind that we succeeded in deriving redshifts with an average ac-curacy of 160 km s−1, U and R asymptotic magnitudes in Johnson-Cousins system and U−R colors in the Basel sys-tem with a mean uncertainty of 0.3 mag. In what follows, we describe the additional data reduction processes used to derive equivalent widths and relative line intensities from the digitized O.P. plates.
Flow›chart of the data processing density›intensity calibration Magnitude calibration Color calibration BLOCK›SCAN BLOCK›SCAN sky backround evaluation extraction of both images of the galaxy Isophotal flux integration curves of growth: surf. brigh. / r* magn. / r* Extraction of galaxy image coordinate in one color Galaxy radial velocity METHOD 2 Extraction of emission›line galaxy spectrum Identification and position measurement of emission lines computation of local FA value Galaxy radial velocity METHOD 1 Extraction of stellar spectra composite stellar spectrum building
Identification and position measurement of absorption lines in composite spectrum Prediction of CaII H abs.
line core position in galaxy spectrum if null
velocity Extraction of stellar
image coordinates in same color
Extraction of CaII H abs. line core position in same stars spectra
ASYMPTOTIC MAGNITUDES COLORS LINES RATIO, EQUIVALENT WIDTH ABSOLUTE MAGNITUDES ISOPHOTAL DIAMETER instrumental response GALAXY RADIAL VELOCITY wavelength transformation
Fig. 2. Flow chart of the data processing. Large black filled circles show internal calibrations while large grey filled circles show calibrations using external objects (spot sensitometer, standard stars, catalogued galaxies)
To perform spectrophotometry on the O.P. spectra of the ELGs, two preliminary steps are needed: the wave-length calibration and derivation of the instrumental re-sponse. Figure 2 displays the complete flow chart of the data processing.
3.1. Wavelength transformation
Wavelength calibration of slitless spectra present special difficulties: the absence of calibration lamp spectra or night sky emission line features forbids the use of stan-dard methods designed for slit spectroscopy. The crucial point is to determine some reference wavelength as a refer-ence position, in the galaxy spectrum itself. As in Paper I the CaII H 3968 ˚A absorption line core, was found to be the best reference because of its almost constant presence and good signal-to-noise in the field stars spectra, these field stars being supposed to have an average null radial velocity.
We use the Eq. (2) of Paper I for the CaII H line core. This equation gives the position that the CaII H absorp-tion line core would occupy at null recession velocity in the spectrum of the galaxy using the position of the CaII H absorption line of field stars whose spectra are located in its immediate vicinity.
The equation leads to:
Xo(λ) = XG + ∆Ca (1)
where:
Xois the position that the CaII H absorption line core
would occupy in the galaxy spectrum at null recession velocity,
XG is the position of the centroid of the galaxy R
image on the bicolor plate,
∆Ca is the average separation along the dispersion
di-rection between the field star R positions on the bicolor plate and the CaII H line core position in their respective spectrum. The origin of the coordinates is arbitrary.
From this reference wavelength and solving the equation:
|nλ2 − nλ1| = ∆X
f· A (2)
where:
∆X is the separation of two spectral lines along the direction of the prism dispersion, f · A, calibrated as de-scribed in Paper I, is the product of the focal length of the telescope by the O.P. angle (we remind that we need only to know the local value of this product), nλi is the prism refractive index for the wavelength λi, one can derive the
wavelength of any spectral feature from the spatial sep-aration of this feature from the reference position of the CaII H line. Indeed the value of nλi depends only on λi. It can be calulated with an accuracy of 10−5, using a poly-nomial approximation given in Schott technical notices for the UBK7 material of the prism.
We used Eqs. (1) and (2) to rescale the spectra along a wavelength scale using a non linear rebinning algorithm.
Tests experienced with the field stars show that the mean error is less than the intrinsic uncertainty in mea-suring the emission or absorption line (basically ≤ 0.4 ˚A when measuring Hγ).
To check the internal consistency of the wavelength transformation we derived the redshifts of the objects from the rebinned spectra, and compared them to the values obtained from the methods detailed in Paper I (Fig. 3).
We found the wavelength transformation 95% confi-dent considering all spectra (100% is obtained when the difference between each couple of measured recession ve-locities, for all the objects, are smaller than 1.5 times the intrinsic uncertainty on the adopted velocity value). This confidence level reaches 100% when only taking into ac-count the spectra with a signal to noise ratio larger than 7. (the S/N ratio being defined as the ratio between the peak intensity of the [OIII]λ5007 ˚A line and two times the σ value of the noise measured on the continuum between 4400 ˚A and 4800 ˚A).
174 C. Surace and G. Comte: The Marseille Schmidt survey for active star-forming galaxies. I.
Fig. 3. Comparison of the apparent recession velocities derived from wavelength rebinned spectra (Vr) with the apparent
re-cession velocities adopted from Paper I (Vnr)
3.2. Instrumental response
We used the A type field stars, which are easily recognized thanks to the presence of the Balmer absorption lines, to correct the rebinned spectra from the telescope-emulsion instrumental response, as follows. A serie of A-type stars with good signal-to-noise spectra is identified on the O.P. plate and their spectra are digitized in the same conditions as the galaxy spectra, calibrated and rebinned in wave-length, and corrected from the airmass using standard La Silla values of the extinction. However, we do not have at our disposal a series of spectra of spectrophotometric stan-dard stars taken with the same instrument. Therefore, we decided to build an “average” spectrum for each subtype A2V , A3V , A5V and A7V , by means of adding individual spectra of several stars of each type. This average spec-trum was further normalized at a continuum intensity of 1 at 5200 ˚A. The instrumental response is obtained by com-paring the averaged stellar spectra with those, of same stellar type, observed by Jacobi et al. (1984) and normal-ized in the same way. The 4 curves obtained by this way are very similar (σ = 0.05) and are used to derive a mean instrumental response shown in Fig. 4.
The rebinned galaxy spectra are hence divided by the instrumental response to produce the final corrected spec-tra (Fig. 5).
One can notice the very abrupt drop of the IIIaJ emul-sion sensitivity at wavelengths larger than 5200 ˚A. This well-known characteristic of the IIIaJ emulsion allows to avoid the bright 5577 ˚A nightsky emission line when mak-ing deep photographic imagmak-ing but makes spectrophotom-etry in this spectral region very unsafe, and produces a
Fig. 4. Telescope-emulsion instrumental response, normalized to 1 at 5200 ˚A
Fig. 5. Up: one dimension galaxy spectrum (13228-1955a) as extracted from the digitized O.P. plate; down: same spectrum, rebinned, and corrected from the instrumental response. The bottom spectrum shows from left to right, [OII] line and Hβ -[OIII] triplet. Hγ, Hδ and [NeIII] are also detected
very large numeric noise on the corrected spectra. A num-ber of ELGs in our sample have a redshift value that pushes the [OIII]λ5007 line in this spectral region. An ad-ditional correction has been devised for these galaxies and is described below.
3.3. Measurement of the emission line fluxes and equivalent widths
After rebinning and correction of the spectra from the instrumental response, the ranges where emission lines are present have been selected. Locally, these spectral
Fig. 6. Dependance [OIII] λ5007/λ4959 ratio on the velocities. The line relies the mean [OIII] ratio value every 1000 km s−1
fractions have been fitted with the addition of a third order polynomial representing the continuum with one or several Gaussians representing the emission lines. The fit used the standard least-squares optimization methods of the MIDAS processing package (associated with NAG mathematical subroutine library). This method used by Cananzi (1993) for the Hβ and Hγ absorption lines, allows a reliable determination of fluxes and equivalent widths, especially for low signal to noise ratio spectra. The line in-tensity ratios relative to Hβ and equivalent widths of Hβ, [OIII]λλ5007, 4959 and [OII]λ3728 emision features were subsequently determined from the Gaussian fits.
From the sample of 92 objects, velocities of which were computed, we measured the R magnitude, U−R color for 66 of them and derived at least one emission line relative flux for 79 of them.
3.4. Intensity correction of the [OIII] lines at high velocities
For velocities larger than 12000 km s−1, the [OIII] dou-blet enters in the range of sensitivity drop of the IIIaJ emulsion. In this region, the [OIII]λ5007/[OIII]λ4959 ra-tio tends to decrease with velocity, even after instrumental response correction.
The average value of the [OIII] ratio, equal to 2.3 is low with respect to the expected value of 3 given by the theory and is mainly due to the weight of objects with velocities larger than 10000 km s−1 (Fig. 6).
In order to use the [OIII] line intensity (and especially the [OIII]/Hβ intensity ratio) for further studies, we have corrected these values using a method of two dimensional mapping. The evolution of the [OIII]λ5007/[OIII]λ4959 ratio versus redshift and signal to noise has been mapped from the subsample of 64 galaxies having an [OIII] line
measurement. The resulting two-dimension surface has been smoothed and extrapolated across the range:
0.≤ velocity ≤ 25000 km s−1 − 0. ≤ S/N ≤ 20. using the following conditions:
[OIII]λ5007 [OIII]λ4959 = 3. for S N = 20. and vel = 0 km s−1 and [OIII]λ5007 [OIII]λ4959 = 0. for S N = 0. and vel = 25000 km s−1.
The limiting value equal to 3. is given by the probabilities of transition for the oxygen ion (Osterbrock 1989). The values of the [OIII] lines intensity have subsequently been corrected using this map. The [OIII] doublet intensity ra-tio corrected in this way has an average value of 3.1 with a standard deviation (σ = 0.71) identical to that obtained with uncorrected values for objects with velocities smaller than 10000 km s−1.
4. Completeness of the survey
As initially pointed out by Salzer (1989), the completeness of a spectroscopic survey cannot be only derived using the continuum flux of the objects, because an emission line se-lected sample is not an apparent magnitude limited sam-ple. Indeed because a galaxy is detected by the presence of emission lines in its spectrum, the contrast between the continuum and at least one emission line must be strong enough. That means that a galaxy, the continuum of which is almost invisible against the background intensity, can be selected by the presence of emission line features. On the other hand, the case of an overluminous continuum with weak emission lines could affect the detection of an object only if the level of the continuum is close to the satura-tion level. This case does not occur in the present study since, thanks to the relatively high dispersion provided by the 4 degrees objective prism of the ESO Schmidt, we are always far from the saturation limit. The eye selection of the emission features remains quite comfortable, even in the spectra of high brightness objects.
Therefore, as shown by Salzer (1989); Salzer et al. (1995); Gallego et al. (1996), one must take into account the value of both continuum and flux of the brightest emis-sion line to derive the completeness of the sample.
We computed an arbitrary magnitude mexptaking into
account the continuum flux between 3900 ˚A and 4980 ˚A and the flux emitted in the brightest emission line (usually [OIII]λ5007). This wavelength range used for the contin-uum flux integration corresponds to a pseudo Johnson B filter. For moderately excited objects at low redshift, the Hβ line is the only significant emission line that could af-fect the “continuum integration” and its contribution re-mains moderate. For a few high ionization objects of low redshift, the mexp value will be subject to a significant
176 C. Surace and G. Comte: The Marseille Schmidt survey for active star-forming galaxies. I.
mexp + 24.8
Fig. 7. Plot of the cumulative number of galaxies with apparent magnitude less than mexp versus mexp. The line is the result
expected for an uniformly distributed sample
and 4980 ˚A range. Note however that a classical B filter photometry would be subject to the same kind of error.
We do not include in this part of the study the large angular diameter galaxies whose HII regions appear as emission line objects. Using slitless spectroscopy implies an overlapping of several regions from a same object. The wavelength transformation is impossible to compute and hence the continuum flux of these objects cannot be mea-sured. Because these galaxies are bright this will only affect the brightest part of the magnitude distribution, where statistical noise is very large.
The zero point of the mexp magnitude scale has been
computed from a comparison with Johnson B apparent magnitudes from the literature for 18 galaxies. We derive the following relation:
(mB)lit = mexp + 24.8 (±0.3).
As a first attempt to determine the completeness of the survey we plotted the logarithm of the cumulative num-ber of galaxies with apparent magnitudes smaller than mexp against mexpand fitted a line of slope 0.6 (assuming
that the objects are uniformly distributed in an Euclidean Universe: Mihalas & Binney 1981). The completeness limit is given at the value when the line does not fit anymore the cumulative curve (Fig. 7).
This method uses the same hypothesis as the well-known V /Vvmaxmethod (Schmidt 1968) but minimizes the
effect of local inhomogeneities (Salzer et al. 1995). From Fig. 7, the present subsample may be considered as com-plete for mexp = 15.7 with 55 objects and a projected
density of 1.2 galaxies per square degree. Meanwhile this large value is obtained over a 46.5 square degrees area covering the south extension of the Virgo Supercluster. This large structure should have a density contrast not larger than 3 over the average density observed in the nearby Universe. Therefore, one cannot generalize this
result (that can be due to spatial inhomogeneity of the galaxy distribution) to the entire survey.
5. The catalog of the emission line objects
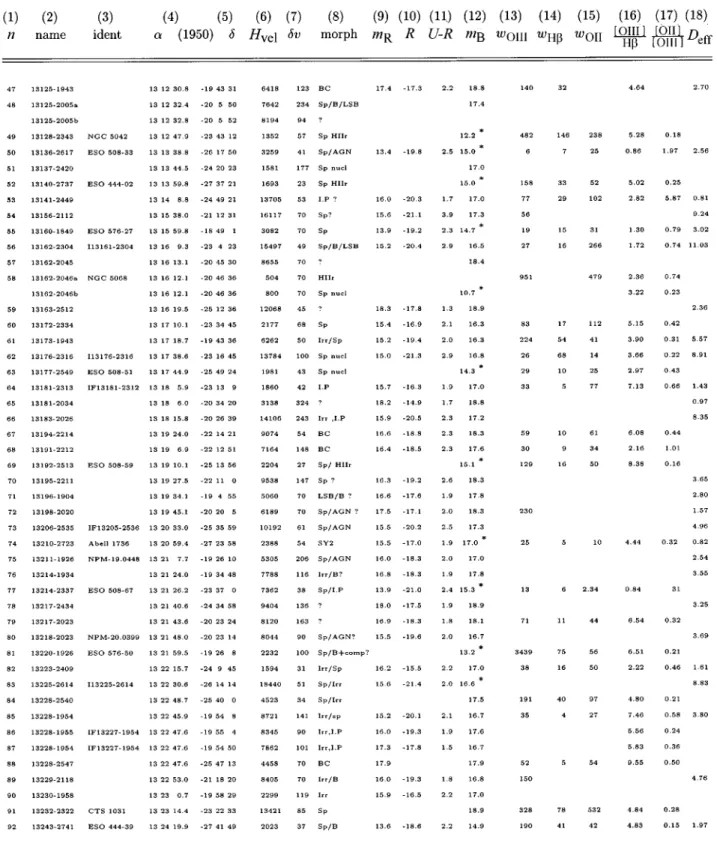
Table 1. Lists the observed objects and presents the fol-lowing entries:
(1) : number
(2) : identification in standard IAU notation (3) : previous identification
CTS: Calan-Tololo Survey III (Maza et al. 1991)
NPM: NPM1G. Lick Northern Proper Motion Program (Klemola et al. 1987)
ESO: ESO/Uppsala Survey of the ESO(B) Atlas (Lauberts 1982)
I: IRAS catalog, 1988, Point Sources Catalog IF: IRAS catalog, 1990, Faint Sources Catalog HB: Hewitt & Burbige (1991)
(4) : Right ascension (1950.0) (h, mn, s) (5) : Declination (1950.0) (◦,0, 00)
(6) : Apparent heliocentric velocity (km s−1) (measured and averaged as described in Paper I)
(7) : Uncertainty (km s−1) (8) : Morphology
based on the direct bicolor images and the as-pect of the sas-pectrum
Irr: Irregular galaxy; cl.: “clumpy” irregular HIIr: HII regions in an apparently normal spiral
Sp: Spirals (including galaxies with starburst nuclei)
AGN: Active Galactic Nucleus: Seyfert 1 (Sy1) and Seyfert 2 (Sy2))
LSB: Low Surface Brightness IP: Interactive pairs
?: unclassified B: barred object
BC: blue compact galaxy
(9) : R (Cousins) apparent magnitude
based on the images extracted from the direct plates and calibrated as described in Paper I (10) : R absolute magnitude
assuming H0= 75 km s−1 Mpc−1
(11) : U−R color
derived from the direct bicolor plates, in Basel system (see Paper I)
(12) : Asymptotic Blue apparent magnitude derived from Blue ESO-SRC Sky Survey plate existing at the Observatoire de Paris. The J plates have been digitized with the MAMA machine using similar procedures as those de-scribed in Paper I for our bicolor plates and surface photometry has been performed on the
images. The calibration of the magnitude scale into B magnitudes has been done using pub-lished NED or LEDA B magnitudes. The mean error value is similar to that estimated for the R magnitude value (0.3 mag) the∗ in-dicates the galaxies used for the calibration (13) : [OIII]λλ5007, 4959 equivalent width (in ˚A) (14) : Hβ equivalent width (in ˚A)
(15) : [OII]λ3728 equivalent width (in ˚A) (16) : [OIII]λ5007/Hβ observed intensity ratio (17) : [OII]λ3728/[OIII]λ5007 observed intensity
ratio
(18) : Effective diameter (in kpc)
assuming H0= 75 km s−1Mpc−1and equal to
twice the effective radius for R images (defined in Paper I).
The plates displayed show the selected galaxies. The tar-get is at the center of the charts surrounded by a circle. if several emission line regions of the same object have been detected, these regions are marked by a diamond. The size of the diamonds is comparable to the size of the emission line region.
If several emission line objects have been detected in the same area, but are not analysed due to the low signal to noise ratio, these objects are marked by a square.
Further papers on this survey will deal with the pop-ulation of the color–selected galaxies that do not show emission line on the OP plates and on various astrophysi-cal conclusions regarding the total galaxian content of the survey. Characteristics of the objects derived from line ra-tios and colors will be discussed in a forthcoming paper.
Acknowledgements. C.S. would like to thank Y. Terzian for welcoming at Cornell University and providing all the neces-sary facilities to write and to finish this paper. C.S would also like to thank R. Giovanelli, M. Haynes for useful remarks and comments.
This research has made use of the NASA/IPAC Extragalactic Database (NED) which is operated by the Jet Propulsion Laboratory, California Institute of Technology, under contract with the National Aeronautics and Space Administration. We have made use of the Lyon-Meudon Extragalactic Database (LEDA) supplied by the LEDA team at the CRAL-Observatoire de Lyon (France)
References
Alonso-Herrero A., Aragon-Salamanca A., Zamorano J., Rego M., 1996, MNRAS 278, 417
Augarde R., Chalabaev A., Comte G., Kunth D., Maehara H., 1994, A&AS 104, 259
Berger J., Cordoni J.P., Fringan A.M., Guibert J., Moreau O., Reboul H., Vanderriest C., 1991, A&AS 28, 377
Cananzi K., 1993, PhD thesis, Observatoire de Marseille Comte G., Augarde R., Chalabaev A., Kunth D., Maehara H.,
1994, A&A 309, 345
Coziol R., Demers S., Pena M., Torres-Peimbert S., Fontaine G., Wesemael F., Lamontagne R., 1993, MNRAS 261, 170C Coziol R., Demers S., Pena M., Barneoud R., 1994, AJ 108
405C
Jacoby G.H., Hunter D.A., Christian C.A., 1984, ApJS 56, 257 Gallego J., Zamorano J., Aragon-Salamanca A., Rego M., 1995,
ApJ 455, 1
Gallego J., Zamorano J., Rego M., Vitores A.G., 1996, A&AS 120, 323
Giovanelli R., Haynes M.P., 1991, ARA&A 29, 499
Guibert J., Charvin P., Stoclet P., 1984, in: Astronomy with Schmidt Type Telescopes, Cappacioli M. (eds.). Reidel p. 165
Guibert J., Moreau O., 1991, ESO Mesenger 64, 69 Haro G., 1956, Bol. obs. Tonantzitla y Tacubaya 14, 329 Hewitt A., Burbidge G., 1991, ApJS 75, 297
Hopp U., Kuhn B., Thiele U., Birkle K., Elsasser H., Kovachev B., 1995, A&AS 109, 537
Klemola A.R., Jones B.F., Hanson R.B., 1987, AJ 94, 501 Lauberts A., the ESO/Uppsala Survey of the ESO(B) Atlas,
1982 ESO
Markarian B.E., 1967, Astrofizika 3, 55
Markarian B.E., Stepanian D.A., 1983, Astrofizika 19, 639 Maza J., Ruiz M.T. Gonzalez L.E., Wischnjewsky M., 1991,
A&AS 89, 389
Mihalas D., Binney J., 1981, Galactic Astronomy, 2nd Ed, Freeman
Osterbrock D., 1989, in: “Astrophics of Gaseous Nebulae and Active Galactic Nuclei”, Kelly A. (ed.). University Sciences book
Pesch P., Sanduleak R., 1983, ApJS 51, 171
Popescu C., Hopp U., Hagen H.J., Els¨asser H., 1996, A&AS 116, 43
Salzer J.J., 1989, ApJ 347, 152
Salzer J.J., Moody J.W., Rosenberg J.L., Gregory S.A., Newberry M.V., 1995, AJ 109, 2376
Schmidt M., 1968, ApJ 151, 393 Soubiran C., 1992, A&A 259, 394 Surace C., 1993, PhD thesis
Surace C., Comte G., 1994, A&A 281, 653 (Paper I)
Takase B., Miyauchi-Isobe N., 1984, Annals Tokyo Astr. Obs. 2nd Ser. XVIII, 55
Zamorano J., Rego M., Gallego J., Vitores A.G., Gonzalez-Riestra R., Rodriguez-Caderot G., 1994, ApJS 95, 387 Zwicky F., 1965, ApJ 142, 1293
178 C. Surace and G. Comte: The Marseille Schmidt survey for active star-forming galaxies. I. Table 1.


![Fig. 6. Dependance [OIII] λ5007/λ4959 ratio on the velocities.](https://thumb-eu.123doks.com/thumbv2/123doknet/14783117.597502/6.892.76.422.151.390/fig-dependance-oiii-λ-λ-ratio-velocities.webp)