HAL Id: insu-02377830
https://hal-insu.archives-ouvertes.fr/insu-02377830
Submitted on 24 Nov 2019
HAL is a multi-disciplinary open access
archive for the deposit and dissemination of
sci-entific research documents, whether they are
pub-lished or not. The documents may come from
teaching and research institutions in France or
abroad, or from public or private research centers.
L’archive ouverte pluridisciplinaire HAL, est
destinée au dépôt et à la diffusion de documents
scientifiques de niveau recherche, publiés ou non,
émanant des établissements d’enseignement et de
recherche français ou étrangers, des laboratoires
publics ou privés.
Steady-state Two-phase Flow in Porous Media:
Statistics and Transport Properties
Ken Tallakstad, Henning Knudsen, Thomas Ramstad, Grunde Løvoll, Knut
Jørgen Måløy, Renaud Toussaint, Eirik Flekkøy
To cite this version:
Ken Tallakstad, Henning Knudsen, Thomas Ramstad, Grunde Løvoll, Knut Jørgen Måløy, et al..
Steady-state Two-phase Flow in Porous Media: Statistics and Transport Properties. Physical Review
Letters, American Physical Society, 2009, 102 (7), �10.1103/PhysRevLett.102.074502�. �insu-02377830�
Ken Tore Tallakstad,1 Henning Arendt Knudsen,1 Thomas Ramstad,2, 3 Grunde
Løvoll,1 Knut Jørgen M˚aløy,1 Renaud Toussaint,4 and Eirik Grude Flekkøy1
1Department of Physics, University of Oslo, PB 1048 Blindern, NO-0316 Oslo, Norway 2Department of Physics, Norwegian University of Science and Technology, NO-7491 Trondheim, Norway
3Numerical Rocks AS, Stiklestadv. 1, NO-7041 Trondheim, Norway 4Institut de Physique du Globe de Strasbourg, UMR 7516 CNRS,
Universit´e de Strasbourg, 5 rue Ren´e Descartes, F-67084 Strasbourg Cedex, France (ΩDated: December 22, 2008)
We study experimentally the case of steady-state simultaneous phase flow in a quasi two-dimensional porous medium. The dynamics is dominated by the interplay between a viscous pressure field from the wetting fluid and bubble transport of a less viscous, nonwetting phase. In contrast to more studied displacement front systems, steady-state flow is in equilibrium, statistically speaking. The corresponding theoretical simplicity allows us to explain a data collapse in the cluster size distribution as well as the relation |∇P | ∝√Ca between the pressure gradient in the system and the capillary number.
PACS numbers: 47.56.+r,47.55.dd,47.55.Ca,89.75.Fb
Different types of immiscible multi-phase fluid flow in porous media play an important role in many natural and commercial processes [1–3]. The complex fluid pat-terns observed in such processes have been extensively studied and modeled over the last decades, see [1–5] and references therein.
The vast majority of work up to now has focused on invasion processes; either pure drainage or pure imbibi-tion. These inherently transient processes give different displacement patterns and are classified into capillary fin-gering [6], viscous finfin-gering [5, 7–12], and stable front dis-placement [13, 14]. These are non-stationary processes, and to understand them in a broader context there is a need to understand the stationary case which has re-ceived far less attention: steady-state flow, which is in equilibrium in the sense that average flow properties and distribution functions are invariant in time. This sta-tionary system is in statistical equilibrium although it is a dissipative process; an external energy input balances the internal energy loss to maintain the equilibrium.
With some notable exceptions there is to our knowl-edge very little pore scale experimental data available for such problems [15]. The Payatakes group did pore scale steady-state experiments using network models etched in glass [16], and later theoretical modeling predicting the non-linearity of such flows [17]. In addition some numer-ical work has focused on a steady-state regime; a pore scale Lattice-Boltzmann study by Rothman et al. [18] and network simulations at larger scales by Knudsen et al. and Ramstad et al. [19–22].
In this Letter we experimentally demonstrate that an equilibrium flow situation results after simultaneous in-jection of two fluids into a porous medium. This allows for the combination of mean-field approximations of local quantities and energy dissipation considerations. As a re-sult we analytically obtain the highly non-trivial
steady-state pressure-flowrate relationship. Furthermore, in contrast to transient flows, steady-state mass conserva-tion gives a normalizaconserva-tion condiconserva-tion based on flowrate rather than saturation. From this we derive a scaling law of the cluster size distributions of nonwetting fluid.
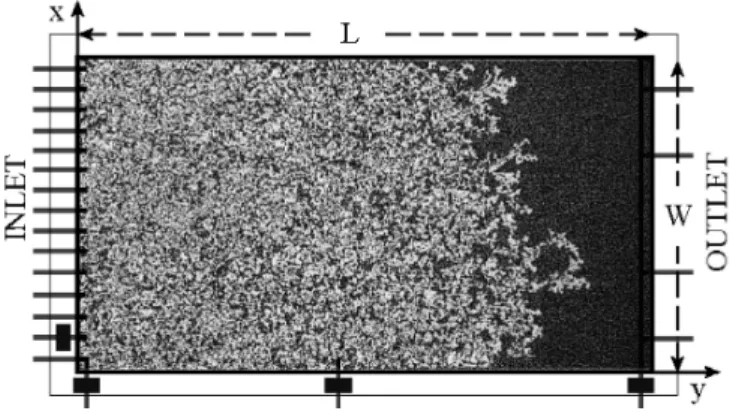
FIG. 1: Depicted inside the model frame (L×W =85×42 cm2) is the initial transient stage of an experiment. There are 15 independent inlet holes with tubes and syringes attached. Ev-ery second syringe injects the wetting phase, the others inject the nonwetting one. An outlet channel with four exit holes allows the fluid mix to leave the system. Three SensorTech-nics 26PC0100G6Gflow-through pressure sensors (indicated by the solid rectangles) are attached alongside the model at the positions y = 0, L/2, L. Additionally one pressure sensor is attached to the first ”air”-tube from the bottom.
Our system is shown in Fig. 1. The horizontal porous model consists of a mono-layer of glass beads of diameter a=1 mm, which are randomly spread between two trans-parent contact papers [7, 13]. The model dimensions are L × W =85 × 42 cm2, with thickness a and volume V = aLW . The porosity and absolute permeability are measured to be φ = 0.63 and κ0= (1.95 ±0.1)×10−5cm2
2 by weight glycerol-water solution dyed with 0.1%
Ne-grosine, and has a viscosity µw = 0.11 Pa · s at room
temperature. Air is used as the nonwetting fluid with viscosity µnw=1.9 × 10⁻⁵ Pa · s, giving a viscosity ratio
M =µnw/µw∼10−4. The surface tension is measured to
be γ = 6.4 × 10⁻²N · m−1.
The tuning parameter in the experiments is the total flow-rate, i.e. the sum of the flow-rate of the wetting and nonwetting fluid, and can during steady-state be written as Qtot= Qw+ Qnw = (8 + 7)Q0, where Q0is the
flow-rate from every single syringe.
Gray scale images of the flow structure are taken at regular intervals with a Pixelink Industrial Vision PL-A781digital camera. An image contains 3000×2208 pix-els, corresponding to a spatial resolution of ∼0.19 mm per pixel (27 pixels in a pore of size 1 mm2). All
anal-ysis is done on the basis of black and white thresholded images [14], and the measured pressure signals.
The porous model is initially saturated with the wet-ting phase. An experiment is started by injecwet-ting the fluid pair from every other inlet hole. The initial struc-ture consists of bubbles or clusters of air distributed over various sizes, but always much smaller than the system size. The clusters are embedded in a background field of percolating wetting fluid. Usually the smallest air clus-ters are immobile and trapped, whereas larger clusclus-ters are mobile and propagate in the porous medium. How-ever, trapped clusters can be mobilized when they coa-lesce with larger migrating clusters and migrating clus-ters can be fragmented and thereby trapped.
We divide an experiment into two regimes. A transient regime where the mix of nonwetting clusters and wetting fluid gradually fills up the model, as seen in Fig. 1. Dur-ing this time the measured average pressure difference between y = 0 and y = L, ∆PL increases. This is due
to the presence of more and more air clusters trapped in the system, effectively lowering the relative permeability for the viscous wetting fluid. At some characteristic time, shortly after both phases are produced at the outlet, ∆PL
starts to fluctuate around a constant value. This marks the start of the steady-state (or statistically stationary) regime. The whole model now contains a homogeneous mix of the two phases, transported through the model without “long time” flow parameter changes.
Through six experiments we have studied how the mea-sured steady-state pressure difference ∆PL varies with
the Capillary number Ca, defined as Ca = µwQwa
2
γκ0A
, (1)
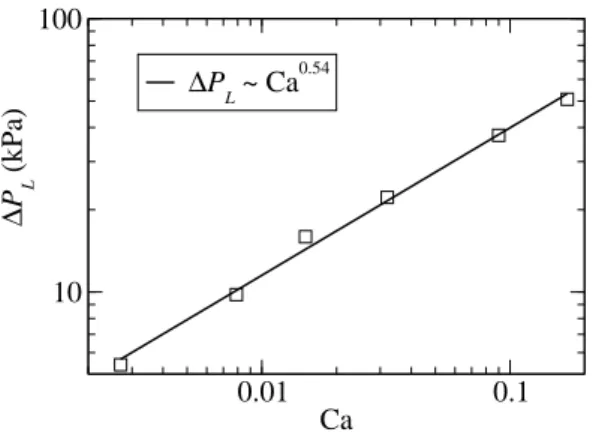
where A = W a is the cross-sectional area. This is shown in Fig. 2, for a span in the Ca-number of roughly two decades. It is evident that the pressure is consistent with a power law in the Ca-number, ∆PL ∝ Caβ, where the
exponent is found to be β = 0.54 ± 0.08. This is a non-trivial result, and we will return to the discussion shortly.
0.01 0.1 Ca 10 100 ∆ P L (kPa) ∆P L ~ Ca 0.54
FIG. 2: Mean value of the pressure difference ∆PL during steady-state as a function of Ca. The fluctuations in ∆PLare of the order of 1 kPa, i.e. very small compared to the mean values. A power law dependence is found, with exponent β = 0.54 ± 0.08.
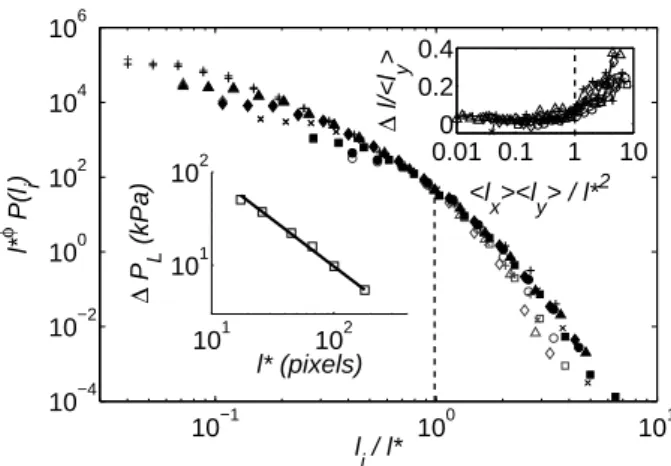
A general trend in the experiments, in passing from high to low Ca-numbers, is that the size or area of the largest air clusters increases. This means that the geom-etry of the clusters depends on the steady-state pressure gradient. To quantify this, we have found the normalized probability distributions of cluster extension in the x-and y-direction, P (lx) and P (ly) respectively (see Fig. 3).
We define the extension lengths lxand ly as the sides of
the smallest rectangle (bounding box) that can contain a cluster. For clarity, ly lays parallel to the average flow
direction, whereas lx lays transverse to the average flow
direction.
Analysis shows that for a cluster of a given area s, the extension lengths have well defined means hlxi and hlyi
increasing monotonically with s [23]. The corresponding standard deviations are small and proportional to these means (relatively 20%) for all hlxi and hlyi values [23].
Furthermore we find that hlxi=hlyi up to a
characteris-tic length scale in the system l∗
. Above l∗
, hlyi > hlxi,
as shown in the upper right inset of Fig. 3. The exact same behaviour is seen in the distributions P (lx) and
P (ly). Fig. 3 shows, for the same Ca-numbers used
pre-viously, a collapse of the P (lx) and P (ly) distributions
by the rescaling l∗φP (l
i) vs. li/l∗. The scaling exponent
φ = 2.8 ± 0.3 is taken as the value that gives the best collapse. Apart from the expected crossover when the extension lengths reaches the pore length scale, a, the collapse is very good. The above results reveal impor-tant information of our system; particularly that there is only one length scale l∗
, dependent on the pressure dif-ference ∆PL, that controls the steady-state displacement
structure.
In the following we shall give a simple and minimal scaling theory for the purpose of predicting the exponents β and φ from Fig. 2 and 3 respectively.
Consider a nonwetting cluster in the porous medium surrounded by flowing viscous wetting fluid. The cluster
10−1 100 101 10−4 10−2 100 102 104 106 l i / l* l* φ P(l i ) 101 102 101 102 l* (pixels) ∆ P L (kPa) 0.01 0.1 1 10 0 0.2 0.4 <l x><ly> / l* 2 ∆ l/<l y >
FIG. 3: Air cluster extension length distributions P (ly) (filled markers) and P (lx) (empty markers), collapsed by the rescal-ing l∗φP (l
i) vs. li/l∗, where i ∈ {x, y} and φ = 2.8. The dashed vertical line at li = l∗ indicates the start of the dif-ferent cutoff behaviour in the two directions. Lower left inset shows (solid line) ∆PL∝ 1/l∗ with the corresponding exper-imental values (squares). Upper right inset shows ∆l/hlyi vs. hlxihlyi/l∗2, where ∆l = hlyi − hlxi.
perimeter is made up of several menisci standing in differ-ent pores. A single meniscus at a particular position has a surface pressure given by the pressure difference of the nonwetting and wetting fluid on each side. The nonwet-ting fluid pressure is assumed constant inside the cluster due to its low viscosity, whereas the wetting fluid pressure is position dependent, decreasing in the y-direction. The neighbouring pores inside and outside the meniscus can be either imbibed or drained respectively if the surface pressure exceeds one of the capillary pressure thresholds for imbibition or drainage. The imbibition and drainage threshold pressures depend on pore geometry, and are thus distributions due to the randomness of the porous medium [24].
If all menisci along the perimeter are in mechanical equilibrium, the cluster is immobile. This is typically the case for clusters with only a small ly extension. However,
for large enough ly, the viscous pressure drop on the
wet-ting side of the perimeter is sufficient for a migration step to take place. Migration is the process of drainage in one pore and imbibition in another along the perimeter. The result of several migration steps is that the cluster moves, and perhaps also changes shape. The onset of migration will depend on the difference between the mean thresh-old pressure for drainage and imbibition [24]; a pressure we denote ¯Pt. Furthermore, ¯Pt predicts a characteristic
length of extension l∗
for cluster mobility |∇P | l∗
= ∆PLl ∗
L = ¯Pt, (2) where we make the mean field assumption that the pres-sure gradient |∇P | is constant. The scaling of the last equality in Eq. (2) is verified experimentally, as shows the
lower left inset in Fig. 3. Note that l∗
also determines when clusters become unstable against breakup, since the mechanism of cluster mobilization is the same as that of cluster fragmentation. This is important because it links the single crossover length that collapses both P (li)
dis-tributions in Fig. 3 to the extension of mobilized clusters. Particularly, it means that the characteristic lx-extension
of mobilized clusters is l∗
.
Equilibrium conditions require the total dissipation in the system to be balanced by the work rate done through the external pressure drop: Qtot∆PL = Df. In
obtain-ing Df, we assume that the main contribution to
dissi-pation is in the volume of the wetting fluid, and that the dissipation in the nonwetting fluid is negligible. Visual observation indicates that most of the wetting fluid is re-stricted to flow through narrow channels at some typical spacing. The motion and configuration of the nonwet-ting clusters seem to show that the channel width is of the order of a pore size ∼ a, and that the permeability in between channels is made relatively low by the presence of lowly mobile nonwetting clusters. Motivated by these observations we define a dissipative wetting fluid volume.
Vdis= LAdis= La2 W l∗ = aV l∗ , (3) where l∗
is taken as the spacing between channels, mak-ing W/l∗
the number of channels through the system. This simplification of channel flow of the wetting fluid is a strong assumption but supporting numerical simula-tions also show that the dissipative volume is constrained to a small fraction of the total volume, changing with the flowrate.
Since the overall interface area between the wetting and nonwetting phase is fluctuating around a constant value in steady-state, changes in the potential energy stored in the interfaces do not contribute to the average dissipation, and we are justified in writing
Qtot∆PL= Df = − Z Vdis dV u|∇P | =µκw 0 Z Vdis dV u2, (4) where we have applied Darcy’s law locally, in the dissi-pative part of the wetting fluid. Taking the local Darcy velocity u = (Qw/A)(V /Vdis) as a constant, and using
Eqs. (3), (1) and (2) respectively we obtain ∆PL= 8γV l
∗
15a3ACa ⇒ |∇P |
2= 8γ ¯Pt
15a3Ca , (5)
i.e. |∇P | ∝ √Ca, consistent with the exponent β in Fig. 2. An alternative interpretation of this result is that the wetting fluid experiences an effective permeability, assuming a Darcy law κeff(Ca) = µwQw/A|∇P |, due to
the flow of air:
κ2eff=
15γ 8a ¯Pt
4 We turn now to the distributions of cluster extension
lengths, and the found exponent φ. From the collapses in Fig. 3 it is seen that the distributions can be written
Pi(l) = l −φh
i(l/l ∗
) , (7)
where the cutoff functions hi(x) are dominating. Note
that this scaling form should only be expected to hold for l above the lower cutoff scale ∼ a. To obtain φ we use the fact that the nonwetting flowrate is an imposed quantity, and must in steady-state be equal to the accu-mulated flow of all mobile clusters on the average. The contribution of a single cluster of extent l to the total nonwetting flowrate is alU (l), where U (l) is the average centre of mass velocity. Further, the average number of clusters of extension (l, l + dl) that intersects any given cross section A, is given as dlPi(l)N l/L. Hence we can
write Qnw= aN L Z ∞ a dl l2U (l)Pi(l) , (8)
where N is the total number of clusters. This number is measured and found to depend only weakly, at most logarithmic, on Qnw. For simplicity, N will be treated as
a constant in the following.
To obtain U (l) we make the general assumption that it is linear in Qnw and has some functional dependence
on l/l∗
U (l) = Qnw A f (l/l
∗
) . (9)
As a first order approximation f (x) would be a step func-tion, since clusters of size l < l∗
usually are immobile. By Eqs. (7) and (9) and the substitution x = l/l∗
, Eq. (8) can be written 1 = l∗(3−φ)aN V Z ∞ a/l∗ dxx2−φf (x)hi(x) . (10)
Since the right hand side of Eq. (10) must be independent of l∗
, we obtain φ = 3 consistent with the experimental value in Fig. 3.
In conclusion, experiments have been done on two-phase flow in a porous medium under steady-state con-ditions. In contrast to invasion processes and other in-herently transient phenomena of two-phase flow, steady-state is in a statistical sense an equilibrium situation. Whereas the description of transient behaviour is a whole range of separate loosely attached cases, depend-ing on flow parameters, the description and formalism for steady-state should be more integrated and universal. Our work explores a part of its parameter space and we find a robust power law behaviour: pressure increases as ∆PL∝ Ca0.5, alternatively for permeability κeff∝ Ca0.5.
The power law is valid over roughly two decades, but there should be cutoffs for large and small flow rates.
For high flow rate, the cutoff cluster size will approach the pore size, and from that point the permeability must reach a plateau. The same is the case for flow rates low enough that the largest clusters are limited by the system size. These limits were not realized experimentally, but in numerical work these cutoffs have been seen [20, 22]. The scaling behaviour of the system was explained by theoretical arguments, relying on a high viscosity ratio. Numerical work with a lower viscosity ratio (steady-state but somewhat different boundary conditions) indicates a lower exponent: ∆PL ∝ Caβ
′
, where β′
< 0.5 [20]. We conjecture that the presented theory is a limiting case, thus suitable as a starting point for further theoretical developments, aiming at incorporating the more complex case where the two fluids have more similar viscosities.
The work was supported by NFR through PETRO-MAKS, a CNRS PICS, an ANR ECOUPREF project and a regional REALISE program. A special thanks to Alex Hansen for useful comments.
[1] J. Bear, Dynamics of Fluids in Porous Media (American Elsevier Publishing Company, New York, 1972). [2] F. A. L. Dullien, Porous Media Fluid Transport and Pore
Structure (Academic Press, Inc., San Diego, 1992), 2nd ed.
[3] M. Sahimi, Flow and Transport in Porous Media and Fractured Rock (VCH Verlagsgesellschaft mbH, Wein-heim, 1995).
[4] R. Lenormand, E. Touboul, and C. Zarcone, J. Fluid Mech. 189, 165 (1988).
[5] P. G. Saffman and G. Taylor, Proc. Roy. Soc. A 245, 312 (1958).
[6] R. Lenormand and C. Zarcone, Phys. Rev. Lett. 54, 2226 (1985).
[7] G. Løvoll, Y. Meheust, R. Toussaint, J. Schmittbuhl, and K. J. M˚aløy, Phys. Rev. E 70, 026301 (2004).
[8] L. Paterson, Phys. Rev. Lett. 52, 1621 (1984).
[9] K. J. M˚aløy, J. Feder, and T. Jøssang, Phys. Rev. Lett. 55, 2688 (1985).
[10] J. P. Stokes, D. A. Weitz, J. P. Gollub, A. Dougherty, M. O. Robbins, P. M. Chaikin, and H. M. Lindsay, Phys. Rev. Lett. 57, 1718 (1986).
[11] J.-D. Chen and D. Wilkinson, Phys. Rev. Lett. 55, 1892 (1985).
[12] R. Toussaint, G. Løvoll, Y. Meheust, K. J. M˚aløy, and J. Schmittbuhl, Europhysics Letters 71, 583 (2005). [13] O. I. Frette, K. J. M˚aløy, J. Schmittbuhl, and A. Hansen,
Phys. Rev. E 55, 2969 (1997).
[14] Y. Meheust, G. Løvoll, K. J. M˚aløy, and J. Schmittbuhl, Phys. Rev. E 66, 051603 (2002).
[15] M. J. Oak, L. E. Baker, and D. C. Thomas, Journal of Petroleum Technology 42, 1054 (1990).
[16] D. G. Avraam and A. C. Payatakes, J. Fluid Mech. 293, 207 (1995).
[17] M. S. Valavanides and A. C. Payatakes, Advances in Wa-ter Resources 24, 385 (2001).
[18] A. K. Gunstensen and D. H. Rothman, Journal of Geo-physical Research 98, 6431 (1993).
[19] H. A. Knudsen, E. Aker, and A. Hansen, Transport in Porous Media 47, 99 (2002).
[20] H. A. Knudsen and A. Hansen, Phys. Rev. E 65, 056310 (2002).
[21] H. A. Knudsen and A. Hansen, Europhysics Letters 65, 200 (2004).
[22] T. Ramstad and A. Hansen, Phys. Rev. E 73, 026306
(2006).
[23] K. T. Tallakstad, G. Løvoll, H. A. Knudsen, T. Ramstad, and K. J. M˚aløy, To be submitted (2008).
[24] H. Auradou, K. J. M˚aløy, J. Schmittbuhl, and A. Hansen, Transport in Porous Media 50, 267 (2003).