HAL Id: hal-01765616
https://hal.archives-ouvertes.fr/hal-01765616
Submitted on 22 Jun 2018HAL is a multi-disciplinary open access
archive for the deposit and dissemination of sci-entific research documents, whether they are pub-lished or not. The documents may come from teaching and research institutions in France or abroad, or from public or private research centers.
L’archive ouverte pluridisciplinaire HAL, est destinée au dépôt et à la diffusion de documents scientifiques de niveau recherche, publiés ou non, émanant des établissements d’enseignement et de recherche français ou étrangers, des laboratoires publics ou privés.
Submarine groundwater discharge at Forsmark, Gulf of
Bothnia, provided by Ra isotopes
Lindsay Krall, Giada Trezzi, Jordi Garcia-Orellana, Valenti Rodellas,
Carl-Magnus Morth, Per Andersson
To cite this version:
Lindsay Krall, Giada Trezzi, Jordi Garcia-Orellana, Valenti Rodellas, Carl-Magnus Morth, et al.. Submarine groundwater discharge at Forsmark, Gulf of Bothnia, provided by Ra isotopes. Marine Chemistry, Elsevier, 2017, 196, pp.162-172. �10.1016/j.marchem.2017.09.003�. �hal-01765616�
1
2
Submarine groundwater discharge at Forsmark, Gulf of Bothnia,
3
provided by Ra isotopes
4
Lindsay Krall*1,2,3, Giada Trezzi4, Jordi Garcia-Orellana4, Valenti Rodella,5, Carl-Magnus
5
Mörth2, Per Andersson3
6 7
1The Swedish Nuclear Fuel and Waste Management Company, Sweden
8
2Department of Geological Science, Stockholm University, Stockholm Sweden
9
3Department of Geosciences, Swedish Museum of Natural History, Stockholm, Sweden
10
4Institue de Ciència I tecnologia Ambientals, Universitat Autònoma de Barcelona, Spain
11
5 CEREGE, Aix-Marseille Université, Aix-en-Provence, France
12 13 14 15 16 17 18 19 20 21
Abstract 22
Submarine groundwater discharge (SGD) to the Gulf of Bothnia, Baltic Sea, has been
23
believed to be insignificant from hydrological models, yet geochemical investigations of SGD
24
in this basin are limited. In this study, 223Ra, 224Ra, 226Ra, and 228Ra have been complemented
25
by stable δ18O and δ2Η isotopes to characterize and quantify SGD rates from the coast of
26
Forsmark, Sweden to Öregrundsgrepen Strait (Gulf of Bothnia). In shallow bays, SGD has
27
been traced using relations between Ra, δ2Η and δ18Ο isotopes and salinity. Zonal SGD from
28
deformation zones, expressed as hydraulically conductive fractures, overlain by the
29
Börstilåsen esker, a strip of conductive gravel sediment, have been traced through offshore
30
224Ra
xs and 226Ra trends. On the basis of a 224Raxs mass balance, the SGD flow rate ranges
31
from (5.5 ± 3.0) · 103 m3 d-1 to (950 ± 520) · 103 m3 d-1. These rates are up to two orders of
32
magnitude higher than those determined from local hydrological models, which consider only
33
the fresh component of SGD. From the divergence between the hydrological and 224Raxs
34
models, it is inferred that the site is influenced by a component of recirculated seawater.
35
1 Introduction 36
Submarine groundwater discharge (SGD) is defined as the flow of water across the sea floor,
37
including the outward flow of fresh meteoric groundwater and the recirculation of seawater
38
through the coastal aquifer (Burnett, 2003; Moore, 2010). In several areas of the world, this
39
process has been recognized as an important pathway for the transport of chemical
40
compounds, including: nutrients (e.g. Rodellas et al., 2015), metals (e.g. Windom et al., 2006;
41
Trezzi et al., 2016), pollutants (e.g. Boehm et al., 2004), and natural radionuclides (e.g.
42
Garcia-Orellana et al., 2013).
43
The Ra isotope quartet (long-lived 226Ra and 228Ra and short-lived 223Ra and 224Ra; t1/2 ~1600
44
y, 5.75 y, 11.4 d, and 3.66 d, respectively) has been used to trace and quantify the flow of
SGD in several environments, particularly the Pacific, Atlantic, and Mediterranean coasts
46
(Swarzenski et al., 2007; Swarzenski and Izbicki, 2009; Kwon et al., 2014 and references
47
therein). Through application of 228Ra, Moore et al. (2008) determined that the rate of SGD to
48
the upper Atlantic Ocean was similar to that freshwater inputs by rivers. Similarly, Kwon et
49
al. (2014) developed a 228Ra-based model to estimate the rate of SGD to the Atlantic and
50
Indo-Pacific Oceans and showed that SGD was a major source of nutrients to the oceans.
51
However, a noted source of uncertainty in the model was sparsity of 228Ra observations from
52
some areas, for instance the boreal regions, of the global ocean.
53
From a 226Ra model, Destouni et al. (2008) suggested that the discharge of fresh groundwater
54
accounts for ~4% of the total freshwater inflow to the boreal Baltic Sea. Nevertheless, using
55
natural geochemical tracers off the coast of Poland, Symczycha and Pempkowiak (2016)
56
determined that SGD processes can impact material budgets in the Baltic Sea even alongside
57
low flow rates of fresh SGD. Little is known of SGD-driven material fluxes to the northern
58
and eastern coasts of the Baltic Sea. However, they have been presumed to be less important
59
than to the southern and eastern Baltic coasts (Symczycha and Pempkowiak, 2016).
60
Ra isotope methodology is typically applied in saline water due to the potential for Ra
61
adsorption to particles in low salinity environments (Li and Chan, 1979; Elsinger and Moore,
62
1980). However, long- and short-lived Ra isotopes may allow various components of SGD to
63
be discriminated, including relative contributions from fresh groundwater and recirculated
64
seawater (e.g. Charette et al., 2008; Rodellas et al., 2017). Therefore, despite the brackish
65
salinity of the Baltic Sea, it is of interest to characterize SGD to the Gulf of Bothnia using Ra
66
isotopes.
67
Forsmark (Sweden) lies on the southwest coast of the Gulf of Bothnia, the northern-most
68
basin of the Baltic Sea (Figure 1.a). As a current host of a geologic repository for low-level
radioactive waste and a proposed host of a high-level waste repository, the hydrology and
70
geochemistry around Forsmark have been thoroughly investigated (SKB, 2008). This
71
provides an ideal backdrop to apply Ra isotopes to quantify and characterize SGD in a
72
brackish environment. δ18O, δ2Η and major cation measurements complement the 224Raxs
-73
based SGD flow estimates. The purpose of this study is to characterize and quantify SGD
74
from Forsmark to the Gulf of Bothnia through integration of the hydrological knowledge of
75
the site with geochemical and isotopic tracers.
76
2 Site background 77
Baltic seawater (hereafter “brackish water”) is brackish due to mixing between fresh water
78
sourced from the Scandinavian mainland and saline water from the north Atlantic Ocean. The
79
salinity ranges from one in the northern Gulf of Bothnia to nine near the Danish straits. Since
80
seawater exchange through the Danish straits is limited, tidal sea level fluctuations are minor
81
throughout the Baltic Sea (Voipio, 1981). Symczycha and Pempkowiak (2016) have
82
suggested that groundwater discharge to the Baltic Se occurs mainly along the southern and
83
eastern coasts. Through geochemical methods, the rate of fresh SGD to the Bay of Puck,
84
along the Polish coast, was determined to range from 9 · 10-4 m3 m-2 d-1 to 2.8 · 10-2 m3 m-2 d-1
85
and was correlated with monthly precipitation. The recirculated seawater component, with a
86
rate ranging from 4 · 10-3 to 4 · 10-2 m3 m-2 d-1 was found to be important (Symczycha and
87
Pempkowiak, 2016).
88
Forsmark, Sweden lies along the coast of the Öregrundsgrepen strait, within the
Sub-89
Cambrian Peneplain, a widespread, low-relief landscape within Fennoscandia. The ~6 x 4 km2
90
area investigated for the repositories reaches a maximum elevation of ~20 m.a.s.l. Several
91
hydraulically conductive fracture zones intersect the bedrock surface of Öregrundsgrepen,
92
through which the discharge of brackish-to-saline groundwater to the strait is possible
(Laaksoharju et al., 2008, Figure 1.b. and 1.c). Jarsjö et al. (2008) developed a hydraulic
94
model for the Forsmark site and attributed up to 20% of the total freshwater input to
95
Öregrundsgrepen (2.4 · 103 m3 d-1 or ca. 1.5 · 10-4 m3 m-2 d-1) to fresh SGD from diffuse
96
sources along the coast.
97
Deposition of glacial sediments, such as glacial sand and clay, both with low hydraulic
98
conductivities, occurred throughout the Forsmark land and seabed during the Pleistocene
99
glaciations (Hedenström et al., 2008). The Börstilåsen esker, a strip of hydraulically
100
conductive gravel sediments deposited directly over the bedrock surface, extends NW-SE
101
across the land and seabed (Figure 1.a). These deposits are overlain by an
Fe,Mn-102
(oxyhydr)oxide-bearing mud (Borgiel, 2004; Voipio, 1981).
103
Although SGD to the Swedish coast of the Baltic Sea has been presumed low, pockmarks
104
related to permeable layers in glacial clay deposited on the seabed in the Stockholm
105
archipelago, approximately 200 km from Forsmark, have been observed by Söderberg &
106
Flodén (1997) and Jakobsson et al. (2016). These formations mark an area of gas (Hovland,
107
1985) or groundwater escape (Robb 1984) and in this region range from centimeters to tens of
108
meters in size (Söderberg & Floden, 1997; Jakobsson et al., 2016). Limited geochemical work
109
has been performed alongside the geophysical documentation of pockmarks along the
110
Swedish coast. However, pockmarks on the Baltic coast of Germany were associated with an
111
SGD rate of 9 · 10-3 m3 m-2 d-1 (Schlüter et al., 2004). Symczycha and Pempkowiak (2016)
112
suggest that discharge to the Baltic coast from glacial sediments has been underestimated.
3 Sampling and methods 114
3.1 Field surveys
115
Three sampling campaigns were performed at Forsmark, in the strait of Öregrundsgrepen, to
116
collect water and sediment samples for Ra and geochemical analysis. In November 2013,
117
three 25 L samples of seawater were taken directly from the Forsmark shore (S1-S3) and
118
salinities were measured using a YSI-30 probe.
119
A larger campaign in spring 2014 included the collection of water samples from: three
five-120
station transects (t1-5, t6-10, and t11-15), two stations in the shallow bay Tixelfjärden
(TF1-121
2), four stations in the larger bay Kallrigafjärden (KF1-4), and five piezometers which
122
represent shallow groundwater (SFM0001, SFM0032, SFM0049, SFM0059, SFM0060; ~5
123
m.b.s.l.). Additionally, deeper groundwater, representative of two of the fracture zones which
124
intersect the bedrock surface of Öregrundsgrepen, was sampled from two boreholes (KFR01,
125
KFR07A; ~50 m.b.s.l.) (Figure 1.a, 1.b). At each sea station, 50 L samples for Ra analysis and
126
0.5 L samples for δ18O, δ2H, and major cation analysis, respectively, were filtered through a
127
0.45 µm filter. Salinity profiles were recorded in the field at each station using a YSI-650
128
probe. Ten-liter groundwater samples were collected for Ra analyses, and 0.5 L for analyses
129
of δ18O, δ2H, and major cations.
130
In October 2014, a sediment core was collected from Tixelfjärden bay using a Van Veen grab
131
sampler in order to conduct a Ra diffusion experiment following the methodology used by
132
Rodellas et al. (2012). Fifty liters of seawater overlying the sediment core was also collected
133
for use in the experiment.
134 135
136
137
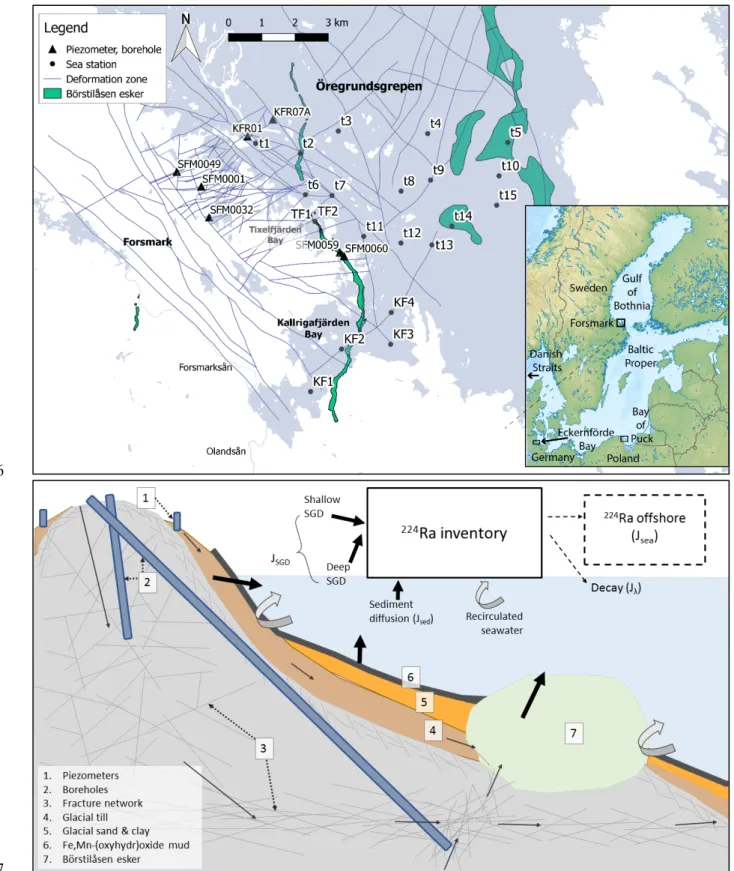
Figure 1: (a) Topographic map of Sweden, including Forsmark and the Gulf of Bothnia in the 138
Baltic Sea and sampling stations in Forsmark and Öregrundsgrepen, with deformation zones,
139
and Börstilåsen esker. (b) Conceptual illustration of Forsmark fracture network, notable
140
geological formations, groundwater flow (narrow, solid black arrows), and potential Ra
141
supply and removal processes (box model), modified after Follin et al. (2007).
142 143
3.2 Methods
144
3.2.1 Radium
145
On site, brackish water and groundwater samples were passed through columns loaded with
146
25 g of manganese-impregnated acrylic fiber (hereafter ‘Mn-fiber’) at a flow rate <1 L min-1
147
to extract the Ra isotopes (Moore, 1973; Moore et al., 1995). Two water samples were filtered
148
through a series of two columns to check the efficiency of Ra extraction with Mn-fibers. After
149
the Ra extraction, the Mn-fibers were rinsed with Ra-free deionized water and then partially
150
dried (Sun and Torgersen, 1998). The short-lived Ra isotopes (223Ra and 224Ra) were
151
measured within seven and three days of collection, respectively, using a Radium Delayed
152
Coincidence Counter (RaDeCC) as described by Moore and Arnold (1996). 224Ra activities
153
were corrected for 228Th and uncertainties of 223Ra and 224Raxs concentrations were estimated
154
following Garcia-Solsona et al. (2008). Afterwards, the fibers were ashed (820 °C, 16 h),
155
ground and transferred to hermetically sealed counting vials to determine long-lived Ra
156
isotopes (Charette et al., 2001). After aging the vials for three weeks to ensure equilibrium
157
between the 226Ra and its daughters, 226Ra and 228Ra were measured using a well-type
158
germanium gamma detector. 226Ra and 228Ra were determined using the 214Pb and 228Ac
159
photopeaks at 352 and 911 keV, respectively. All Ra activities were corrected for radioactive
160
decay since the time of sampling. The relative uncertainties for 223Ra, 224Ra
xs , 226Ra, and 228Ra
161
were respectively 13%, 14%, 7%, and 11% in the brackish water and 5%, 15%, 3%, and 3%
162
in the groundwater.
163
3.2.2 δ18O, δ2H
164
The δ18O and δ2H values were determined using cavity ring down spectroscopy on a Picaro
165
Isotope Water Analyser, L2140-i, and is expressed vs. Vienna Standard Mean Ocean Water
166
(VSMOW). δ18O and δ2H values were normalized so that the difference between Standard
167
Light Antarctic Precipitation (SLAP) and VSMOW was exactly -55.5‰ for δ18O and -428‰
for δ2H. The precision for measurements were 0.1‰ for δ18O and 0.6‰ for δ2H based on
169
standards run as samples
170
3.2.3 Major cations and trace elements
171
Cations were measured on an ICP-OES using a Thermo ICAP 6500 DUO. Calibrations were
172
made from multi-element standards bought from LGC-PROMOCHEM and calibrations were
173
checked with a certified standard, NIST 1640a. The NIST 1640a were within ±5% for all
174
elements. Samples were diluted 100x or 10x for major cations and were run undiluted for
175
trace elements. In some cases, an internal standard was used (Y, approx 2 mg/L) which was
176
added by having a T-Coupling before the nebulizer (an Ultra Sonic nebulizer, Cetac
177
U5000AT+, were used for trace elements and a VGROOVE nebulizer for major elements).
178
After every 20 samples an internal control were analyzed, which was also used to drift correct
179
data if necessary.
180
3.2.4 Diffusive flux experiments
181
Quantification of the Ra diffusive flux from the marine sediments was performed in order to
182
check to contribution from of Ra from bottom sediments to the Ra inventory in seawater. The
183
sediment core and 3 L of the brackish water collected from Tixelfjärden were placed in a
184
plastic container and the sediments were allowed to settle. Brackish water above the core was
185
circulated through a Mn-fiber overnight, to ensure that the water was free of Ra at the
186
beginning of the experiment. A closed loop system was assembled using a peristaltic pump
187
and plastic tubing, interconnecting the water overlying the core to a column containing
Mn-188
fiber. Water continuously circulated through the tubing and the Mn-fiber. Fibers were
189
replaced after progressively longer time periods (12, 24, 48, and 72 hours). Diffusive fluxes
190
for each Ra isotope were estimated from the slope of the Ra activity versus incubation time
191
regression line, divided by the core surface area plotted against incubation time to obtain
192
fluxes in dpm m-2 h-1 following the methodology of Rodellas et al. (2012).
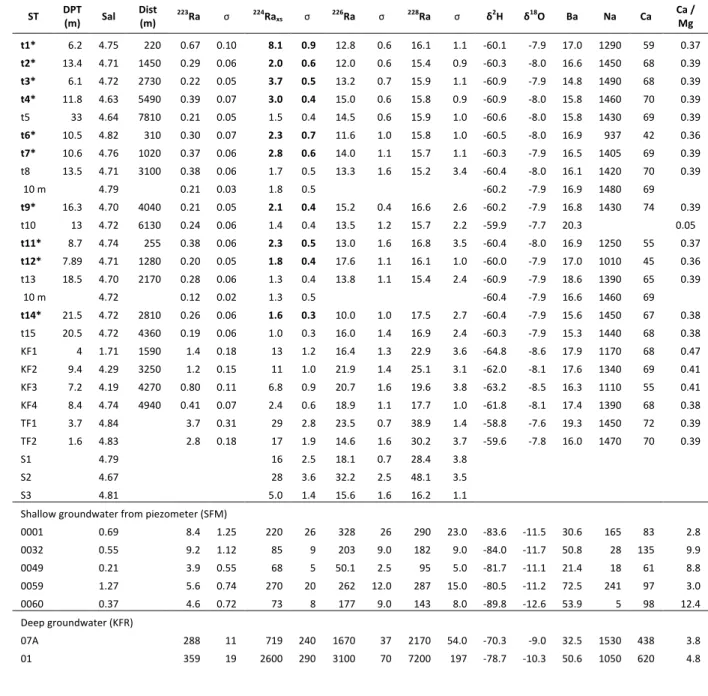
4 Results 194
The measured salinities, Ra isotopes activities, δ2H and δ18O values, Ba and Ca
195
concentrations and Ca/Mg ratios are shown alongside water column depth and distance from
196
shore for each station in Table 1.
197
Table 1: Summary of results for the sampled stations. Depth of water column (DPT), distance
198
from shore (m), and salinity alongside Ra activities in dpm 100L-1, Ba in µg/L, Na and Ca in
199
mg/L. Uncertainties for δ2H and δ18O were ± 0.6 and ± 0.1, respectively.
200
ST DPT (m) Sal Dist (m) 223Ra σ 224Ra
xs σ 226Ra σ 228Ra σ δ2H δ18O Ba Na Ca Ca / Mg
t1* 6.2 4.75 220 0.67 0.10 8.1 0.9 12.8 0.6 16.1 1.1 -60.1 -7.9 17.0 1290 59 0.37 t2* 13.4 4.71 1450 0.29 0.06 2.0 0.6 12.0 0.6 15.4 0.9 -60.3 -8.0 16.6 1450 68 0.39 t3* 6.1 4.72 2730 0.22 0.05 3.7 0.5 13.2 0.7 15.9 1.1 -60.9 -7.9 14.8 1490 68 0.39 t4* 11.8 4.63 5490 0.39 0.07 3.0 0.4 15.0 0.6 15.8 0.9 -60.9 -8.0 15.8 1460 70 0.39 t5 33 4.64 7810 0.21 0.05 1.5 0.4 14.5 0.6 15.9 1.0 -60.6 -8.0 15.8 1430 69 0.39 t6* 10.5 4.82 310 0.30 0.07 2.3 0.7 11.6 1.0 15.8 1.0 -60.5 -8.0 16.9 937 42 0.36 t7* 10.6 4.76 1020 0.37 0.06 2.8 0.6 14.0 1.1 15.7 1.1 -60.3 -7.9 16.5 1405 69 0.39 t8 13.5 4.71 3100 0.38 0.06 1.7 0.5 13.3 1.6 15.2 3.4 -60.4 -8.0 16.1 1420 70 0.39 10 m 4.79 0.21 0.03 1.8 0.5 -60.2 -7.9 16.9 1480 69 t9* 16.3 4.70 4040 0.21 0.05 2.1 0.4 15.2 0.4 16.6 2.6 -60.2 -7.9 16.8 1430 74 0.39 t10 13 4.72 6130 0.24 0.06 1.4 0.4 13.5 1.2 15.7 2.2 -59.9 -7.7 20.3 0.05 t11* 8.7 4.74 255 0.38 0.06 2.3 0.5 13.0 1.6 16.8 3.5 -60.4 -8.0 16.9 1250 55 0.37 t12* 7.89 4.71 1280 0.20 0.05 1.8 0.4 17.6 1.1 16.1 1.0 -60.0 -7.9 17.0 1010 45 0.36 t13 18.5 4.70 2170 0.28 0.06 1.3 0.4 13.8 1.1 15.4 2.4 -60.9 -7.9 18.6 1390 65 0.39 10 m 4.72 0.12 0.02 1.3 0.5 -60.4 -7.9 16.6 1460 69 t14* 21.5 4.72 2810 0.26 0.06 1.6 0.3 10.0 1.0 17.5 2.7 -60.4 -7.9 15.6 1450 67 0.38 t15 20.5 4.72 4360 0.19 0.06 1.0 0.3 16.0 1.4 16.9 2.4 -60.3 -7.9 15.3 1440 68 0.38 KF1 4 1.71 1590 1.4 0.18 13 1.2 16.4 1.3 22.9 3.6 -64.8 -8.6 17.9 1170 68 0.47 KF2 9.4 4.29 3250 1.2 0.15 11 1.0 21.9 1.4 25.1 3.1 -62.0 -8.1 17.6 1340 69 0.41 KF3 7.2 4.19 4270 0.80 0.11 6.8 0.9 20.7 1.6 19.6 3.8 -63.2 -8.5 16.3 1110 55 0.41 KF4 8.4 4.74 4940 0.41 0.07 2.4 0.6 18.9 1.1 17.7 1.0 -61.8 -8.1 17.4 1390 68 0.38 TF1 3.7 4.84 3.7 0.31 29 2.8 23.5 0.7 38.9 1.4 -58.8 -7.6 19.3 1450 72 0.39 TF2 1.6 4.83 2.8 0.18 17 1.9 14.6 1.6 30.2 3.7 -59.6 -7.8 16.0 1470 70 0.39 S1 4.79 16 2.5 18.1 0.7 28.4 3.8 S2 4.67 28 3.6 32.2 2.5 48.1 3.5 S3 4.81 5.0 1.4 15.6 1.6 16.2 1.1 Shallow groundwater from piezometer (SFM) 0001 0.69 8.4 1.25 220 26 328 26 290 23.0 -83.6 -11.5 30.6 165 83 2.8 0032 0.55 9.2 1.12 85 9 203 9.0 182 9.0 -84.0 -11.7 50.8 28 135 9.9 0049 0.21 3.9 0.55 68 5 50.1 2.5 95 5.0 -81.7 -11.1 21.4 18 61 8.8 0059 1.27 5.6 0.74 270 20 262 12.0 287 15.0 -80.5 -11.2 72.5 241 97 3.0 0060 0.37 4.6 0.72 73 8 177 9.0 143 8.0 -89.8 -12.6 53.9 5 98 12.4 Deep groundwater (KFR) 07A 288 11 719 240 1670 37 2170 54.0 -70.3 -9.0 32.5 1530 438 3.8 01 359 19 2600 290 3100 70 7200 197 -78.7 -10.3 50.6 1050 620 4.8
4.1 Salinity
201
In the transects (stations t1-15, 1 m depth) salinity ranged between 4.63 and 4.82. The salinity
202
in Tixelfjärden bay (TF1-2) was slightly higher than in the offshore transects (4.83-4.84). In
203
Kallrigafjärden bay, the salinity was lower near the streams of Forsmarksån and Olandsån
204
(1.7, KF1) and increased toward the opening of the bay (4.7, KF4).
205
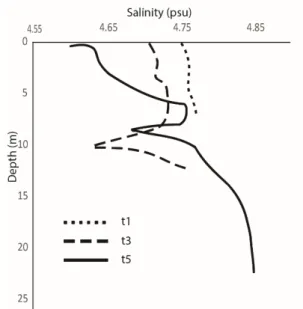
Salinity variation throughout the water column was within the uncertainty of the measurement
206
(± 0.1), thus stations of < 10 m depth exhibited no significant change in salinity with depth
207
(Figure 2). Stations with a deeper water column showed a halocline at ~10 m depth, where
208
salinities decreased from ~4.8 to ~4.6 (Figure 2).
209
Shallow groundwaters were fresh, with a salinity range 0.4 to 1.3. However, Cl
-210
concentrations in the deep groundwaters were up to a factor of three greater than brackish
211
Baltic water, thus the deep groundwaters were more saline than the Baltic water.
212
213
Figure 2: Salinity profiles for stations t1 (dashed), t3 (solid), and t5 (dotted). 214
4.2 Ra isotopes
215
In the transects, 226Ra and 228Ra activities ranged 10 ‒ 18 and 15 ‒ 18 dpm 100L-1,
216
respectively (Figure 3.a‒b). These values are similar to those reported from the central Gulf of
217
Bothnia, of 13.3 ± 1.2 and 14.7 ± 1.6 dpm 100L-1, respectively (Porcelli et al., 2001). The
218
223Ra and 224Ra
xs activities ranged 0.19 ‒ 0.70 and 1.0 – 8.1 dpm 100L-1, respectively (Figure
219
3.c‒d). Maximum and minimum activities were found at station t15 and t1, respectively.
220
Gradients were observed within the first 2 km offshore for the short-lived isotopes,
221
particularly 224Ra
xs in transect t1-5 but were not observed for the long-lived isotopes.
222
In Kallrigafjärden bay, 223Ra, 224Raxs, 226Ra, and 228Ra activities ranged 0.4 ‒ 1.6, 2 ‒ 14, 16 ‒
223
19, and 18 ‒ 23 dpm 100L-1, respectively. Activities were higher in Tixelfjärden bay: 2.7 ‒
224
3.7, 17 ‒ 29, 15 ‒ 24, and 30 ‒ 39 dpm 100L-1 for 223Ra, 224Raxs, 226Ra and 228Ra, respectively.
225
In shallow groundwaters, long-lived Ra activities were ~2 to 27-times greater and short-lived
226
Ra activities 0.8 ‒ 270-times greater than the brackish water. 223Ra, 224Raxs, 226Ra, and 228Ra
227
ranged 3.3 ‒ 10, 63 ‒ 290, 48 ‒ 350, and 90 ‒ 310 dpm 100L-1, respectively, in shallow
228
groundwaters. Deep groundwaters were more enriched, with activities 2 ‒ 4 orders of
229
magnitude greater than the brackish water. Deep groundwaters ranged 280 ‒ 380, 470 ‒ 2900,
230
1600 ‒ 3200, and 2100 ‒ 7400 dpm 100L-1 for 223Ra, 224Raxs, 226Ra, and 228Ra, respectively.
231
Minimum activities for the four Ra isotopes were found in SFM0049, while maximum
232
activities in SFM0032 (223Ra), SFM0059 (224Raxs), and SFM0001 (226Ra and 228Ra).
233
4.3 δ2H and δ18O values
234
Shallow groundwaters were distinct from, while deep groundwaters were similar to, the
235
brackish water with respect to δ2H and δ18O values (Table 1). This is because the δ2H and
236
δ18O signature of the deep Forsmark groundwaters was imparted by a component of Littorina
237
Sea (7000 ‒ 9000 BP predecessor to the Baltic Sea), whereas the shallow groundwater
signature was imparted by current meteoric waters (‒89.8 to ‒80.5‰ δ2H and ‒12.6 to ‒
239
11.1‰ δ18O). δ2H and δ18O in the transects ranged ‒60.9 to ‒59.9‰ δ2H and ‒8.0 to ‒7.7‰
240
δ18O, respectively. A mixing line between the Forsmark data and results from the central
241
Baltic Sea (Fröhlich et al. 1988) as an offshore end-member, deviate from the local meteoric
242
water line due to the increased influence of evaporation in the open Baltic (Figure 4).
243
Brackish water in Tixelfjärden bay was enriched in heavy isotopes (maximum ‒58.8‰ δ2H
244
and ‒7.59‰ δ18O) relative to the transects, suggesting a local influence of evaporation, which
245
can produce this heavy signature. Application of the model by Frölich et al. (1988) to the
246
Forsmark coast indicates that the rate of evaporation from Tixelfjärden bay is 15% of the rate
247
of water inflow from Öregrundsgrepen to Tixelfjärden bay. This is corroborated by Engqvist
248
et al. (2006), who demonstrated a faster rejuvenation of water towards the center of the strait.
249
The lighter signature (lower isotope values) in Kallrigafjärden bay is reminiscent of influence
250
by current meteoric water.
251 252
253
Figure 3.a–.d: 226Ra and 228Ra (a-b) and 224Raxs and 223Ra (c-d) activities as a function of
254
distance offshore (m). Circle to indicate systematic increases in 224Raxs and 226Ra activity.
255 256
4.4 Geochemistry
257
Geochemical results (Na, Ca, Ca/Mg, and Ba) are presented in Table 1. Ba exhibits chemical
258
behavior similar to Ra due to size and ionic radius. Ca/Mg ratios can be used to trace mixing
259
between groundwaters and brackish water, as Ca in groundwater is predominantly sourced by
260
aquifer solids whereas Mg by the brackish water (Smellie et al. 2008). Therefore,
261
geochemistry may be used to investigate Ra geochemistry and mixing between ground- and
262
brackish Baltic water. Ba concentrations ranged 15 ‒ 20 µg L-1 in the brackish water, 21 ‒ 73
263
µg L-1 in the shallow groundwater, and 33 ‒ 51 µg L-1 in the deep groundwater. However, Ca
264
is more enriched than Ba in groundwater relative to seawater. Deep groundwater
265
concentrations are particularly high, ~530 mg Ca L-1, while the shallow groundwater
266
concentration (~95 mg Ca L-1) is only slightly higher than the brackish Baltic water (~65 mg
267
Ca L-1). Groundwater Ca/Mg ratios are over an order of magnitude higher than brackish water
268
ratios.
270
Figure 4: δ2H and δ18O of groundwater and seawater samples, samples of Fröhlich (1988), and the 271
local meteoric water line (LMWL; Tröjbom et al., 2007). 272
273
4.5 Ra diffusion from sediments
274
Sediment diffusion experiment results were used to derive the flux of Ra diffusion from the
275
fine-grained, Fe,Mn (oxyhydr)oxide-bearing sediments deposited over the Öregrundsgrepen
276
seabed. Calculated 223Ra and 224Raxs diffusion rates amount to (2.2 ± 0.02) and (32 ± 2) dpm
277
m-2 d-1, respectively (Figure 5). These represent upper limits because during the experiment
278
Ra was continuously removed from the water overlying the sediment core, thereby forcing
279
diffusion by maximizing the gradient between the porewater and the overlying water.
280
Diffusion-sourced 226Ra and 228Ra fluxes are locally insignificant because the rate of their
281
production by Th parents is slow (Rodellas et al., 2015) relative to the residence time within
282
Öregrundsgrepen. The 224Raxs diffusion rate is similar to that reported from the Venice
Lagoon (32 dpm d-1 m-2; Garcia-Solsona et al., 2008) and Jamaica Bay (28 dpm d-1 m-2; Beck
284
et al., 2007) but lower than that reported from Long Island Sound ( > 127 dpm m-2 d-1; Garcia
285
Orellana et al., 2014) and the Port of Maó (110 dpm m-2 d-1; Rodellas et al., 2015).
286
287
Figure 5: Diffusive 223Ra and 224Ra activities as a function of time (not corrected for surface
288 area of core, 0.091 m2). 289 5 Discussion 290 5.1 Geochemical behavior of Ra 291
Ra exhibits expected salinity-dependent ion exchange behavior, where Ra in fresh water is
292
predominantly adsorbed to particles. When these particles are transported to saline water, the
293
Ra adsorbed to the particles desorbs after exchange for cations that are enriched in seawater
294
relative to fresh water, particularly Na. Thus, Ra isotopes may lead to an underestimation of
295
SGD if utilized in fresh waters, in which Ra is likely by adsorption attached to particles.
296
The salinity after which Ra behaves conservatively is unclear. Gonneea et al. (2008) and Gu
297
et al. (2012) stated that complete Ra desorption is produced above salinities of 10 ‒ 15,
298
whereas Krest et al. (1999) and Su et al. (2015) suggest a salinity of approximately five. The
299
former authors attributed the variation in Ra adsorption to differences in particle chemistry
300
and size. Experiments in sandy terrains showed that adsorption of Ra to particles is negligible
below ~1.8 (Raanan Kiperwas, 2011). In Öregrundsgrepen, the salinity does not exceed five.
302
Since only the study by Raanan Kiperwas (2011) supports conservative behavior of Ra at
303
salinities less than five, it should be examined whether Ra is an appropriate tracer to apply in
304
the brackish Öregrundsgrepen water.
305
In seawater, Ra desorption is promoted because it is outcompeted by Na for exchange sites,
306
the latter of which is several orders of magnitude more enriched in seawater than in
307
freshwater. Since exchange of Ra for Na is a heterovalent cation exchange process, the
308
reaction involves exponential terms and is influenced by total ionic strength of the solution.
309
Nevertheless, an ion exchange model can be used to understand competition between
310
monovalent and divalent cations for adsorption sites at a range of salinities, assuming that Ra
311
sorption is controlled by an ion exchange rather than a surface complexation mechanism.
312
Equilibrium between a monovalent and divalent cation is expressed by the mass action
313 equation (1): 314 !!"!!"#$ !!"!!"#$! = ! !!"!! !!"!! (1) 315
where X represents the fractional equivalents of the mono- or divalent cation in the solid
316
phase, m the dissolved molar concentrations, and K the composition-dependent selectivity
317
coefficient of the particle. Here, the monovalent cations are represented by Na concentrations
318
in freshwater, brackish Baltic water, and seawater because Na is the most abundant cation in
319
brackish and seawater. Divalent cations are represented by concentrations of Ca, which is
320
more similar to Ra than Mg in size and therefore exhibits more comparable ion exchange
321
behavior.
322
Ca should not exceed 10% of the total Na and Ca adsorbed in brackish water unless K(Na/Ca)
323
exceeds 200 (Figure 6). For reference, K(Na/Ca) values for montmorillonite, a clay with
strong adsorptive properties, range from 2.5 to 6 depending on the ratio of solid to water (25 g
325
L-1 and 2.5 g L-1, respectively; Tertre et al., 2011). Through comparison between these
326
selectivity coefficients, it is inferred that brackish water is more similar to seawater than to
327
fresh water with respect to competition between monovalent and divalent cations. Since
328
adsorption of Ca to particles is not significant in brackish water and the ion exchange
329
behavior of Ra is comparable to that of Ca due to size and ionic radius, adsorption of the Ra
330
to particles should not hinder its application in these brackish waters.
331
332
Figure 6: Fractional occupancy of Ca on solid phase for seawater, brackish water, and fresh 333
water as a function of selectivity coefficient (K).
334 335
5.2 End-member mixing
336
To determine an accurate SGD flow rate, an appropriate endmember groundwater Ra activity
337
should be selected. It would be particularly valuable to distinguish between the discharge of
338
deep and shallow groundwater, because the former were found to contain Ra in activities up
339
to two orders of magnitude higher than the latter. Salinity, stable δ2H and δ18O values, and
340
228Ra/226Ra activity ratios (ARs) have been used to define endmember groundwater
341
components during SGD investigations in the Mediterranean (Povinec et al. 2006;
Solsona et al. 2010; Rodellas et al., 2014), while Ca/Mg ratios are potentially useful at
343
Forsmark (Section 4.4).
344
228Ra/226Ra ARs in the Forsmark groundwaters (0.75 ‒ 2.40) do not differ substantially from
345
those in the coastal and offshore brackish Baltic water (0.84 ‒ 2.07; Figure 7.a). ARs in
346
Tixelfjärden are slightly higher than in the transects, but whether this is due to the discharge
347
of deep or shallow groundwater cannot be distinguished from these data (Figure 7.a). Overall,
348
228Ra/226Ra ARs are inadequate to define the source of groundwater discharge. Salinity, δ2H,
349
and Ca/Mg variations between groundwater and brackish water (Figure 7.b-d) are more
350
significant than 228Ra/226Ra ARs. No clear mixing relation between groundwater and brackish
351
Baltic water for δ2H and 226Ra is observed. However, the Ca/Mg ratios and salinity versus
352
226Ra may indicate mixing between groundwater and brackish Baltic water. Provided the
353
elevated Ca/Mg ratio and salinity in Tixelfjärden bay, local discharge of deep groundwater is
354 viable. 355 5.3 Zonal SGD 356 5.3.1 Offshore transects 357
Fractures intersecting the bedrock surface of the Öregrundsgrepen seabed and the Börstilåsen
358
esker described as potential discharge zones (Section 2) are prevalent through the shallow
359
bays Tixelfjärden and Kalligafjärden and up to 6000 m off the Forsmark coast (Figure 1.a).
360
Higher average 223Ra and 224Raxs activities were observed around the northern-most transect
361
(t1‒5), where the frequency of fractures intersecting the seabed is greatest. Although strong
362
gradients in 226Ra were not observed here, slight increases in offshore 224Raxs and 226Ra
363
activities are associated with the occurrence of these fractures ~1000-1500 and 4000-5000m
364
offshore (3.a, 3.c). Systematic increases in Ra are associated with the fracture zones in each
365
offshore transect, and thus may reflect Ra inputs from these zones.
5.3.2 Tixelfjärden bay
367
Maximum brackish water Ra activities were observed in Tixelfjärden bay. Though the
368
influence of 223Ra and 224Ra diffusion from sediments is more conspicuous in shallow bays
369
due the larger sediment surface area to water volume ratio, 226Ra and 228Ra activities, which
370
are not supplied through sediment diffusion, were elevated in this bay by a factor of two
371
relative to the offshore transects. Given high fracture frequency within the bay and the
372
proximity of the Börstilåsen esker alongside the Ca/Mg ratio (Section 5.3.1), SGD is a
373
plausible local source of Ra enrichment. The rate of evaporation in this bay is ~15% the rate
374
of water inflow from the strait (Section 4.3) and cannot explain the Ra enrichment.
Figure 7a-d: Mixing plots of (a) 228Ra/226Ra ARs, as well as 226Ra as a function (b) of Ca/Mg ratio, (c) δ2H (c), and (d) salinity for deep
376
groundwaters, shallow groundwaters, Tixelfjärden bay, and transects. In enlarged plots, data points larger than uncertainty.
5.3.3 Kallrigafjärden bay
378
Geochemical relationships in Kallrigafjärden bay are influenced by the streams Forsmarksån
379
and Olandsån, which discharge into the western-most regions of the bay, in addition to
380
possible SGD from local deformation zones and the Börstilåsen esker. Mixing between fresh
381
stream water and brackish seawater is indicated by the relation between salinity and δ2H
382
(Figure 8.a; Fröhlich et al., 1988).
383
Streams can transport Ra, which is enriched by as great as a factor of six at the outlets as
384
compared to the mouth of Kallrigafjärden bay. Although short-lived 223Ra and 224Ra
xs, like
385
δ2H, are inversely related to salinity (Figure 8.b), significant Ra input from the streams is not
386
necessarily indicated. A shallow water column is prevalent near the stream outlets, thus 223Ra
387
and 224Ra may be sourced predominantly by sediment diffusion to the shallow water column
388
near the stream outlets. 226Ra and 228Ra, which are not significantly supplied by seabed
389
sediments, are highest toward the center the bay.
390
Relations between salinity and 223Ra, 224Raxs, δ2H, and δ18O values in Kallrigafjärden deviate
391
from a linearity (Figure 8.a-b), which implies an additional source of Ra and δ2H. The
392
deviation is apparent around the central stations proximal to the Börstilåsen esker (KF2 and
393
KF3). Likewise, elevated 226Ra and 228Ra activities are found at these stations (Figure 8.c).
394
Despite a salinity increase to > 4 as compared to 1.7 near the outlet of the streams (KF1), Ra
395
desorption from suspended riverine particles would not explain the deviation in δ2H and δ18O.
396
Therefore, as in Tixelfjärden bay, SGD to Kallrigafjärden bay is a plausible source of Ra.
397 398
399
Figure 8.a-c: (a)δ2H and δ18O, (b) 223Ra,224R, and (c) 226Ra as a function of salinity in
400
Kallrigafjärden bay. Stations KF2 and KF3, which deviate from mixing trend near
401
Börstilåsen, esker circled.
402 403 404
5.4 Ra mass balance and SGD rate estimation
405
SGD flow to Öregrundsgrepen can be determined using a steady state mass balance model,
406
which accounts for supply fluxes of Ra through sediment diffusion and removal fluxes
407
through decay and export to the open sea. The difference between the removal and supply
408
fluxes is converted to an SGD flow rate through division by the Ra activity of a discharging
409
groundwater endmember. The Ra mass balance is as follows:
410
Jsed + JSGD = Jsea + Jλ (2)
411
where Jsed and JSGD denote the input fluxes of a specific Ra isotope through diffusion from
412
seabed sediments and from SGD, respectively while Jsea and Jλ the output fluxes through
413
export to the open Baltic Sea and radioactive decay. Jsed can be constrained using the results
414
of the sediment diffusion experiment (Section 4.5). To constrain Jsea requires determination of
415
the excess inventory of the Ra isotope and the residence time of seawater within the
416
investigated area. Jλ is simply the mean excess Ra activity observed on the site multiplied by
417
the decay constant. Resulting fluxes are in units of dpm d-1.
Since a 224Raxs gradient was observed and more stations were enriched in 224Raxs than in
419
223Ra, 224Ra
xs activities will be used in the mass balance. A mass balance will not be
420
constructed using 226Ra and 228Ra because the average activities found in Öregrundsgrepen
421
(13.7 and 16.0 dpm 100L-1) were not statistically higher than the respective activities reported
422
from the open Baltic Sea (13.3 ± 1.2 and 14.7 ± 1.6 dpm 100L-1; Porcelli et al., 2001).
423
Contribution of 224Ra from rivers and precipitation are neglected. 228Ra activities of ~ 4 dpm
424
100L-1 were found at various locations in the Kalix River, which discharges into the northern
425
Gulf of Bothnia (Porcelli et al., 2001). Assuming secular equilibrium between 224Ra and
426
228Ra, streams would supply only ~10% of the 224Ra
xs than the average shallow groundwater
427
(~140 dpm224Raxs 100L-1) could supply if shallow SGD comprises 17% of the total runoff
428
from the Forsmark coast (Section 2).
429
5.4.1 Site constraints
430
To develop the mass balance, the surface area and volume of seawater affected by SGD must
431
be constrained. A conservative estimate of the 224Raxs activity in the open Baltic Sea is found
432
using the lowest 224Ra
xs activity measured in the studied area (station t15, 1.0 ± 0.3 dpm
433
224Ra
xs 100L-1). The area affected by SGD is then considered to include only those stations
434
with 224Raxs activities statistically higher than the open sea 224Raxs activity (stations t1‒4, t6‒7,
435
t9, t11‒12, and t14; denoted by * in Table 1). Thus, the area influenced by SGD is 16·106 m2.
436
An average depth of 11 m, which represents the depth of the water column averaged over the
437
stations constrained as influenced by SGD, is used to constrain the volume of brackish water
438
influenced by SGD to 180 · 106 m3.
439
5.4.2 Residence time
440
A residence time, which represents the time elapsed since Ra isotopes were transferred from
441
their source to the constrained study site, is required to estimate the flux of Ra exported
offshore. One such age model, developed by Moore (2006), is expressed through the 443 equation: 444 τ= Ra 224 Ra!" 228 ! -Ra 224 Ra!" 228 !"# Ra 224 Ra!" 228 !"#·λ224 (3) 445
where i denotes the initial end-member Ra activity and obs the average 224Raex/228Raex activity
446
ratio observed within the constrained site. The subscript “ex” denotes the observed coastal
447
224Ra
xs or 228Ra activity subtracted by the offshore activity (i.e. the Ra signal corrected for
448
mixing with open seawater). An offshore 228Ra activity of 14.7 dpm 100L-1, reported by
449
Porcelli et al. (2001) from the central Gulf of Bothnia, was used to derive 228Ra
ex, the mean of
450
which was 1.6 dpm 100L-1. ARs involving 224Ra are used because the residence time is likely
451
on the order of days, considering the size of the investigation site. This model relies on the
452
assumption that Ra is removed from the system only through radioactive decay and exchange
453
with open-sea waters. The initial end-member activity, i, will depend on the amount of 224Raxs
454
and 228Ra supplied to the seawater by SGD and sediment diffusion. Since this term is
455
unknown, the highest 224Raex/228Raex AR of (5.9, t1) is here used under the assumption that
456
this ratio is found closest to the Ra source so that minimum decay is expected.
457
A residence time of 12 ± 14 days was obtained using 224Raex/228Raex ARs of the constrained
458
site. The uncertainty is large due to the propagation of analytical uncertainty combined with
459
low Ra activities. However, the Ra-based TR model agrees with previous hydrological
460
models, which determined a residence time of 9-11 days for the spring season (Engqvist,
461
1999). Provided the lower uncertainty of the hydrological model, a residence time of 11 ± 2
462
days is used to reduce the uncertainty propagated to the mass balance calculation.
5.4.3 Contribution from sediments
464
The experimental 224Raxs diffusive flux (32 ± 1.8 dpm m-2 d-1; Section 4.3.3) can be converted
465
to total 224Ra
xs flux from sediments by multiplying them by the surface sediment area of the
466
investigation site (16·106 m2), under the assumption that the core sample represents sediments
467
homogeneously distributed across the seabed of the constrained site. The resulting 224Raxs flux
468
from sediment diffusion (Jsed) is (520 ± 31) · 106 dpm d-1.
469
5.4.4 Selection of SGD end-member
470
At Forsmark, salinity, δ2H, Ca/Mg ratios, and 228Ra/226Ra ARs can neither be used to define
471
the groundwater source of SGD nor to determine whether the deep or shallow groundwater is
472
discharging (Section 5.3). However, the groundwater end-member can be selected based on
473
the hydrological understanding of the site. For instance, the SFM0059 is a plausible shallow
474
groundwater end-member because it is sampled from the Börstilåsen esker, a potential SGD
475
channel (Section 2). This shallow groundwater probably mixes with some deep groundwater
476
component sourced by the fracture network. To constrain a minimum rate of SGD, the
477
shallow and deep groundwaters which had the highest 224Raxs activities (SFM0059 and
478
KFR01, respectively) are used in the SGD rate calculation.
479
5.4.5 SGD rate estimation
480
The coastal 224Raxs inventory, or the total activity of 224Raxs in the volume of brackish water
481
influenced by SGD (Section 4.1.1), must be established for the mass balance (Equation 2).
482
The inventory is determined by 1) multiplying the 224Raxs activities of the stations within the
483
constrained site by respective water column depth, 2) averaging the results of (1) (in dpm m
-484
2), and 3) multiplying (2) by surface area of the constrained site (16·106 m2). The resulting
485
inventory, (4800 ± 1700) · 106 dpm, can then be apportioned into Jsea, Jsed, Jλ, and JSGD (in
486
dpm d-1).
Jsea, the flux of Ra exported to the open sea, is determined from the excess inventory, i.e. the
488
difference between the total 224Raxs inventory within the site and that supplied by the open sea
489
(conservatively estimated to 1.3 dpm 100L-1, Section 5.4.1), divided by the residence time (11
490
± 2 d). This results in a Jsea of (260 ± 160) · 106 dpm 224Raxs d-1.
491
The flux of 224Raxs removal through radioactive decay, Jλ, is obtained by multiplying the total
492
224Ra
xs inventory (4800 ± 1700) · 106 dpm) by the decay constant of 224Ra (0.189 d-1). The
493
resulting flux of 224Raxs removal by decay is (900 ± 310) · 106 dpm d-1.
494
Table 2: Calculated mass balance inputs* and SGD rate ranges. 495
224Ra
xs,offshore Inventory Total 224Raxs fluxes (·106 dpm d-1)
224Ra
xs,obs σ224Raxs (·109 dpm) Jsed σsed Jsea σsea Jλ σλ JSGD σSGD
2.8 1.7 4.8 1.7 520 31 270 160 900 310 640 350
SGD rates (m3d-1) Uncertainty
SFM0049 68 5 9.5E+05 5.2E+05
SFM0059 270 20 2.4E+05 1.3E+05
KFR01 2610 290 2.5E+04 1.4E+04
KFR07A 11800 830 5.5E+03 3.0E+03
*Surface area of 16 · 106, an average depth of 11 m, and a volume of 180 · 106 m3 used to calculate
496
fluxes. 497
498
Rearranging Equation 2 to JSGD = Jsea + Jλ - Jsed yields an SGD-derived 224Raxs flux of (640 ±
499
350) · 106 dpmd-1. The flow rate is obtained by dividing this flux with the 224Raxs activity of
500
the end-member groundwaters (Table 2). The resulting SGD rate ranges from (5.5 ± 3.0) ·
501
103 to (950 ± 520) · 103 m3 d-1 (or 3.4 · 10-4 to 5.8 · 10-2 m3 m-2 d-1) depending on whether the
502
end-member is comprised of entirely deep or shallow groundwater, respectively. In reality,
503
SGD is probably comprised of a mixture between shallow and deep groundwater, thus an
504
SGD flow between the two estimates is expected. Proportions deep and shallow groundwater
505
contribution the coastal has not been determined.
507
5.4.6 Recirculated component of SGD
508
Previous hydrological models of the Forsmark area determined a shallow fresh groundwater
509
discharge rate of ~2.4 · 103 m3 d-1 or 1.5 · 10-4 m3 m-2 d-1 (Jarsjö et al. 2008), which is two
510
orders of magnitude lower than the 224Raxs-derived discharge rate of shallow groundwater.
511
Therefore, the SGD rate derived from 224Ra indicates that a component of recirculated
512
seawater, independent of inland hydraulic head, is important in Öregrundsgrepen. When
513
seawater is driven into the coastal aquifer and discharged back into the sea, the generally short
514
residence time in the coastal aquifer allows the water to become enriched in 223Ra and 224Ra,
515
which are rapidly regenerated by aquifer solids, over 226Ra and 228Ra (Leuk & Beck, 2014).
516
Therefore, 223Ra and 224Ra enrichment has been observed in the absence of 226Ra and 228Ra
517
gradients due to the dominance of a short-scale, recirculated seawater component of SGD in
518
Öregrundsgrepen.
519
Tidal cycles (Robinson et al., 2007), geothermal convection (Wilson, 2005), waves (Li,
520
2007), currents and irregular bathymetry (Thibodeaux & Boyle, 1987) have been shown to
521
support seawater recirculation. Although tidal cycles are insignificant in the Baltic Sea, the
522
mean sea level change in Öregrundsgrepen is 0.02 ± 0.2 m d-1 but can change by up to 1.3 m
523
d-1 as a result of changes in atmospheric pressure and wind (Aquilonius 2010). The wind
524
speed in the strait is typically higher than 6.5 m s-1 and is frequently higher than 10.5 m s-1
525
(Larsson-McCann et al., 2002). Geothermal convection may also drive seawater recirculation
526
in this region, as Söderberg & Flodén (1997) observed contrasting temperatures between
527
warm water seeping from seafloor eskers and cold seawater during early spring in the
528
Stockholm archipelago, 200 km south of Öregrundsgrepen. Finally, the entire Baltic Sea basin
529
has developed irregular bathymetry through glacial erosion and sediment deposition (Voipio,
530
1981).
The rate of fresh SGD to Öregrundsgrepen (1.5 · 10-4 m3 m-2 d-1; Jarsjö et al., 2008) is lower
532
than the SGD rates found in the Bay of Puck, Poland (up to 2.8 · 10-2 m3 m-2 d-1) and
533
Eckernförde Bay, Germany (9 · 10-3 m3 m-2 d-1) (Symczycha and Pempkowiak, 2016; Schlüter
534
et al., 2004, respectively), which are the only two locations in the Baltic Sea where
535
geochemical studies of SGD have been conducted. Consideration of a recirculated component
536
in Öregrundsgrepen increases the SGD rate to 5.8 · 10-2 m3 m-2 d-1, which is higher than that
537
reported from the southern Baltic. While the importance of a recirculated component in
538
delivering nutrients and metals to the Baltic Sea is yet unknown, recirculated seawater is an
539
important source of nutrients to the coastal ocean (Weinstein et al., 2011). Accurate
540
determination of SGD-driven nutrient fluxes to the Baltic Sea represents an important area of
541
future research. Finally, it will be valuable to further understand the impact of geothermal
542
convection, irregular bathymetry, and fluctuations in atmospheric pressure on seawater
543
recirculation, an important route of nutrient transport even in the absence of inland hydraulic
544
head.
545
6 Conclusions 546
This study has shown that Ra isotopes can provide estimates of residence time and SGD flow
547
rate at salinities less than five. Ra and stable isotopes have also been used to identify zones of
548
groundwater discharge related to geologic features. Diffusion from seabed sediment is a
549
source of 223Ra and 224Raxs to the Gulf of Bothnia, amounting to ~10% of the total 224Raxs
550
inventory in Öregrundsgrepen.
551
The 224Raxs-derived SGD flow rate ranged between (5.5 ± 3.0) · 103 and (950 ± 520) · 103 m3
552
d-1. The precise rate depends on the relative contributions of deep and shallow groundwater,
553
which are unknown. Nevertheless, these rates are higher than would be expected from δ2H,
554
δ18O, and Ca/Mg ratio mixing calculations. Therefore, a component of recirculated brackish
water is significant in Öregrundsgrepen despite a modest, inland hydraulic head. Since this is
556
a potential source of metals and nutrients to the coast, these findings have important
557
implications on mass transport to the Baltic Sea and other low-relief coastal terrains.
558
Furthermore, hydrological models of the Forsmark site, constructed to understand
559
radionuclide transport from the existing and planned radioactive waste repositories, have not
560
considered a recirculated brackish water component in Öregrundsgrepen. If this can be
561
considered a near-surface process, the effects on radionuclide transport at Forsmark is
562
probably small. Nevertheless, the impact of recirculated seawater should not be overlooked,
563
because coastal regions as prominent locations for nuclear power plants (World Nuclear
564
Association, 2015), are becoming attractive hosts for radioactive waste repositories. Clearly,
565
Ra isotope analysis is a viable and important complement to the models of sites proposed to
566 host repositories. 567 568 Acknowledgements 569
The authors are grateful to Cecilia Berg, Micke Borgiel, Ignasi Puigdomenech, and Karin
570
Wallner for their assistance in field and laboratory work. This article benefitted from critical
571
reviews by Patrik Vidstrand, Emma Johansson, and Lena Evins. This study was supported by
572
the Swedish Nuclear Fuel and Waste Management Company and the European Union’s
573
Seventh Framework Programme for research, technological development, and demonstration
574
under Grant Angreement No. 290336. V.R. has received funding from the European Union’s
575
Horizon 2020 research and innovation programme under the Marie Skłodowska-Curie grant
576
agreement No 748896. Support provided by the Generalitat de Catalunya to MERS (2014
577
SGD – 1356) is also acknowledged.
578 579
References 580
Aquilonius, K. (Ed.), 2010. The marine ecosystems at Forsmark and Laxemar-Simpevarp.
581
SR-Site Biosphere. SKB TR-10-03. SKB, Stockholm, Sweden.
582
Beck, A.J., Rapaglia, J.P., Cochran, J.K., Bokuniewicz, H.J., 2007. Radium mass-balance in
583
Jamaica Bay, NY: Evidence for a substantial flux of submarine groundwater. Mar.
584
Chem. 106, 419–441.
585
Boehm, A.B., Shellenbarger, G.G., Paytan, A., 2004. Groundwater discharge: Potential
586
association with fecal indicator bacteria in the surf zone. Environ. Sci. Technol. 38,
587
3558-3566.
588
Borgiel, M., 2003. Forsmark site investigation: Sampling and analyses of surface sediment in
589
lakes and shallow bays. SKB P-04-05, SKB, Stockholm, Sweden.
590
Burnett, W.C., Bokuniewics, H., Huettel, M., Moore, W.S., Taniguchi, M., 2003.
591
Groundwater and pore water inputs to the coastal zone. Biogeochemistry 66, 3-33.
592
Charette, M.A., Buesseler, K.O., Andrews, J.E., 2001. Utility of radium isotopes for
593
evaluating the input and transport of groundwater-derived nitrogen to a Cape Cod
594
estuary. Limnol. Oceanogr. 46, 465–470.
595
Charette, M.A., Moore, W.S., & Burnett, W.C., 2008. Uranium-and thorium-series nuclides
596
as tracers of submarine groundwater discharge, in: Krishnaswami, S., Cochran J.K.
597
(Eds.), Radioactivity in the Environment, Vol 13. Elsevier, Oxford, pp. 155-191.
598
Elsinger, R.J., Moore,W.S., 1980. 226Ra behavior in the Pee Dee River—Winyah Bay estuary.
599
Earth Planet. Sci. Lett. 48, 239–249.
600
Engvist, A., Andrejev, O., 1999. Water exchange of Öregrundsgrepen: A baroclinic 3-D
601
model study. SKB TR-99-11. SKB, Stockholm, Sweden.
602
Engqvist, A., Döös, K., Andrejev, O., 2006. AMBIO 35, 435–447.
603
Follin, S., Johansson, P.-O., Levén, J., Hartley, L., Holton, D., McCarthy, R., Roberts, D.,
604
2007. Updated strategy and test of new concepts for groundwater flow modelling in
605
Forsmark in preparation of site descriptive modelling stage 2.2. SKB R-07-20. SKB,
606
Stockholm, Sweden.
607
Fröhlich, K., Grabczak, J., Rozanski, K., 1988. Deuterium and oxygen-18 in the Baltic Sea.
608
Chem. Geol. 72, 77-83.
609
Garcia-Orellana, J., Cochran, J.K., Bokuniewicz, H., Daniel, J.W.R., Rodellas, V., Heilbrun,
610
C., 2014. Evaluation of 224Ra as a tracer for submarine groundwater discharge in Long
611
Island Sound (NY). Geochim. Cosmochim. Acta 141, 314–330.
Garcia-Solsona, E., Garcia-Orellana, J., Masque, P., Rodellas, V., Mejias, M., Ballesteros, B.,
613
Dominquez, J.A., 2010. Groundwater and nutrient discharge through karstic coastal
614
springs (Castello, Spain). Biogeosciences 7, 2625-2638.
615
Garcia-Solsona, E., Masqué, P., Garcia-Orellana, J., Rapaglia, J., Beck, A.J., Cochran, J.K.,
616
Bokuniewicz, H.J., Zaggia, L., Collavini, F., 2008. Estimating submarine groundwater
617
discharge around Isola La Cura, northern Venice Lagoon (Italy), by using the radium
618
quartet. Mar. Chem. 109, 292–306.
619
Gu, H., Moore, W.S., Zhang, L., Du, J., Zhang, J., 2012. Using radium isotopes to estimate
620
the residence time and the contribution of submarine groundwater discharge (SGD) in
621
the Changjiang effluent plume, East China Sea. Cont. Shelf Res. 35, 95-107.
622
Hedenström, A., Sohlenius, G., Strömgren, M., Brydsten, L., Nyman, H., 2008. Depth and
623
stratigraphy of regolith at Forsmark, site descriptive modelling Forsmark. SKB
R-08-624
07. SKB, Stockholm, Sweden.
625
Jakobsson, M., O’Regan, M., Gyllencreutz, R., Flodén, T., 2016. Seafloor terraces and
semi-626
circular depressions related to fluid discharge in Stockholm Archipelago, Baltic Sea,
627
in: Dowdeswell, J. A., Canals, M., Jakobsson, M., Todd, B. J., Dowdeswell, E. K.,
628
Hogan, K. A. (Eds.), Atlas of Submarine Glacial Landforms: Modern, Quaternary and
629
Ancient. Geological Society, London, Memoirs 46, pp. 305–306.
630
Jarsjö, J., Shibuo, Y., Destouni, G., 2008. Spatial distribution of unmonitored inland water
631
flows to the sea. J. Hydrol. 348, 59–72.
632
Krest, J.M., Moore, W.S., Rama, 1999. 226Ra and 228Ra in the mixing zones of the Mississippi
633
and Atchafalaya Rivers: indicators of groundwater input. Mar. Chem. 64, 129–152.
634
Kwon, E. Y., Kim, G., Primeau, F., Moore, W.S., Cho, H.-M., DeVries, T., Sarmiento, T.L.,
635
Charette, M.A., Cho, Y.-K., 2014. Global estimate of submarine groundwater
636
discharge based on an observationally constrained radium isotope model. Geophys.
637
Res. Lett. 41, 8438–8444.
638
Laaksoharju, M., Smellie, J., Tullborg, E.-L., 2008. Bedrock hydrogeochemistry Forsmark,
639
site descriptive modelling Forsmark. SKB R-08-47. SKB, Stockholm, Sweden.
640
Larsson-McCann, S., Karlsson, A., Nord, M., Sjögren, J., Johansson, L., Ivarsson, M.,
641
Kindell, S., 2002. Meteorological, hydrological and oceanographical information and
642
data for site investigation program in the communities of Östhammar and Tierp in the
643
northern part of Uppland. SKB TR-02-02. SKB, Stockholm, Sweden.
644
Leuk, J.L., Beck, A.J., 2014. Radium budget of the York River estuary (VA, USA) dominated
645
by submarine groundwater discharge with a seasonally variable groundwater
end-646
member. Mar. Chem. 165, 55-65.
647
Li, L., Barry, D.A., 2000. Wave-induced beach groundwater flow. Adv. Water Resour. 23,
648
325-337.
Li, Y., Chan, L., 1979. Desorption of Ba and 226Ra from river-borne sediments in the Hudson
650
estuary. Earth Planet. Sci. Lett. 43, 343–350.
651
Gonneea, M.E., Morris, P.J., Dulaiova, H., Charette, M.A., 2008. New perspectives on radium
652
behavior within a subterranean estuary. Mar. Chem. 109, 250–267.
653
Moore, W.S., Arnold, R., 1996. Measurement of 223Ra and 224Ra in coastal waters using a
654
delayed coincidence counter. J. Geophys. Res. 101, 1321–1329.
655
Moore, W. S., Astwood, H., Lindstrom, C., 1995. Radium isotopes in coastal waters on the
656
Amazon shelf. Geochim. Cosmochim. Acta 59, 4285-4298.
657
Moore, W., Blanton, J., Joye, S., 2006. Estimates of flushing times, submarine groundwater
658
discharge, and nutrient fluxes to Okatee River, South Carolina. J. Geophys. Res.
659
Oceans 111, C09006, doi: 10.1029/2005JC003041.
660
Moore, W.S., 2010. The effect of submarine groundwater discharge on the ocean. Annu. Rev.
661
Mar. Sci. 2, 59–88.
662
Moore, W.S., Reid, D.F., 1973. Extraction of radium from natural waters using manganese
663
impregnated acrylic fibers. J. Geophys. Res. 78, 8880–8886.
664
Moore, W.S., Sarmiento, J.L., Key, R.M., 2008. Submarine groundwater discharge revealed
665
by 228Ra distribution in the upper Atlantic Ocean. Nat. Geosci. 1, 309–311.
666
Porcelli, D., Andersson, P.S., Baskaran, M., Wasserburg, G.J., 2001. Transport of U- and
Th-667
series nuclides in a Baltic Shield watershed and the Baltic Sea. Geochim. Cosmochim.
668
Acta 65, 2439–2459.
669
Povinec, P.P., Aggarwal, P.K., Aureli, A., Burnett, W.C., Kontar, E.A., Kulkarni, K.M.,
670
Moore, W.S., Rajar, R., Taniguchi, M., Comanducci, J.F., Cusimano, G., Dulaiova,
671
H., Gatto, L., Groening, M., Hauser, S., Levy-Palomo, I., Oregioni, B., Ozorovich,
672
Y.R., Privitera, A.M., Schiavo, M.A., 2006. Characterisation of submarine
673
groundwater discharge offshore south-eastern Sicily. J. Environ. Radioact. 89,
51-674
101.
675
Raanan Kiperwas, H., 2011. Radium Isotopes as Tracers of Groundwater-Surface Water
676
Interactions in Inland Environments. PhD dissertation, Duke University.
677
Robinson, C., Li, L., Barry, D.A., 2007. Effect of tidal forcing on a subterranean estuary.
678
Adv. Water Resour. 30, 851-865.
679
Rodellas, V., Garcia-Orellana, J., Garcia-Solsona, E., Masque, P., Dominguez, J., Ballesteros,
680
B.J., Mejias, M., Zarroca, M., 2012. Quantifying groundwater discharge from different
681
sources into a Mediterranean wetland by using 222Rn and Ra isotopes. J. Hydrol. 466,
682
11-22.