HAL Id: hal-01334615
https://hal.sorbonne-universite.fr/hal-01334615
Submitted on 21 Jun 2016
HAL is a multi-disciplinary open access
archive for the deposit and dissemination of
sci-entific research documents, whether they are
pub-lished or not. The documents may come from
teaching and research institutions in France or
abroad, or from public or private research centers.
L’archive ouverte pluridisciplinaire HAL, est
destinée au dépôt et à la diffusion de documents
scientifiques de niveau recherche, publiés ou non,
émanant des établissements d’enseignement et de
recherche français ou étrangers, des laboratoires
publics ou privés.
Distributed under a Creative Commons Attribution| 4.0 International License
pair in Clytia hemisphaerica eggs shows co-targeting to
mitochondria and efficient bioluminescence energy
transfer
Cécile Fourrage, Karl Swann, Jose Raul Gonzalez Garcia, Anthony K.
Campbell, Evelyn Houliston
To cite this version:
Cécile Fourrage, Karl Swann, Jose Raul Gonzalez Garcia, Anthony K. Campbell, Evelyn Houliston.
An endogenous green fluorescent protein–photoprotein pair in Clytia hemisphaerica eggs shows
co-targeting to mitochondria and efficient bioluminescence energy transfer. Open Biology, Royal Society,
2014, 4 (4), pp.130206. �10.1098/rsob.130206�. �hal-01334615�
rsob.royalsocietypublishing.org
Research
Cite this article: Fourrage C, Swann K,
Gonzalez Garcia JR, Campbell AK, Houliston E.
2014 An endogenous green fluorescent
protein – photoprotein pair in Clytia
hemisphaerica eggs shows co-targeting to
mitochondria and efficient bioluminescence
energy transfer. Open Biol. 4: 130206.
http://dx.doi.org/10.1098/rsob.130206
Received: 19 November 2013
Accepted: 17 March 2014
Subject Area:
cellular biology/genomics
Keywords:
green fluorescent protein, protein coevolution,
bioluminescence resonance energy transfer,
clytin, Hydrozoa
Author for correspondence:
Evelyn Houliston
e-mail: houliston@obs-vlfr.fr
Electronic supplementary material is available
at http://dx.doi.org/10.1098/rsob.130206.
An endogenous green fluorescent
protein – photoprotein pair in
Clytia hemisphaerica eggs shows
co-targeting to mitochondria
and efficient bioluminescence
energy transfer
Ce´cile Fourrage
1,2
, Karl Swann
3
, Jose Raul Gonzalez Garcia
3
,
Anthony K. Campbell
4
and Evelyn Houliston
1,2
1
Sorbonne Universite´s, UPMC Univ Paris 06, Laboratoire de Biologie du De´veloppement de
Villefranche-sur-mer (LBDV), Observatoire Oce´anologique, 06230 Villefranche-sur-mer,
France
2
CNRS, Laboratoire de Biologie du De´veloppement de Villefranche-sur-mer (LBDV),
Observatoire Oce´anologique, 06230 Villefranche-sur-mer, France
3
School of Medicine, Cardiff University, Cardiff CF14 4XN, UK
4
School of Pharmacy and Pharmaceutical Sciences, Cardiff University, Redwood Building,
King Edward VII Avenue, Cardiff CF10 3NB, UK
1. Summary
Green fluorescent proteins (GFPs) and calcium-activated photoproteins of the aequorin/clytin family, now widely used as research tools, were originally isolated from the hydrozoan jellyfish Aequora victoria. It is known that bioluminescence resonance energy transfer (BRET) is possible between these proteins to generate flashes of green light, but the native function and significance of this phenomenon is unclear. Using the hydrozoan Clytia hemisphaerica, we characterized differential expression of three clytin and four GFP genes in distinct tissues at larva, medusa and polyp stages, corresponding to the major in vivo sites of bioluminescence (medusa tentacles and eggs) and fluorescence (these sites plus medusa manubrium, gonad and larval ecto-derms). Potential physiological functions at these sites include UV protection of stem cells for fluorescence alone, and prey attraction and camouflaging counter-illumination for bioluminescence. Remarkably, the clytin2 and GFP2 proteins, co-expressed in eggs, show particularly efficient BRET and co-localize to mitochondria, owing to parallel acquisition by the two genes of mitochon-drial targeting sequences during hydrozoan evolution. Overall, our results indicate that endogenous GFPs and photoproteins can play diverse roles even within one species and provide a striking and novel example of protein coevolution, which could have facilitated efficient or brighter BRET flashes through mitochondrial compartmentalization.
&
2014 The Authors. Published by the Royal Society under the terms of the Creative Commons Attribution License http://creativecommons.org/licenses/by/3.0/, which permits unrestricted use, provided the original author and source are credited.2. Introduction
Both bioluminescence and fluorescence are widespread natu-ral phenomena, particularly in the marine environment [1– 3]. Green light flashes in the hydrozoan jellyfish Aequora victoria are generated by two famous proteins acting together, the calcium-sensitive photoprotein aequorin and green fluor-escent protein (GFP). These proteins and their engineered derivatives are today used for a vast range of applications, including subcellular calcium imaging, cell lineage tracing, gene regulation analysis and detecting protein –protein interactions [4].
The phenomena of bioluminescence and fluorescence are distinct. Bioluminescence involves generation of light from a biochemical reaction, the oxidation of a ‘luciferin’ substrate, catalysed by a photoprotein such as aequorin or by another type of luciferase [5]. Fluorescence involves light emission from a fluorophore following energy absorption, usually from light of a shorter, higher energy wavelength. Confusion can arise because photoproteins themselves can be fluor-escent, but also notably because many organisms contain both photoproteins and other fluorescent proteins (FPs), and show coupling of their activity through a radiationless energy transfer process, termed bioluminescence resonance energy transfer (BRET). In the case of Aequora, aequorin gen-erates blue light with a broad emission peak centred around a wavelength of 460 nm, which directly excites GFP molecules to be re-emitted as green light with a much sharper peak centred at 508 nm [6– 10].
Several distinct families of lucifierases have been character-ized and are thought to have arisen independently during evolution [2,11,12]. Aequorin family luciferases are found in cni-darians and ctenophores, although in anthozoan cnicni-darians their bioluminescence function appears to have been lost [13]. They require calcium ions as essential cofactors and catalyse the oxidation of small, tightly associated, substrate molecules called coelenterazines, which are considered part of the func-tional photoprotein. Binding of aequorins to Ca2þ promotes oxidation of coelenterazine into coelenteramide, and blue light is emitted as this relaxes to the ground state. Aequorin family photoproteins from hydrozoan species include clytins (or phialidins) from the genus Clytia (formerly Phialidium), obelin from Obelia and mitrocomin from Mitrocoma (¼Halistaura), in addition to aequorin from Aequora [14–16].
Many FPs related to GFP have also been isolated from cni-darians. Variation in amino acid sequence around the much conserved ‘SYG’ fluorophore site affects absorption and emis-sion spectra, generating a wide range of brightness and colour properties especially among anthozoans. Most hydrozoan species only have one FP (typically green), although cyan and yellow types have been isolated from Obelia and from an unidentified Philalidium species [17,18]. BRET between aequorin family photoproteins and FPs has been widely demonstrated in cnidarians through spectral studies showing that the in vivo bioluminescence precisely matches that of the corresponding purified GFP both in the wavelength and nar-rowness of the emission peak [7,8,10]. In species lacking GFP, such as the scyphozoan jellyfish Pelagia and the ctenophore Mnemiopsis, bioluminescence is blue, with characteristics matching that of the purified photoprotein [7]. BRET between the molecules relies on an absorption peak of GFP centred around 475 nm and requires a distance between the molecules
of less than 10 nm, which can be achieved by the formation of transient complexes through electrostatic interactions when the two proteins are present at micromolar concentrations [9,19].
Despite the extensive biochemical and structural studies, relatively little attention has been paid to when and where the endogenous aequorins and FP genes are expressed in their species of origin. Historic studies described light-producing organs (‘photophores’) around the rim of the bell in medusae of the hydrozoan species Aequora forskalea and Mitrocoma cellukinia. These distinctive yellow-pigmented structures flank the tentacle bulb or form a broad continuous line, sandwiched between the ectoderm and endoderm of the circular canal between the tentacle bulbs [20,21], and were later found to fluoresce green under UV illumination. In the considerably smaller medusae of Clytia gregarium, tiny light flashes were recorded in the early studies, coinciding with the tentacle bulbs themselves, but no pigmented photophores were distinguishable. An additional dull glow from the gonads was sometimes seen [20]. This could be accounted for by the bioluminescence later described in eggs, in a study also able to record bioluminescence in planula larva and, following metamorphosis, in the polyp form [22].
We have examined the genetic basis of differential fluorescence and bioluminescence in the hydrozoan Clytia hemisphaerica, taking advantages of availability of molecular resources and laboratory-reared medusae [23]. We identified multiple GFP and clytin cDNA sequences, characterized their expression in relation to the distribution of endogenous bio-luminescence and fluorescence and analysed BRET in vivo. Our results shed light on the physiological function of BRET and uncovered an unexpected subcellular compart-mentalization of this process in spawned eggs, achieved by coevolution of mitochondrial targeting sequences of a particular GFP–Cyclin gene pair.
3. Results
3.1. Coelenterazine-dependent bioluminescence
in Clytia eggs and tentacle bulbs
We visualized the sites of bioluminescence in Clytia hemisphaerica medusae (figure 1) stimulated by treatment with calcium iono-phore, detergents or 0.5 M KCl to cause a rise in cytoplasmic calcium concentration [24]. Bioluminescence was detected at very restricted sites at the base of each of tentacle bulb around the bell margin (figure 1a). We cannot rule out the possibility that additional sites emit low-level bioluminescence, undetect-able by our methods. As previously shown in C. gregarium [22], bioluminescence was detectable in spawned C. hemisphaerica eggs (figure 1b,c) and could be fully discharged by detergent lysis. Importantly, we found that pre-incubation in coelentera-zine was required for the detection of bioluminescence in our laboratory-reared Clytia medusae and eggs, probably because this essential photoprotein substrate is normally supplied in the marine crustacean diet but not present in the artemia we used for feeding [25,26].
3.2. Green fluorescence at multiple sites in Clytia
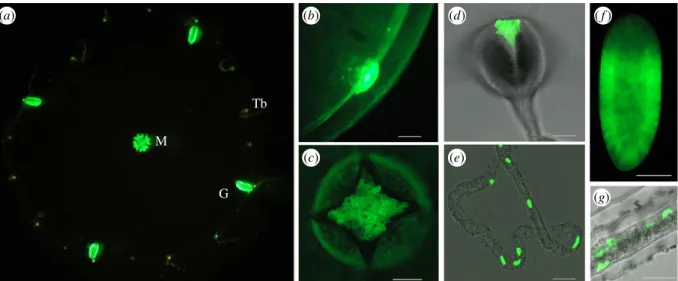
The distribution of endogenous green fluorescence in C. hemi-sphaerica was readily detectable by fluorescence microscopy
rsob.r
oy
alsocietypublishing.org
Open
Biol.
4:
130206
2upon excitation with blue light, in the absence of coelenterazine (figure 2). Highly fluorescent structures included both major sites of bioluminescence (tentacle bulb spots and oocytes/ eggs) but also two additional sites of fully grown adult jelly-fish, the manubrium and the gonad (figure 2a,c). Closer examination of the tentacle bulb photophore revealed small masses of highly fluorescent cells adjacent to the endoderm, and individual fluorescent cells extending into the central region of each tentacle (figure 2b,d,e). In the manubrium (mouth and stomach region) and gonad, strong green fluor-escence was found in both endodermal and ectodermal cells (figure 2c). Weaker fluorescence was observed across the bell (figure 2b). The planula larva showed strong fluorescence, loca-lized to a subpopulation of epitheliomuscular ectodermal cells, largely absent from the aboral pole region (figure 2f). In polyp colonies, green fluorescence was observed in isolated cells in the endoderm of stolon, hydranth (figure 2g) and polyp tenta-cles as well as in some nematocytes (not shown). Fluorescence without bioluminescence in gonad somatic tissue and in
planula larvae in C. hemisphaerica contrasts with the lack of green fluorescence in these tissues reported in C. gregarium [22] but has been reported in the manubrium of Obelia medusa [17,27].
3.3. Gene expression underlying fluorescence
and bioluminescence
Four clearly distinct GFP (CheGFP1–GFP4) and three distinct clytin sequences were identified from our Clytia mixed-stage transcriptome collection [23,28]. Clytia hemisphaerica clytin1 and clytin2 are orthologues of the previously characterized C. gregarium photoproteins clytin-I and clytin-II [15] (confirmed by phylogenetic analysis: see below). The clytin sequences were closely related to each other, 94% similar and 77% identical at the amino acid level, while the CheGFP sequences were 52% similar and 22% identical at the amino acid level (excluding the N terminal leader sequences—see below).
(a) (i) (c) Tb Iono Triton Triton 2000 cps 105 cps 100 s ionomycin G M (ii) (b)
Figure 1. Bioluminescence in C. hemisphaerica. Bioluminescence image of an immobilized whole adult medusa, approximately 1 cm in diameter, stimulated with
0.5 M KCl. Pixels are colour coded according to a scale in which hot colours (including white) indicate the highest levels of bioluminescence, and cold colours
represent low bioluminescence. (a) Inset shows the same medusa by light microscopy indicating the position of tentacle bulbs (Tb), gonads (G) and manubrium
(M). (b) Eggs (approx. 180
mm in diameter) treated first with ionomycin (b(i)) and subsequently treated with Triton X-100 to lyse the egg and discharge all clytin
photoprotein luminescence (b(ii)). The images show luminescence from 200 s of integrated light collection after ionomycin and then after detergent treatment.
Equivalent images taken before the treatment were completely black. Scale bars 100
mm. (c) Luminescence kinetics from one of seven similar eggs treated in the
same way.
(a) (b) M G Tb (d) ( f ) (c) (e) (g)Figure 2. Fluorescence in C. hemisphaerica. Green fluorescence observed upon excitation with blue light under a stereomicroscope (a), fluorescence microscope (b,f )
or confocal microscope with 488 nm laser excitation (c,d,e,g), superimposed on transmitted light images in (d,e,g). (a) Adult medusa immobilized in agar (courtesy
of A. Amiel); M, manubrium; G, gonad; Tb, tentacle bulb. (b) Bell margin with tentacle bulb (baby medusa), (c) manubrium (baby medusa), (d ) tentacle bulb, (e)
tentacle, (f ) planula larva (2 days post fertilization), (g) stolon. For a guide to medusa organization, see figure 4. All scale bars 100
mm.
rsob.r
oy
alsocietypublishing.org
Open
Biol.
4:
130206
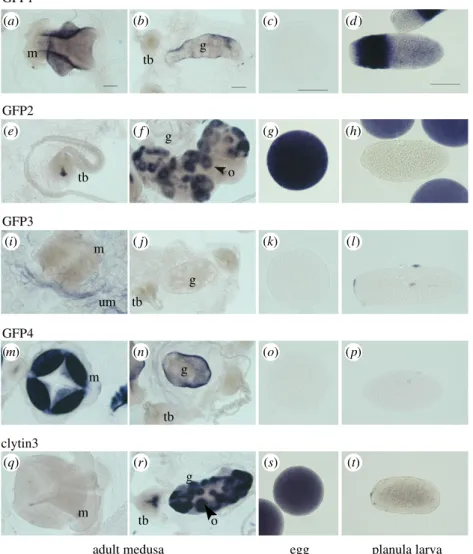
3Each of the four C. hemisphaerica GFP genes was found to have a distinct stage- and tissue-specific expression profile, revealed by in situ hybridization (figure 3) and quantitative PCR (Q-PCR) (figure 4). The individual GFP gene expression profiles (figure 3a–p) covered all the sites of green fluor-escence, indicating that no significantly expressed GFP genes in the Clytia genome had been overlooked. CheGFP1 expression accounted for the fluorescence in the planula larva ectoderm and it is also expressed significantly in the medusa manubrium and gonad ectoderm. CheGFP4 is strongly expressed at the same medusa sites but not in the planula. Expression of CheGFP2, the ‘maternal’ GFP, was strongly detected in developing oocytes as well as in spawned eggs, and also at the tentacle bulb photophores, but not elsewhere. CheGFP3 in situ signal was distributed mainly in the thin ectoderm of the medusa umbrella, where some CheGFP4 expression was also apparent.
The strong sequence similarity of the three C. hemisphaer-ica clytin genes (see above) precluded synthesis of specific probes for in situ hybridization analysis. The combined clytin expression pattern, obtained using antisense probes to any of the three transcripts (figure 3q–t), mirrored the
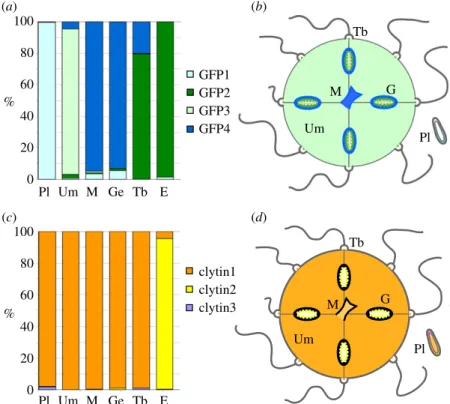
sites of bioluminescence (figure 1), with a strong signal observed in oocytes, eggs and the centre of the tentacle bulb. A weak signal was also observed across other medusa tissues, including the manubrium. Expression territories for the individual clytin genes were determined by Q-PCR analysis (figure 4c). In all the adult somatic tissue tested, we detected predominantly clytin3 mRNA, while eggs were found to express almost exclusively clytin2. Clytin1 was barely detected in any tissue sample.
We conclude that the selective sites of fluorescence and bioluminescence in Clytia result from differential GFP and clytin genes deployment. Bioluminescence is genera-ted by GFP2 combined with clytin3 or clytin2 in tentacles and eggs, respectively, while the strong green fluorescence in the manubrium and gonad ectoderm is generated by GFP4 and GFP1. In the larval ectoderm, GFP1 provides green fluorescence and may also combine with low levels of clytin3 to produce faint bioluminescence. The differential expression of GFP and clytin genes supports the hypothesis that multiple roles for fluorescence and bioluminescence, and possibly other functions for these proteins, coexist in this species. m tb m m m tb g g o tb g g tb tb g GFP1 GFP2 GFP3
adult medusa egg planula larva
GFP4 o clytin3 um (a) (b) (c) (d) (e) ( f ) (g) (h) (i) ( j) (k) (l) (m) (n) (o) (p) (q) (r) (s) (t)
Figure 3. Sites of CheGFP and clytin gene expression. GFP (a – p) and clytin (q – t) expression detected by in situ hybridization in adult C. hemisphaerica medusae,
egg and planula larvae. GFP1 is detected in manubrium and gonad ectoderm (a,b) and in planula larva (d ). GFP2 expression is strongly detected in unfertilized eggs
(g), and restricted to oocytes (f ) and a small proximal zone in tentacle bulb (e) in adult female tissues. GFP3 appears weakly expressed in umbrella (i), while GFP4
is strongly expressed in manubrium (m) and gonad ectoderm (n). In situ hybridization with a clytin3 antisense probe detects the combined expression of the three
clytin genes in a proximal and central zone of tentacle bulbs and oocytes of gonad (r), strong expression in eggs (s) and weaker expression in planula (t). Clytin1 and
clytin2 probes gave equivalent results owing to the cross-detection of highly similar sequences. m, manubrium; g, gonad; o, oocyte; tb, tentacle bulb; um, bell. Scale
bars, 100
mm.
rsob.r
oy
alsocietypublishing.org
Open
Biol.
4:
130206
43.4. Bioluminescence energy transfer between clytin
and GFP in vivo
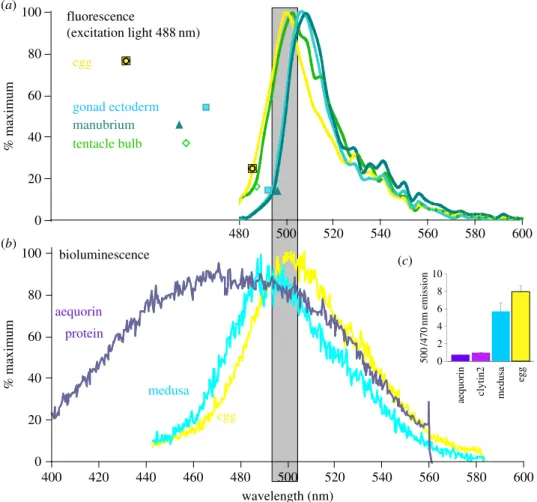
To assess the extent of the BRET between clytin and GFP in vivo, we determined the GFP fluorescence emission spectra for eggs and selected tissues (figure 5a) and the luminescence spectra for groups of whole jellyfish or collected spawned eggs (figure 5b).
Fluorescence spectra were determined using a confocal microscope to provide 488 nm wavelength excitation light (see Material and methods; figure 5a). The medusa and eggs analysed were all from our laboratory cultures with no exo-genous coelenterazine provided, so there was no possibility of bioluminescence under these conditions. Manubrium and gonad tissue showed a fluorescence emission peak at 508– 510 nm, whereas in eggs and tentacle bulbs the emission peak lays at 500–502 nm, indicating that maternally expressed CheGFP2 has an emission spectrum distinct from that of CheGFP1 and CheGFP4. The fluorescence spectra obtained may include a slight contribution of fluorescence from the calcium-discharged form of clytin, which emits at 506 nm peak but with excitation maxima at 270 or 345 nm [8]. Unlike in Obelia [17] and an undetermined Clytia species [18], no yellow or cyan colour variants were detected in C. hemisphaerica. Luminescence spectra were determined following deter-gent treatment of medusae or eggs to trigger an intracellular Ca2þ increase (figure 5b). Bioluminescence from eggs and adults was green. The bioluminescence emission spectrum from eggs was significantly sharper and greener than that of purified photoprotein (aequorin included in figure 5b for com-parison) and directly matched the fluorescence emission spectrum for GFP (compare figure 5a (488 nm excitation) and figure 5b (bioluminescence): shaded zone), indicative of com-plete BRET between the molecules [7]. The occurrence of BRET was also tested using our custom-built luminometer,
which collected light from 10 nm bands at two wavelengths, 500 and 470 nm (figure 5c). This technique confirmed that the bioluminescence of recombinant C. hemisphaerica clytin2 protein was indeed blue, as well documented for aequorin and C. gregarium clytin [7,9,15], and that in vivo biolumines-cence from C. hemisphaerica eggs is green. Assuming that endogenously expressed clytin2 has the same bioluminescence emission properties as purified clytin2, these findings clearly imply that in eggs BRET between the protein pair clytin2–GFP2 is highly effective.
Overall bioluminescence analysed from whole medusae showed a slightly broader and shorter wavelengthed emission peak than that from eggs (figure 5b). Correspondingly, the 500/470 nm ratio measured from whole medusae was slightly lower than that from eggs (figure 5c). Thus, while green biolu-minescence involving BRET to GFP clearly predominates in medusae, where bioluminescence mainly originates from the GFP-rich tentacle bulb photophores (figure 1a), weak biolumi-nescence from other sites with lower clytin expression and thus less complete BRET could account for the shifted emission spectrum obtained from whole medusae. An equivalent shift can be obtained experimentally in vitro by lowering the con-centrations of clytin and GFP proteins [8]. Our methods to determine bioluminescence were not sensitive enough to com-pare emission characteristics between medusae tissues, and we did not determine bioluminescence characteristics in any other life-cycle stages.
3.5. Mitochondrial targeting of maternal GFP and
clytin proteins
The spectral comparisons revealed intriguing high-efficiency in vivo coupling between the co-expressed clytin2 and GFP2
Tb Tb G G Um Um Pl Um M Ge Tb E Pl Um M Ge Tb E Pl Pl M M 100 80 60 40 20 0 100 80 60 40 20 0 % % GFP1 GFP2 GFP3 GFP4 clytin1 clytin2 clytin3 (a) (b) (c) (d)
Figure 4. Relative expression of CheGFP and clytin genes evaluated by Q-PCR. (a) Q-PCR analysis showing relative expression (% of total) of each GFP gene.
(b) Schematic summary of GFP differential expression in Clytia. (c) Relative expression (% of total) of each clytin gene measured by Q-PCR. (d ) Schematic summary
of clytin differential expression in Clytia. All Q-PCR primer sequences are provided in the electronic supplementary material, table S1. Annotations for all panels: Pl,
planulae; Um, bell; M, manubrium; G, gonad; Ge, gonad ectoderm; Tb, tentacle bulb; E, eggs.
rsob.r
oy
alsocietypublishing.org
Open
Biol.
4:
130206
5proteins in Clytia eggs compared with medusa tissues. A further surprise came from closer examination of protein localization in the egg, where we found both fluorescence and bioluminescence localized to mitochondria (figure 6). Firstly, as reported briefly elsewhere [30], confocal microscopy showed the maternally expressed GFP2 protein to be contained within discrete vesicular structures, confirmed as mitochon-dria by comparison with the vital Mitotracker (figure 6a) or TMRE dyes, or use of antibodies recognizing the mitochondrial protein VDAC (not shown). Furthermore, low-speed egg centrifugation co-stratified green fluorescence with organelles stained with Mitotracker Orange (figure 6b). In such cen-trifuged eggs, coelenterazine-dependent, detergent-induced bioluminescence was emitted from the mitochondria-rich zone (figure 6c), indicating that the maternal clytin as well as GFP is targeted to mitochondria.
A further strong indication that GFP2 and clytin2 are tar-geted to egg mitochondria came from sequence analysis (figure 7). The predicted amino acid sequence of clytin2 and of some CheGFP2 variants displayed N-terminal leaders of 30–50 amino acids, which were shown using MITOPROT
(http://ihg.gsf.de/ihg/mitoprot.html) [31] orIPSORT(http://
ipsort.hgc.jp/) [32] protein localization prediction software to have high probability (more than 0.8) to direct protein targeting and internalization within the mitochondrial lumen. For GFP2, pre-sequences with putative cleavage sites were present in sequences of two of the three variants from our EST collection
(figure 7a). The three variants were otherwise quasi-identical at the nucleotide level, suggesting that the putative targeting sequence may derive from an alternative spliced N terminal exon. This was confirmed by the analysis of preliminary raw genomic sequence data from the ongoing C. hemisphaerica genome sequence project. Concerning clytin2 protein, sequence analysis predicted targeting to mitochondria with 0.9 prob-ability. In contrast to Clytia GFP2, no leaderless cDNA variants were identified in our transcriptomic data, while genome sequence analysis confirmed that the 50leader sequence to this
independent gene is not coded by a separate exon.
Biochemical studies had previously provided evidence that bioluminescence in certain cnidarian and ctenophore species is generated in membrane-bound organelles termed lumisomes, around 0.2 mm in diameter [33,34]. In vitro lysis of these particles disrupts BRET, suggesting that they act to maintain high concentrations of photoproteins and GFPs locally. We propose that in the Clytia egg, mitochondrial targeting may fulfil an equivalent compartmentalization function (see Discussion).
3.6. Evolutionary history of clytin and GFP
mitochondrial targeting
Taken together, the expression data, the tight endogenous spec-tral coupling, N-terminal sequence analysis and colocalization
400 420 440 460 480 500 520 540 560 580 600 0 20 40 60 80 100 480 500 520 540 560 580 600 % maximum % maximum aequorin protein medusa egg bioluminescence egg medusa aequorin clytin2 500 /470 nm emission 10 8 6 4 2 0 egg gonad ectoderm manubrium tentacle bulb 40 60 80 100 20 0 (a) (b) (c) wavelength (nm) fluorescence (excitation light 488 nm)
Figure 5. Endogenous luminescence coupling. (a) Fluorescence emission spectra for the four GFPs expressed in their endogenous tissues, collected using a Leica SP5
confocal microscope using 488 nm excitation. (b) Luminescence spectra obtained for recombined and Ca
2þ-stimulated aequorin compared to a group of eggs and an
individual whole adult medusa following detergent stimulation [29]. Multiple spectra obtained from several individual medusae showed very little variation.
Aequorin was used in this experiment rather than clytin because it was more easily available but has a very similar emission spectrum [9,15]. (c) Light emission
ratios (500/470 nm) from recombined and Ca
2þ-stimulated aequorin or clytin2 protein was compared to those from eggs or medusae that had been preloaded with
coelenterazine and then lysed with Triton to induce Ca
2þ-dependent luminescence. An average ratio from measurements made on six individual medusae is shown.
rsob.r
oy
alsocietypublishing.org
Open
Biol.
4:
130206
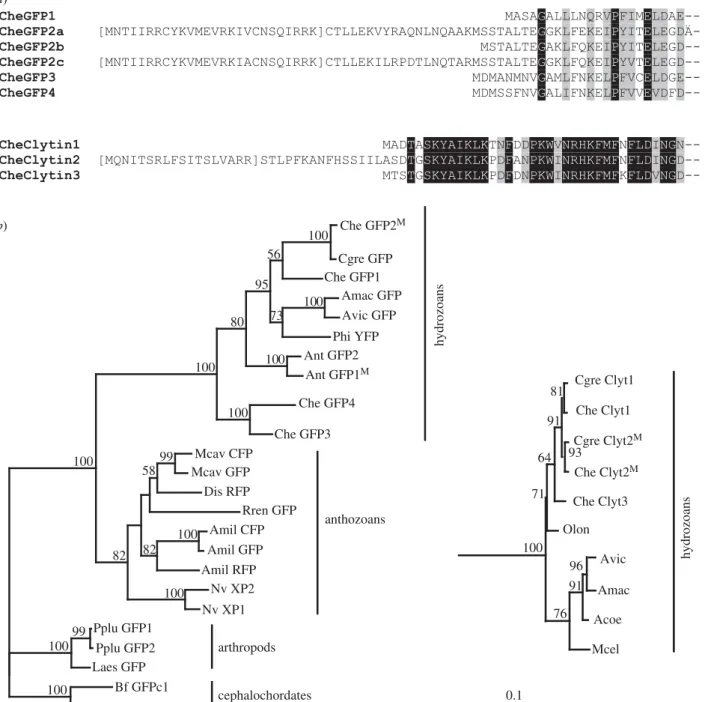
6studies strongly suggest that GFP2 and clytin2 function together as a closely linked pair in mitochondria, and may have coevolved during expansion of their respective gene families. To address how this unusual situation for two unrelated genes arose during evolution, we performed phylo-genetic analysis of available predicted protein sequences for the two families. GFP genes have been detected in a disparate selection of animals across many phyla, suggesting a com-plex evolutionary history [35,36]. Duplications have arisen separately within various evolutionary lineages, including copepods and cephalochordates [37,38] as well as in anthozoan and hydrozoan cnidarians. Our phylogenetic analyses showed that within the Hydrozoa, a first duplication probably separ-ated the CheGFP 3 þ 4 from the CheGFP 1 þ 2 lineages, to which most of the other identified hydrozoan GFP sequences belong (figure 7b; sequence alignments in the electronic sup-plementary material, figure S1). By contrast, the clytins are clearly part of a well-defined monophyletic and phylogeneti-cally restricted group of photoproteins, whose sequence evolution mirrors the relations between hydrozoan families. Aequorin/clytin family proteins are thought to have emerged in a common metazoan ancestor, these genes and/or their bio-luminescence function having probably subsequently been lost in the bilaterian, anthozoan and sponge lineages [13].
Searches for mitochondrial targeting predictions among publically available FP and photoprotein sequences revealed a convincing leader in a GFP protein from an undefined hydro-zoan jellyfish species (AntGFP1) and in CheGFP2, as well and in C. hemisphaerica and C. gregarium clytin2 (marked M in figure 7b), but not in any other known GFP or aequorin family proteins. Mitochondrial targeting of both families thus appears restricted to the hydrozoans. More widespread occur-rence of mitochondrial targeting cannot be ruled out without more comprehensive genomic or transcriptomic data from a greater number of species, but mitochondrial targeting of
both families appears to be restricted to the hydrozoans and to have arisen together within this group.
4. Discussion
We have undertaken the first systematic study of the deploy-ment of fluorescence and bioluminescence genes in a cnidarian. We have shown that in C. hemisphaerica fluorescence and bioluminescence associate with distinct structures and life-cycle stages and that this results from differential expression of multiple GFP and aequorin family photoprotein genes. We propose that gene family expansion and differential expression of the paralogues allowed the acquisition of multiple functions for bioluminescence and fluorescence during hydrozoan evolution. Our findings demonstrate that in an endogenous context the GFP and aequorin proteins can function either sep-arately or in a physiologically coupled manner. The green bioluminescence emitted from C. hemisphaerica eggs almost certainly results from effective BRET coupling between the maternally expressed clytin2–GFP2 protein pair. These two proteins are co-targeted to mitochondria through parallel acquisition during the evolution of N-terminal tags to their protein sequences. Below, we discuss possible explanations and implications for these findings.
4.1. Differential deployment of GFPs and photoproteins
in Clytia
The striking differential expression of the four GFP genes in Clytia suggests that expansion of this gene family in the hydro-zoan lineage was linked to region- and/or stage-specific regulation of expression of the paralogues. This may reflect acquisition of different functions as suggested in the cephalo-chordates [37] and in the sea anemone (anthozoan cnidarian)
GFP GFP GFP (a) (b) (c) Mitotracker Merge bioluminescence Mitotracker (iii) (ii) (i) (iii) (ii) (i) (ii) (i)
Figure 6. Clytia GFP2 and clytin2 are targeted to egg mitochondria. (a) Confocal images of eggs labelled with Mitotracker Deep Red. (a(i)) GFP fluorescence, (a(ii))
Mitotracker, (a(iii)) merge. (b) Stratified eggs comparing GFP versus Mitotracker orange distribution. (b(i)) Brightfield, (b(ii)) GFP fluorescence, (b(iii)) Mitotracker
orange. (c) Stratified eggs comparing green fluorescence (c(i)) and Triton lysis-induced luminescence (c(ii)). All scale bars 100
mm.
rsob.r
oy
alsocietypublishing.org
Open
Biol.
4:
130206
7Nematostella vectensis [39]. In the coral Seriatopora hystrix, GFP and cyan fluorescent protein are expressed at different life-cycle stages [40]. Differential expression of FPs has also been observed in the hydrozoan Obelia, where yellow, green and cyan fluor-escence occur in distinct medusa areas. As we found in Clytia, these areas of fluorescence are much more extensive than the bioluminescent photocytes positioned around the bell rim.
What adaptive advantages might have driven this diversi-fication of expression sites and probably of function in the GFPs and clytins? Bioluminescence appears to have arisen independently at least 40 times during evolution, and there is
evidence for a variety of roles, for instance in predation, defence and counter-illumination [2]. Light flashes in Clytia tentacle bulbs and tentacles seem ideally placed to lure prey. In eggs and early embryos, the other principal bioluminescence sites in Clytia, possible roles include distracting predators and camouflage, since Clytia species come to the surface at dawn (as we observe in C. hemisphaerica) and/or dusk to spawn. Light sparks induced by sporadic external calcium entry and the cytoplasmic calcium increase triggered at fertilization [41] might help disguise the eggs from upward-looking predators, against a twinkling water surface. In a survey of 21 hydrozoan Che GFP2M Cgre GFP 100 Che GFP1 56 Amac GFP Avic GFP 100 Phi YFP 73 95 Ant GFP2 Ant GFP1M 100 80 Che GFP4 Che GFP3 100 100 Mcav CFP Mcav GFP 99 Dis RFP 58 Rren GFP Amil CFP Amil GFP 100 Amil RFP 82 Nv XP2 Nv XP1 100 82 100 Pplu GFP1 Pplu GFP2 99 Laes GFP 100 Bf GFPc1 Bf GFPa4 100 anthozoans arthropods cephalochordates hydrozoans Cgre Clyt1 Che Clyt1 Cgre Clyt2M Che Clyt2M Che Clyt3 Olon Avic Amac Acoe Mcel 0.1 81 93 91 64 71 96 91 76 100 hydrozoans (a) (b)
Figure 7. Diversification of GFP and clytin genes. (a) Amino acid alignments of the N terminus of deduced Clytia GFP and clytin protein sequences. GFP2a, GFP2c
and clytin2 sequences show an N terminal presequence, predicted with high probability to mediate targeting to mitochondria (M
ITOPROTsoftware). Predicted cleaved
sequences are shown in brackets. Black shading: identical amino acids; grey shading, similar amino acids. (b) Phylogenetic relationships of representative cnidarian
GFP and clytin genes, deduced by ML from the alignments provided in the electronic supplementary material, figure S1. Sequences of arthropod and
cephalochor-date GFPs were used as an out-group for the GFPs tree (a), and sequences of calmodulin protein were used as an out-group for the clytin tree (b). Superscript M
indicates the presence of a predicted mitochondrial targeting sequence. Bootstrap percentages (500 replicates) over 50% are shown. The scale bar indicates the
number of amino acid substitutions per site. Acoe, Aequorea coerulescens; Amac, Aequorea macrodactyla; Avic, Aequorea Victoria; Amil, Acropora millepora; Ant,
Anthomedusae species; Bf, Branchiostoma floridae; Cgra, Clytia gracilis; Cgre, Clytia gregarium; Che, Clytia hemisphaerica; Dis, Discosoma species; Laes, Labidocera
aestiva; Mcav, Montastraea cavernosa; Mcel, Mitrocoma cellularia; Nv, Nematostella vectensis; Olon, Obelia longissima; Phy, Phialidium species; Pplu, Pontellina
plu-mata; Rren, Renilla reniformis. Sequence accession numbers are given in the electronic supplementary material, table S2.
rsob.r
oy
alsocietypublishing.org
Open
Biol.
4:
130206
8species, only four had bioluminescent eggs while eight showed bioluminescence in the medusa [22]. The adaptive advantage of bioluminescence in eggs may relate to the timing and depth at which spawning occurs, factors that vary widely between closely related species consistent with a scenario of rapid evolution.
The weak bioluminescence in the vital but relatively opaque gonad and mouth regions could also serve a camou-flaging role when the medusae come to the surface to spawn. Another possible role for bioluminescence is prey distraction: in Euphysa medusa, bioluminescent flashes from the bell endoderm are associated with a protective inversion behav-iour when under predator attack [42], which may occur to a less dramatic extent in Clytia.
Studies in non-bioluminescent animals such as corals have provided evidence that GFPs without photoprotein partners can confer photoprotection and/or contribute to physiological responses to algal symbionts [43–45]. A possible role for GFP in the manubrium could thus be to provide protection from oxidative stress [46] resulting from contact with and diges-tion of prey. It has been suggested that GFPs could confer protection against UV radiation by transforming absorbed radiation to higher wavelength/less energetic fluorescence [43]. CheGFP1 and CheGFP4 expression in the gonad ectoderm and in the larval ectoderm are well placed to play such a ‘sun-screen’ role. Both these cell layers enclose proliferating cell populations [47] and germ cell precursors vulnerable to UV damage during surface spawning, embryo development and early larval life, which occur close to the sea surface.
GFP2 in the Clytia egg and early embryo may also be photoprotective, more specifically for maternal mito-chondrial DNA. While eggs and larvae of other animals including cephalochordates and corals also express GFPs [36,48], C. gregarium eggs and somatic gonad cells are cur-iously bioluminescent but not fluorescent [22]. Reduced fluorescence compared with C. hemisphaerica may reflect lower exposure to sunlight due to behavioural and/or environmental differences.
4.2. Physiological bioluminescence resonance energy
transfer in egg mitochondria
In various hydrozoans, it has been inferred that aequorin/ clytin family photoproteins and GFP cooperate in BRET. BRET from aequorins to GFP not only shifts the spectrum of light emission but can increase the bioluminescent reaction yield [49]. In Clytia medusae, both coexpression and spectral coupling are largely incomplete, but in eggs we were able to demonstrate near-perfect BRET between clytin2 and GFP2 such that the bioluminescence and fluorescence emission spectra closely matched. This was accompanied by co-target-ing of the two proteins to mitochondria. A number of hypotheses can be advanced concerning the significance of this novel and highly intriguing finding. One is that mito-chondrial targeting promotes effective bioluminescence at relatively low protein levels by co-compartmentalization, facilitating localized maintenance of both proteins to the micromolar concentrations required for BRET via their transi-ent electrostatic association [10,50]. The second possibility is that mitochondrial localization may increase the intensity and duration of light emission; clytin, as an aequorin family member, is likely to have a light output proportional
to at least the square of the Ca2þconcentration. In
mitochon-dria, the free Ca2þconcentration during stimulation reaches a
much higher level than that in the cytosol and the Ca2þ
response may last much longer [51].
Whichever factor provided the evolutionary drive for bio-luminescence of Clytia eggs, it is conceivable that GFP accumulation in egg mitochondria arose first, owing to reactive oxygen species (ROS) scavenging and/or UV photoprotection capacities (see above), and that the co-targeting of clytin was secondary. Importing GFP to egg mitochondria may be advan-tageous to protect maternal mitochondrial DNA from UV damage when the spawned eggs are at the sea surface or from ROS produced significantly in mitochondria [52]. GFP also has the potential to enhance mitochondrial-specific reac-tions such as proton pumping of the respiratory chain [53], raising interesting parallels between a possible role for GFP in mitochondria and that of the plant pigment chlorophylls in chloroplastids. It should be noted that egg bioluminescence does not necessarily involve BRET to GFP; C. gregarium [22] and Mnemiopsis leidyi eggs show blue bioluminescence but no green fluorescence [6,12]. Mnemiopsis does not contain GFP, but extensive gene duplication has generated at least 10 highly similar photoprotein genes in tandem clusters, hypoth-esized to favour high protein synthesis levels in the specialized photocyte cells of the adult [13], but also potentially in the egg. Whether C. gregarium egg clytin is mitochondrially targeted merits reinvestigation. Low-speed centrifugation did not stratify the bioluminescence of C. gregarium [22], however the mitochondrial distribution may not have been affected in the experimental conditions used. The available C. gregarium clytin2 cDNA sequence does carry a mitochondrial targeting sequence, but alternative transcript forms may exist as they do in C. hemisphaerica. The apparent rareness of mitochondrial targeted GFPs and aequorins within the hydrozoans matches the patchy occurrence of egg bioluminescence.
The deployment of GFP and clytin/aequorin photoprotein families is very diverse among cnidarians and ctenophores. During evolution and species diversification, these molecules have acquired various biochemical properties leading not only to a wide range of colour spectra useful for scientists but probably also to a range of physiological functions. Our obser-vations suggest that the highly complex pattern of fluorescence and bioluminescence resulting from differential GFP and clytin gene expression in C. hemisphaerica reflects specialization for different roles within a single animal following gene diversifica-tion during hydrozoan evoludiversifica-tion. The novel coupled expression and mitochondrial targeting of GFP and clytin in the egg pro-vides a striking case of protein coevolution, which merits further examination in the future.
5. Material and methods
5.1. Animals
All the Clytia hemisphaerica used in this study were obtained from our laboratory cultures, raised entirely on Artemia larvae throughout the life cycle [23].
5.2. Luminescence detection
Clytia eggs or whole medusae were pre-incubated in 20 mM f-coelenterazine [54] in seawater for about 3 h. Eggs loaded
rsob.r
oy
alsocietypublishing.org
Open
Biol.
4:
130206
9with coelenterazine were mounted in seawater on a Zeiss Axiovert S100 microscope equipped with a cooled intensified CCD camera (Photek Ltd) to image luminescence. Low-level fluorescence was imaged upon excitation from a halogen lamp using the same camera using standard FITC filters or a Nikon TiU epifluorescence microscope and Photometrics HQ2CCD camera.
For light quantification, groups of 30–50 eggs in 0.9 ml of seawater in a plastic tube were positioned inside a custom-made dual wavelength luminometer composed of two photon counting module-based photomultiplier tubes (ET Enterprises Ltd) held at right angles to each other. Each tube had either a 470 nm or 500 nm interference filter with a 10 nm bandwidth (Thorlabs Ltd) placed between the test tube and the photomultiplier. Light emission at each wave-length was integrated for 1–10 min after stimulating the eggs by adding 100 ml of seawater containing 1% Triton X-100. Purified clytin and aequorin photoproteins were diluted into 0.9 ml of KCl (120 mM), Hepes (20 mM), EGTA (100 mM) buffer and emission was stimulated by the addition of 100 ml of 10 mM CaCl2. Clytin2 protein was expressed in a TNT
SP6 wheat germ extract system (Promega) from a cDNA clone in Express 1 vector and recombined with 10 mM coelen-terazine in the TNT reaction buffer þ 1 mM EGTA for 20 h before assays. Purified aequorin protein (regenerated with coelenterazine) was a kind gift of Dr O. Shimomura.
5.3. Microscopy and fluorescence emission spectra
determination
In situ hybridization was performed as previously [28]. Mito-chondria were labelled in live cells by incubation for 5–30 min in 0.1 mM TMRE (tetra-methylrhodamine ethyl ester; Invitro-gen) or Mitotracker Deep Red 633 (Molecular Probes) in 0.2 mm Millipore-filtered seawater. Fluorescence emission spec-tra of Clytia tissues and life-cycle stages were obtained without coelenterazine pre-incubation using a Leica SP5 confocal micro-scope. Measurements were performed on live adult medusae or eggs mounted between slide and coverslip in seawater. These were excited with a 488 nm argon laser line and images acquired at successive 3 nm spaced, 5 nm wide bands between 475 and 625 nm using the xyl scanning mode. Quantification was then performed on several ‘regions of interest’ defined to sample par-ticular structures: manubrium, bell, tentacle bulb, gonad ectoderm and eggs. Data were acquired from multiple regions of two separate medusae with similar spectra obtained for each tissue. Additional fluorescence images were obtained using an Olympus epifluorescence microscope.
5.4. Clytia hemisphaerica green fluorescent protein
and clytin sequences
Clytia hemisphaerica cDNA clones containing complete ORFs were retrieved from a mixed-stage cDNA library following identification from our EST collection. For phylogenetic analy-sis, selected sequences were aligned using CLUSTALW in BIOEDIT
and corrected by eye. Maximum-likelihood (ML) analysis was performed using PHYML, as described previously [55]. GFP
sequences from Arthopoda and Cephalochordata were used as out-groups for the GFP tree, and calcium-binding domain of calmodulin sequences for the aequorin one.
5.5. RNA isolation, reverse transcription
and quantitative PCR
Eggs, oocytes, planula larvae and tissue samples dissected from adult female medusae were collected in Millipore-filtered sea-water. Total RNA was isolated using the RNAqueous-Micro system (Ambion), treated with DNase (Ambion) for 30 min at 378C and stored at 2208C. Reverse transcription was performed using the Super Script VILO cDNA Synthesis Kit (Invitrogen). Q-PCR was performed using primer pairs designed to amplify 150–250 bp fragments specific for each GFP and clytin sequence (electronic supplementary material, table S1). Primer specificity was confirmed by PCR on the set of cloned cDNA sequences. An EF1a fragment was amplified in parallel as a measure of tissue quantity [47]. Q-PCR reactions were run in triplicate on cDNA from two independent tissue prep-arations using the LightCycler480 (Roche) and the 22DDCt method was used to evaluate relative expression of each gene.
Acknowledgements. We thank our colleagues, especially R. Dumollard, A. McDougall, S. Chevalier, P. Lape´bie, T. Momose, C. Barreau, M. Manuel, as well as M. Whittaker (Newcastle, UK) for useful advice and comments, and L. Lecle`re and P. Dru for help with phylo-genetic analyses. We also thank C. Rouvie`re for help with imaging and A. Amiel for figure 1a.
Data accessibility.GenBank accession numbers are given in the electronic supplementary material, table S2, which also lists the protein sequences retrieved by BLAST searches of publicly available protein datasets used in phylogenetic analysis.
Phylogenetic data: Alignment in ECM figure 1, Phylogenetic tree in figure 7b.
Funding statement.Funding to E.H. was provided by the CNRS and the ANR grant ‘DiploDevo’ (coordinator M. Manuel), and an MRT stu-dentship and ARC funding to C.F. K.S. was supported by a Royal Society International Joint Project. EST sequencing was performed by the Genoscope Evry (France).
References
1. Herring PJ. 1990 Bioluminescent communication in the sea. In Light and life in the sea (eds PJ Herring, AK Campbell, M Whitfield, L Maddock), pp. 245 – 264. Cambridge, UK: Cambridge University Press. 2. Haddock SHD, Moline MA, Case JF. 2010
Bioluminescence in the sea. Annu. Rev. Mar. Sci. 2, 443 – 493. (doi:10.1146/annurev-marine-120308-081028)
3. Widder EA. 2010 Bioluminescence in the ocean: origins of biological, chemical, and ecological
diversity. Science 328, 704 – 708. (doi:10.1126/ science.1174269)
4. Kendall JM, Badminton MN. 1998 Aequorea victoria bioluminescence moves into an exciting new era. Trends Biotechnol. 16, 216 – 224. (doi:10.1016/ S0167-7799(98)01184-6)
5. Shimomura O. 2006 The photoproteins. In Photoproteins in bioanalysis (eds S Daunert, SK Deo), pp. 1 – 23. Weinheim, Germany: Wiley-VCH Verlag GmbH & Co.
6. Waud JP, Bermu´dez Fajardo A, Sudhaharan T, Trimby AR, Jeffery J, Jones A, Campbell AK. 2001 Measurement of proteases using chemiluminescence-resonance-energy-transfer chimaeras between green fluorescent protein and aequorin. Biochem. J. 357, 687 – 697. (doi:10.1042/ 0264-6021:3570687)
7. Morin JG, Hastings JW. 1971 Energy transfer in a bioluminescent system. J. Cell. Physiol. 77, 313 – 318. (doi:10.1002/jcp.1040770305)
rsob.r
oy
alsocietypublishing.org
Open
Biol.
4:
130206
108. Morise H, Shimomura O, Johnson FH, Winant J. 1974 Intermolecular energy transfer in the bioluminescent system of Aequorea. Biochemistry 13, 2656 – 2662. (doi:10.1021/bi00709a028) 9. Markova SV, Burakova LP, Frank LA, Golz S,
Korostileva KA, Vysotski ES. 2010 Green-fluorescent protein from the bioluminescent jellyfish Clytia gregaria: cDNA cloning, expression, and characterization of novel recombinant protein. Photochem. Photobiol. Sci. 9, 757 – 765. (doi:10. 1039/c0pp00023j)
10. Titushin MS, Feng Y, Lee J, Vysotski ES, Liu Z-J. 2012 Protein – protein complexation in
bioluminescence. Protein Cell 2, 957 – 972. (doi:10. 1007/s13238-011-1118-y)
11. Campbell AK. 2012 Darwin shines light on the evolution of bioluminescence. Luminescence 27, 447 – 449. (doi:10.1002/bio.2429)
12. Vassel N, Cox CD, Naseem R, Morse V, Evans RT, Power RL, Brancale A, Wann KT, Campbell AK. 2012 Enzymatic activity of albumin shown by coelenterazine chemiluminescence. Luminescence 27, 234 – 241. (doi:10.1002/bio.2357) 13. Schnitzler CE et al. 2012 Genomic organization,
evolution, and expression of photoprotein and opsin genes in Mnemiopsis leidyi: a new view of ctenophore photocytes. BMC Biol. 10, 107. (doi:10. 1186/1741-7007-10-107)
14. Levine LD, Ward WW. 1982 Isolation and characterization of a photoprotein, ‘phialidin’, and a spectrally unique green-fluorescent protein from the bioluminescent jellyfish Phialidium gregarium. Comp. Biochem. Physiol. Part B Comp. Biochem. 72, 77 – 85. (doi:10.1016/0305-0491(82)90013-X) 15. Inouye S. 2008 Cloning, expression, purification
and characterization of an isotype of Clytin, a calcium-binding photoprotein from the luminous hydromedusa Clytia gregarium. J. Biochem. 143, 711 – 717. (doi:10.1093/jb/mvn024)
16. Shimomura O. 1985 Bioluminescence in the sea: photoprotein systems. Symp. Soc. Exp. Biol. 39, 351 – 372.
17. Aglyamova GV, Hunt ME, Modi CK, Matz MV. 2011 Multi-colored homologs of the green fluorescent protein from hydromedusa Obelia sp. Photochem. Photobiol. Sci. 10, 1303. (doi:10.1039/c1pp05068k) 18. Pakhomov AA, Martynov VI. 2011 Probing the
structural determinants of yellow fluorescence of a protein from Phialidium sp. Biochem. Biophys. Res. Commun. 407, 230 – 235. (doi:10.1016/j.bbrc.2011. 03.004)
19. Titushin MS et al. 2010 NMR-derived topology of a GFP-photoprotein energy transfer complex. J. Biol. Chem. 285, 40 891 – 40 900. (doi:10.1074/jbc. M110.133843)
20. Harvey EN. 1921 Studies on bioluminescence. Biol. Bull. 41, 280 – 287. (doi:10.2307/1536528) 21. Davenport D, Nicol JAC. 1955 Luminescence in
Hydromedusae. Proc. R. Soc. Lond. B 144, 399 – 411. (doi:10.1098/rspb.1955.0066)
22. Freeman G, Ridgway EB. 1987 Endogenous photoproteins, calcium channels and calcium transients during metamorphosis in hydrozoans.
Dev. Genes Evol. 196, 30 – 50. (doi:10.1007/ BF00376020)
23. Houliston E, Momose T, Manuel M. 2010 Clytia hemisphaerica: a jellyfish cousin joins the laboratory. Trends Genet. 26, 159 – 167. (doi:10. 1016/j.tig.2010.01.008)
24. Ridgway EB, Freeman G. 1999 Calcium fluxes in hydrozoan embryos depend, in part, on exocytosis and fluid phase endocytosis. Cell Calcium 25, 179 – 189. (doi:10.1054/ceca.1998.0020) 25. Haddock SH, Rivers TJ, Robison BH. 2001 Can
coelenterates make coelenterazine? Dietary requirement for luciferin in cnidarian bioluminescence. Proc. Natl Acad. Sci. USA 98, 11 148 – 11 151. (doi:10.1073/pnas.201329798) 26. Thompson CM, Herring PJ, Campbell AK. 1995
Evidence for de novo biosynthesis of coelenterazine in the bioluminescent midwater shrimp Systellapsis debilis. J. Mar. biol. Assoc. UK 75, 165 – 171. (doi:10.1017/S0025315400015277)
27. Morin JG, Reynolds GT. 1974 The cellular origin of bioluminescence in the colonial hydroid Obelia. Biol. Bull. 147, 397 – 410. (doi:10.2307/1540457) 28. Chevalier S, Martin A, Lecle`re L, Amiel A, Houliston
E. 2006 Polarised expression of FoxB and FoxQ2 genes during development of the hydrozoan Clytia hemisphaerica. Dev. Genes Evol. 216, 709 – 720. (doi:10.1007/s00427-006-0103-6)
29. Baubet V, Le Mouellic H, Campbell AK, Lucas-Meunier E, Fossier P, Bruˆlet P. 2000 Chimeric green fluorescent protein-aequorin as bioluminescent Ca2þreporters at the single-cell level. Proc. Natl Acad. Sci. USA 97, 7260 – 7265. (doi:10.1073/pnas.97.13.7260) 30. Fourrage C, Chevalier S, Houliston E. 2010 A highly
conserved Poc1 protein characterized in embryos of the hydrozoan Clytia hemisphaerica: localization and functional studies. PLoS ONE 5, e13994. (doi:10.1371/journal.pone.0013994)
31. Claros MG, Vincens P. 1996 Computational method to predict mitochondrially imported proteins and their targeting sequences. Eur. J. Biochem. 241, 779 – 786. (doi:10.1111/j.1432-1033.1996.00779.x) 32. Bannai H, Tamada Y, Maruyama O, Nakai K, Miyano
S. 2002 Extensive feature detection of N-terminal protein sorting signals. Bioinformatics 18, 298 – 305. (doi:10.1093/bioinformatics/18.2.298)
33. Anderson JM, Cormier MJ. 1973 Lumisomes, the cellular site of bioluminescence in coelenterates. J. Biol. Chem. 248, 2937 – 2943.
34. Germain G, Anctil M. 1988 Luminescent activity and ultrastructural characterization of photocytes dissociated from the coelenterate Renilla ko¨llikeri. Tissue Cell 20, 701 – 720. (doi:10.1016/0040-8166(88)90017-1)
35. Shagin DA. 2004 GFP-like proteins as ubiquitous metazoan superfamily: evolution of functional features and structural complexity. Mol. Biol. Evol. 21, 841 – 850. (doi:10.1093/molbev/msh079) 36. Deheyn DD, Kubokawa K, McCarthy JK, Murakami A,
Porrachia M, Rouse GW, Holland ND. 2007 Endogenous green fluorescent protein (GFP) in amphioxus. Biol. Bull. 213, 95 – 100. (doi:10.2307/ 25066625)
37. Li G, Zhang Q-J, Zhong J, Wang Y-Q. 2009 Evolutionary and functional diversity of green fluorescent proteins in cephalochordates. Gene 446, 41 – 49. (doi:10.1016/j.gene.2009.07.003) 38. Bomati EK, Manning G, Deheyn DD. 2009
Amphioxus encodes the largest known family of green fluorescent proteins, which have diversified into distinct functional classes. BMC Evol. Biol. 9, 77. (doi:10.1186/1471-2148-9-77)
39. Ikmi A, Gibson MC. 2010 Identification and in vivo characterization of nvfp-7r, a developmentally regulated red fluorescent protein of Nematostella vectensis. PLoS ONE 5, e11807. (doi:10.1371/journal. pone.0011807)
40. Roth MS, Fan T-Y, Deheyn DD. 2013 Life history changes in coral fluorescence and the effects of light intensity on larval physiology and settlement in Seriatopora hystrix. PLoS ONE 8, e59476. (doi:10. 1371/journal.pone.0059476)
41. Freeman G, Ridgway EB. 1993 The role of intracellular calcium and pH during fertilization and egg activation in the hydrozoan Phialidium. Dev. Biol. 156, 176 – 190. (doi:10.1006/dbio.1993.1068) 42. Mackie GO. 1991 Propagation of bioluminescence in Euphysa japonica hydraomedusae, (Tubulariidae). Hydrobiologia 216/217, 581– 588. (doi:10.1007/ BF00026516)
43. Salih A, Larkum A, Cox G, Ku¨hl M, Hoegh-Guldberg O. 2000 Fluorescent pigments in corals are photoprotective. Nature 408, 850 – 853. (doi:10. 1038/35048564)
44. D’Angelo C, Denzel A, Vogt A, Matz MV, Oswald F, Salih A, Nienhaus GU, Wiedenmann J. 2008 Blue light regulation of host pigment in reef-building corals. Mar. Ecol. Prog. Ser. 364, 97 – 106. (doi:10. 3354/meps07588)
45. Roth MS, Latz MI, Goericke R, Deheyn DD. 2010 Green fluorescent protein regulation in the coral Acropora yongei during photoacclimation. J. Exp. Biol. 213, 3644 – 3655. (doi:10.1242/ jeb.040881)
46. Bou-Abdallah F, Chasteen ND, Lesser MP. 2006 Quenching of superoxide radicals by green fluorescent protein. Biochim. Biophys. Acta 1760, 1690 – 1695. (doi:10.1016/j.bbagen.2006.08.014) 47. Lecle`re L, Jager M, Barreau C, Chang P, Le Guyader
H, Manuel M, Houliston E. 2012 Maternally localized germ plasm mRNAs and germ cell/stem cell formation in the cnidarian Clytia. Dev. Biol. 364, 236 – 248. (doi:10.1016/j.ydbio.2012.01.018) 48. Leutenegger A, D’Angelo C, Matz MV, Denzel A,
Oswald F, Salih A, Nienhaus GU, Wiedenmann J. 2011 Fluorescence of coral larvae predicts their settlement response to crustose coralline algae and reflects stress. Proc. R. Soc. B 278, 2691 – 2697. (doi:10.1111/j.1742-4658.2007.05785.x) 49. Ward WW, Cormier MJ. 1979 An energy transfer
protein in coelenterate bioluminescence. Characterization of the Renilla green-fluorescent protein. J. Biol. Chem. 254, 781 – 788. 50. Malikova NP, Visser NV, van Hoek A, Skakun VV,
Vysotski ES, Lee J, Visser AJWG. 2011 Green-fluorescent protein from the bioluminescent jellyfish
rsob.r
oy
alsocietypublishing.org
Open
Biol.
4:
130206
11Clytia gregariais is an obligate dimer and does not form a stable complex with the Ca2þ-discharged photoprotein Clytin. Biochemistry 50, 4232 – 4241. (doi:10.1021/bi101671p)
51. Vay L, Herna´ndez-SanMiguel E, Lobato´n CD, Moreno A, Montero M, Alvarez J. 2009 Mitochondrial free Ca2þ levels and the permeability transition. Cell Calcium 45, 243–250. (doi:10.1016/j.ceca.2008.10.007)
52. Navarro A, Boveris A. 2007 The mitochondrial energy transduction system and the aging process. Am. J. Physiol. Cell
Physiol. 292, C670 – 686. (doi:10.1152/ajpcell. 00213.2006)
53. Agmon N. 2005 Proton pathways in green fluorescence protein. Biophys. J. 88, 2452 – 2461. (doi:10.1529/biophysj.104.055541)
54. Shimomura O. 1997 Membrane permeability of coelenterazine analogues measured with fish eggs. Biochem. J. 326, 297 – 298.
55. Amiel A, Lecle`re L, Robert L, Chevalier S, Houliston E. 2009 Conserved functions for Mos in eumetazoan oocyte maturation revealed by studies in a cnidarian. Curr. Biol. 19, 305 – 311. (doi:10.1016/j. cub.2008.12.054)