HAL Id: hal-00301352
https://hal.archives-ouvertes.fr/hal-00301352
Submitted on 30 Jul 2004HAL is a multi-disciplinary open access
archive for the deposit and dissemination of sci-entific research documents, whether they are pub-lished or not. The documents may come from teaching and research institutions in France or abroad, or from public or private research centers.
L’archive ouverte pluridisciplinaire HAL, est destinée au dépôt et à la diffusion de documents scientifiques de niveau recherche, publiés ou non, émanant des établissements d’enseignement et de recherche français ou étrangers, des laboratoires publics ou privés.
Alpha-pinene oxidation by OH: simulations of
laboratory experiments
M. Capouet, J. Peeters, B. Nozière, J.-F. Müller
To cite this version:
M. Capouet, J. Peeters, B. Nozière, J.-F. Müller. Alpha-pinene oxidation by OH: simulations of lab-oratory experiments. Atmospheric Chemistry and Physics Discussions, European Geosciences Union, 2004, 4 (4), pp.4039-4103. �hal-00301352�
ACPD
4, 4039–4103, 2004 α-pinene oxidation by OH M. Capouet et al. Title Page Abstract Introduction Conclusions References Tables Figures J I J I Back CloseFull Screen / Esc
Print Version Interactive Discussion
© EGU 2004
Atmos. Chem. Phys. Discuss., 4, 4039–4103, 2004 www.atmos-chem-phys.org/acpd/4/4039/
SRef-ID: 1680-7375/acpd/2004-4-4039 © European Geosciences Union 2004
Atmospheric Chemistry and Physics Discussions
Alpha-pinene oxidation by OH:
simulations of laboratory experiments
M. Capouet1, J. Peeters2, B. Nozi `ere3, and J.-F. M ¨uller1
1
Belgian Institute for Space Aeronomy, Brussels, Belgium
2
Department of Chemistry, University of Leuven, Leuven, Belgium
3
Rosenstiel School For Marine and Atmospheric Science, University of Miami, Miami, USA Received: 4 May 2004 – Accepted: 24 June 2004 – Published: 30 July 2004
Correspondence to: M. Capouet ([email protected])
ACPD
4, 4039–4103, 2004 α-pinene oxidation by OH M. Capouet et al. Title Page Abstract Introduction Conclusions References Tables Figures J I J I Back CloseFull Screen / Esc
Print Version Interactive Discussion
© EGU 2004 Abstract
This paper presents a state-of-the-art gas-phase mechanism for the degradation of α-pinene by OH and its validation by box model simulations of laboratory measurements. It is based on the near-explicit mechanisms for the oxidation of α-pinene and pinon-aldehyde by OH proposed by Peeters and co-workers. The extensive set of α-pinene 5
photooxidation experiments performed in presence as well as in absence of NO by
Nozi `ere et al.(1999a) is used to test the mechanism. The comparison of the calcu-lated vs measured concentrations as a function of time shows that the levels of OH, NO, NO2and light are well reproduced in the model. Noting the large scatter in the experi-mental results as well as the difficulty to retrieve true product yields from concentrations 10
data, a methodology is proposed for comparing the model and the data. The model succeeds in reproducing the average apparent yields of pinonaldehyde, acetone, total nitrates and total PANs in the experiments performed in presence of NO. In absence of NO, pinonaldehyde is fairly well reproduced, but acetone is largely underestimated.
The dependence of the product yields on the concentration of NO and α-pinene is in-15
vestigated, with a special attention on the influence of the multiple competitions of reac-tions affecting the peroxy radicals in the mechanism. We show that the main oxidation channels differ largely according to photochemical conditions. E.g. the pinonaldehyde yield is estimated to be about 10% in the remote atmosphere and up to 60% in very polluted areas. We stress the need for additional theoretical/laboratory work to unravel 20
the chemistry of the primary products as well as the ozonolysis and nitrate-initiated oxidation of α-pinene.
1. Introduction
The emissions of nonmethane organic compounds (NMOCs) released by the vegeta-tion into the atmosphere are substantial, on the order of 1150 Tg carbon yr−1 world-25
ACPD
4, 4039–4103, 2004 α-pinene oxidation by OH M. Capouet et al. Title Page Abstract Introduction Conclusions References Tables Figures J I J I Back CloseFull Screen / Esc
Print Version Interactive Discussion
© EGU 2004
sesquiterpenes, and oxygenated hydrocarbons (K ¨onig et al.,1995;Kesselmeier et al.,
1997) are mostly unsaturated, and they are therefore highly reactive towards ozone, OH and NO3 radicals. Their lifetimes under tropospheric conditions are calculated to range from a few minutes to a few hours (Atkinson,2000). Their oxidation in the atmo-sphere has multiple impacts in both the gas and aerosol phases, in particular on the 5
budget of tropospheric ozone, on the oxidizing capacity of the atmosphere and on the production of organic aerosols (IPCC,2001). Since these biogenic emissions are con-trolled by temperature and light, they can be expected to change, and most probably to increase, in the future as a result of climate change (European Commission,2003). Monoterpenes are important constituents of biogenic NMOC emissions. Although 10
they account for 10–15% of the total biogenic NMOCs emissions worldwide (Guenther
et al.,2000), they are still comparable in magnitude to the total anthropogenic NMOC emissions. Their atmospheric oxidation is an important source of acetone (Jacob et al.,
2002), which has been shown to be an important actor in upper tropospheric chemistry (e.g. M ¨uller and Brasseur, 1999).
15
Furthermore, their degradation yields low volatility compounds which readily form organic secondary aerosols (SOA). Recent estimates of the global aerosol production from biogenic precursors (mostly terpenes) are in the range 2.5–79 Tgyr−1(Kanakidou
et al.,2000;Griffin et al.,1999;Tsigaridis and Kanakidou,2003). This production might be influenced by human activities, e.g. through the impact of anthropogenic emissions 20
on the levels of the terpene oxidants, or on the organic aerosol concentration (e.g. Kanakidou et al., 2000).
Amongst the monoterpenes, α-pinene is observed to have the highest emission rates and to be the most abundant (e.g. Rinne et al., 2000). Several experimental studies have investigated the formation of gas-phase products from its oxidation by OH. The 25
yield of pinonaldehyde has been estimated to range from 28 to 87% in presence of NO (Arey et al., 1990; Hatakeyama et al., 1991;Hakola et al., 1994; Nozi `ere et al.,
1999a;Wisthaler et al.,2001) and between 3 and 37% in absence of NO (Hatakeyama
et al., 1991; Nozi `ere et al., 1999a). The experimental yields of acetone range from 4041
ACPD
4, 4039–4103, 2004 α-pinene oxidation by OH M. Capouet et al. Title Page Abstract Introduction Conclusions References Tables Figures J I J I Back CloseFull Screen / Esc
Print Version Interactive Discussion
© EGU 2004
4 to 11% in presence of NO (Aschmann et al., 1998;Fantechi, 1999; Nozi `ere et al.,
1999a; Orlando et al., 2000; Larsen et al., 2001; Wisthaler et al., 2001; Librando et
al., 2003) and has been estimated to about 15% in absence of NO (Nozi `ere et al.,
1999a). Vanhees et al.(2001) reported pinonaldehyde and acetone yields of 82% and 6% respectively, at 100 torr. The large discrepancies between these various studies 5
may be related to differences in the measurement techniques, in the way the yields are estimated from concentrations, and in the photochemical conditions in the reactor.
Whereas the chemistry of simple hydrocarbons is relatively well understood (
Atkin-son,1994,2000), the degradation of large NMOCs is more difficult, due to the large number of reactions involved and to the scarceness of direct laboratory investigations 10
of these reactions. Jenkin et al. (1997) described the development of a near-explicit chemical mechanism (Master Chemical Mechanism, MCM) describing the detailed gas-phase degradation of a series of NMOCs. Its construction is based on relatively simple rules describing the kinetics and products of the numerous reactions for which no direct laboratory measurement is available. However, many reactions in the chem-15
istry of terpenes can not be elucidated using simple rules deduced from well-known reactions of simple and smaller compounds. Instead, theoretical analysis has proven to be essential to investigate the reactions involved in the oxidation mechanism of large hydrocarbons. In this respect, Peeters and co-workers have recently performed a thor-ough theoretical analysis of the OH-initiated oxidation of α-pinene and pinonaldehyde, 20
its main generation product (Peeters et al.,2001;Fantechi et al.,2002, Vereecken and Peeters, submitted, 20041). They have shown that the competition between different reactions for several alkoxy and peroxy radicals leads to an unusual dependence of the product yields on chemical conditions.
In this study, a state-of-the-art mechanism for the oxidation of α-pinene by OH is 25
presented, based on these recent studies. This mechanism is implemented in a box model and tested against the extensive set of laboratory measurements performed by
1
Vereecken, L. and Peeters, J.: Non-traditional (per)oxy ring-closure paths in the atmo-spheric oxidation of isoprene and monoterpenes, J. Phys. Chem. A., submitted, 2004.
ACPD
4, 4039–4103, 2004 α-pinene oxidation by OH M. Capouet et al. Title Page Abstract Introduction Conclusions References Tables Figures J I J I Back CloseFull Screen / Esc
Print Version Interactive Discussion
© EGU 2004
Nozi `ere and co-workers. These measurements include the time profiles of precursor and product concentrations for a total of 30 experiments performed in various condi-tions. The experimental results are summarized in Nozi `ere et al. (1999a). Further reference of this paper will be abbreviated as N99.
Note that aerosol formation is neglected in this study. Several groups (Hatakeyama 5
et al., 1991; N99; Bonn and Moortgat, 2002) reported aerosol measurements from the
α-pinene oxidation by OH. The role of gas-particle partitioning for the least volatile
compounds (i.e. hydroxy nitrates, peroxy acyl nitrates) will be discussed in Sect. 3.3. It cannot be ruled out that keto-aldehydes (e.g. pinonaldehyde) could partition to the aerosol phase in some conditions, in spite of their higher volatility (Hallquist et al., 10
1997), for example, by hydration or polymerization in presence of an acid catalyst. However, given the lack of evidence for such processes in the α-pinene oxidation ex-periments discussed here, their role will be ignored.
2. Model description
2.1. Outline of α-pinene mechanism 15
As for all alkenes, OH reacts with α-pinene either by H-abstraction or by addition to the double bond, forming (hydroxy) alkyl radicals (R) which, upon reaction with O2, produce peroxy radicals of general formula RO2. These peroxy radicals react with NO, HO2and other RO2radicals, generating a plethora of stable products (organic nitrates, alcohols, acids...) as well as alkoxy radicals (RO) which generally dissociate or isomerise to 20
produce stable products or/and (hydroxy) alkyl radicals. These radicals react with O2, ensuring the propagation of the oxidation chain. Due to the complex structure of the alkoxy radicals generated in the oxidation of terpenes, they can undergo many different chemical transformations: 1,5-H shift, 1,7-H shift, ring closure, H-abstraction by O2, and decomposition. The rates of these reactions lie in a broad range between 1 s−1 to 25
1011s−1.
ACPD
4, 4039–4103, 2004 α-pinene oxidation by OH M. Capouet et al. Title Page Abstract Introduction Conclusions References Tables Figures J I J I Back CloseFull Screen / Esc
Print Version Interactive Discussion
© EGU 2004
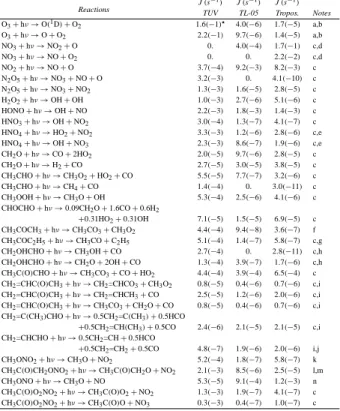
The extensive theoretical kinetic study of the degradation of both α-pinene and its main primary product, pinonaldehyde, by OH conducted by Peeters and co-workers are based on quantitative structure-activity relationships (SARs) and on DFT (density functional theory) calculations of barrier heights, in combination with statistical rate theories (Transition state theory and RRKM theory). Figures1 and 2 summarize the 5
main first steps in the oxidation of α-pinene and pinonaldehyde, respectively. For a detailed description of the theoretical determination of the fates and rates of the oxy radicals, we refer to the here above cited publications.
The main routes of the α-pinene degradation are the OH addition channel (via 2 paths: R2and R6in Fig.1) and an H-abstraction channel (via R1), accounting for 88% 10
and 9%, respectively. Minor H-abstraction channels (3%) are not considered here. It can be seen in Fig.1that several peroxy radicals produced by the oxidation of α-pinene can react in quite unusual ways, like e.g. the decomposition reaction of α-hydroxyalkyl peroxy radicals (e.g. R3O2, R13O2) described byPeeters et al.(2001) and by Hermans et al. (2004)2and the ring closure reactions of large unsaturated peroxy radicals (e.g. 15
R7O2)(Vereecken and Peeters, 20043). These reactions can compete with the NO-reaction, affecting the yields of pinonaldehyde, acetone, and the semi-volatile aerosol precursors.
The gas-phase chemistry implemented in the model used for the present study is discussed in more detail in Sects.2.2to2.4. The determination of the photolytic chan-20
nels and rates are presented in Sect.2.5. Inorganic chemistry is based onAtkinson et
al. (2003).
2
Hermans, I., Nguyen, T. L., Jacobs, P. A., and Peeters, J.: Kinetics and dynamics of α-hydroxy-alkylperoxyl radicals in atmospheric chemistry and in the aerobic oxidation of alcohols and ketones, to be submitted to J. Phys. Chem. A., 2004.
3
Vereecken, L. and Peeters, J.: Non-traditional (per)oxy ring-closure paths in the atmo-spheric oxidation of isoprene and monoterpenes, J. Phys. Chem. A., submitted, 2004.
ACPD
4, 4039–4103, 2004 α-pinene oxidation by OH M. Capouet et al. Title Page Abstract Introduction Conclusions References Tables Figures J I J I Back CloseFull Screen / Esc
Print Version Interactive Discussion
© EGU 2004
2.2. Reactions of peroxy radicals RO2 2.2.1. Reactions of RO2with NO
The reaction of a RO2radical with NO leads to the formation of either an alkoxy radical (RO) or an alkyl nitrate (RONO2):
RO2+ NO → RONO2 (R1a)
→ RO+ NO2. (R1b)
The rate coefficients for CH3O2, C2H5O2, CH3C(O)O2 and C2H5C(O)O2from the rec-ommendations ofAtkinson et al.(2003) are used for all peroxy radicals (RO2) and acyl peroxy radicals (RC(O)O2) of the same carbon number. For higher (C>2) peroxy rad-5
icals, the expression 2.54×10⁻¹²exp (360/T) cm3molecule−1s−1 proposed by
Saun-ders et al. (2003) is used. The rate for C2H5C(O)O2 + NO, 6.7×10⁻¹²exp (340/T) cm3molecule−1s−1, is assigned to higher (C>2) acyl peroxy radicals. The ratio
kR1a/kR1b for reactions involving CH3O2, C2H5O2 and CH3C(O)O2 does not exceed 3% (Tyndall et al.,2001) . The organic nitrate-forming channel is therefore neglected 10
for C≤2 peroxy and all acyl peroxy radicals. The organic nitrates yield for other alkyl peroxy radicals is calculated using the expression ofArey et al. (2001). The yield in-creases with pressure and carbon number, and dein-creases with temperature.
2.2.2. Reactions of RO2with NO2
The reaction of RO2radicals with NO2forms peroxy nitrates: 15
RO2+ NO2+ M RO2NO2+ M. (R2)
The thermal decomposition lifetime of peroxy nitrates is of the order of 0.1–1 s at 298 K and at atmospheric pressure (Atkinson et al., 2003). These reactions can be ne-glected in the lower atmosphere as well as in laboratory reactors and are therefore not considered here. However RCO(O)2 radicals react with NO2 and form stable peroxy 20
ACPD
4, 4039–4103, 2004 α-pinene oxidation by OH M. Capouet et al. Title Page Abstract Introduction Conclusions References Tables Figures J I J I Back CloseFull Screen / Esc
Print Version Interactive Discussion
© EGU 2004
acyl nitrates (abbreviated as PANs) of general formula RC(O)O2NO2). The main loss mechanism of PANs is thermal decomposition back to RC(O)O2and NO2.Tyndall et al.
(2001) determined the low-pressure limit of the forward reaction (R2) for CH3C(O)O2 using Fc=0.6:
kR2,0 = 8.5 × 10⁻²⁹(T/298)−6.5. (1)
5
The high-pressure limit is expressed as:
kR2,∞= 1.1 × 10⁻¹¹(T/298)−1.0. (2)
The reverse reaction is obtained from kR2/Keq, where the equilibrium constant Keq is:
Keq = 9.3 × 10−03exp (14000/T). (3)
Due to the lack of additional kinetic data,Atkinson(2000) recommended to set the rate 10
of the forward reaction of higher peroxy acyl radicals to the high-pressure limit of the CH3C(O)O2+ NO2reaction.
2.2.3. Reactions of RO2with NO3 The reaction of peroxy radicals with NO3,
RO2+ NO3→ RO+ NO2 (R3)
15
proceeds with a rate of 1.1×10⁻¹²cm3molecule−1s−1 for the reaction with CH3O2and 2.3×10⁻¹²cm3molecule−1s−1for the reaction with C2H5O2(Atkinson et al.,2003). The latter value is also used for the reactions involving C≥3peroxy radicals. The rate value of 4.1×10⁻¹² cm3molecule−1s−1 derived byCanosa-Mas et al.(1996) for CH3C(O)O2 + NO3is used for all RC(O)O2+ NO3reactions.
ACPD
4, 4039–4103, 2004 α-pinene oxidation by OH M. Capouet et al. Title Page Abstract Introduction Conclusions References Tables Figures J I J I Back CloseFull Screen / Esc
Print Version Interactive Discussion
© EGU 2004
2.2.4. Reactions of RO2with HO2
The reaction of the CH3O2radical with HO2proceeds through two channels:
CH3O2+ HO2→ CH3OOH+ O2 (R4a)
→ CH2O+ H2O+ O2. (R4b)
Tyndall et al.(2001) recommended a room temperature rate coefficient of 5.2×10⁻¹² cm3molecule−1s−1 for the overall reaction. The relative importance of the CH2O branching channel is given by the temperature-dependent equation defined byElrod et
al. (2001): 5
kR4a/kR4b = exp (6.21 − 1160/T). (4)
At 298 K, the hydroperoxide channel is the main pathway with kR4a/kR4 = 0.91.
Ex-perimental evidence indicates that the reaction of most alkyl peroxy radicals with HO2 proceeds exclusively via the hydroperoxide pathway (Atkinson et al.,2003):
RO2+ HO2→ ROOH+ O2. (R5)
10
The rates reported for CH3O2, C2H5O2 and CH3C(O)CH2O2 are used for all C1, C2 and C3 peroxy radicals respectively. Jenkin et al. (1997) parameterized the RO2 + HO2rates for C≥3alkyl peroxy radicals as a function of the carbon number n:
kR5,alkyl= 3.0 × 10⁻¹³exp (1250/T) × [1 − exp (−0.34n)]. (5)
This expression is based on the data available for the reactions of alkyl and β-15
hydroxy RO2 radicals up to 6 carbons with HO2. The available data for the reaction CH3C(O)O2+HO2indicate a reaction rate of (Atkinson et al.,2003;Tyndall et al.,2001):
kR5,acyl = 5.2 × 10⁻¹³exp (983/T). (6)
Two channels are considered:
RC(O)O2+ HO2→ RC(O)OOH+ O2 (R6a)
→ RC(O)OH+ O3. (R6b)
ACPD
4, 4039–4103, 2004 α-pinene oxidation by OH M. Capouet et al. Title Page Abstract Introduction Conclusions References Tables Figures J I J I Back CloseFull Screen / Esc
Print Version Interactive Discussion
© EGU 2004
The ratio kR6a/kR6 = 0.785 at ambient temperature recommended by Atkinson et al.
(2003) for CH3C(O)O2is used for all acyl peroxy radicals. 2.2.5. Permutation reactions of RO2
The permutation reactions of a given RO2radical include its self-reaction and the cross reactions of this RO2with the other peroxy radicals. In principle, there are four channels for these reactions (Finlayson-Pitts and Pitts,2000):
RO2+ R0O2→ RO+ R0O+ O2 (R7a)
→ R−HO+ R0OH+ O2 (R7b)
→ ROH+ Q0O+ O2 (R7c)
→ ROOR0+ O2. (R7d)
The self-reaction of a given RO2 radical, i.e. RO2+RO2, undergoes the same paths. According to the available data, the contribution of (R7d) is small and generally ne-5
glected, whereas paths (R7a) to (R7c) contribute significantly at room temperature. Their relative importance depends on the structure of the two radicals reacting with each other. Table1reports the fraction of alkoxy radicals (RO), carbonyls (R−HO) and alcohols (ROH) generated from the permutation reactions of a given RO2 radical. As shown by this table, the degree of substitution and the presence of a cycle in α are 10
found to influence the branching ratios.
Because of the large number of RO2 radicals generated in the mechanism, the ex-plicit representation of their permutation reactions would be too demanding in terms of implementation and computational time. A parameterization is required, of the type proposed by Madronich and Calvert (1990) and Jenkin et al. (1997). Following the 15
same approach as in these studies, the RO2 radicals are grouped into classes ac-cording to their structure. Each class is characterized by a self-reaction rate (Table2). The permutation reactions of an explicit RO2 are represented by the reactions of this compound with pseudo-species representing the different classes. The concentration
ACPD
4, 4039–4103, 2004 α-pinene oxidation by OH M. Capouet et al. Title Page Abstract Introduction Conclusions References Tables Figures J I J I Back CloseFull Screen / Esc
Print Version Interactive Discussion
© EGU 2004
of a pseudo-species is equal to the sum of the explicit peroxy radicals concentrations in the corresponding class. Whenever a particular peroxy radical is produced or de-stroyed in the mechanism, the pseudo-species representing its class is also produced or destroyed. The rate constant of the reaction between a given RO2 and a class is estimated as twice the geometric average of the self-reaction rate constants kself(RO
2) 5 and kself(class): k7= 2 × (kself(RO 2)× kself(class)) 1/2. (7)
An important exception to this rule is the case of the reactions of acyl peroxy radicals with other RO2, as discussed further below. The classes are defined according to the substitutions and chemical functionalities (hydroxy, carbonyl, or allyl), if any, in α or β 10
position.
Since the photooxidation of α-pinene produces mostly C≥7 peroxy radicals, the cross reactions involve mostly large radicals in laboratory conditions. In the atmo-sphere, the reactions of large α-pinene radicals with smaller radicals (e.g. CH3O2 and radicals from isoprene) might be important as well. However, since our current 15
focus is mainly on laboratory conditions, we limit our classification to large (C≥7) radicals. The literature data for the self-reaction rates of peroxy radicals are reported in Table 3. Based on these values, the self-reaction rates adopted for each class are discussed below. The notations used here for the different classes are as in Table2. 20
Alkyl peroxy radicals (R1R, R2R, R3R)
Experimental data exist for primary alkyl radicals (R1R) of different structures.Lightfoot
et al. (1992) andBoyd et al.(1999) measured the self-reaction rate of the linear primary radicals up to n-C5H11O2. However, the presence of a double bond or a substitution in β in a primary radical appears to increase its kself as e.g. for C(CH3)3CH2O2 and 25
CH2(OH)C(CH3)=C(CH3)CH2O2 (Jenkin et al.,1998). The radicals generated in our mechanism are usually substituted. Therefore we assume that the structure of the neo-pentyl radical (C(CH3)3CH2O2) is representative of the primary peroxy radicals in
ACPD
4, 4039–4103, 2004 α-pinene oxidation by OH M. Capouet et al. Title Page Abstract Introduction Conclusions References Tables Figures J I J I Back CloseFull Screen / Esc
Print Version Interactive Discussion
© EGU 2004
our model. Since the kself for non-linear alkyl radicals increases slightly with carbon number, we set the self-reaction rate to 4.0×10⁻¹²cm3molec−1s−1 for the R1R class.
Boyd et al.(1999) measured the self-reaction rate coefficients at 298 K for a series of linear secondary alkyl peroxy radicals (R2R). They parameterize the self-reaction rate as a function of the carbon number n:
5
log k(sec−RO
2+sec−RO2)= −13.0 − 3.2 exp (−0.64 × (n − 2.3)). (8)
The self-reaction rates of C5 and C6 secondary cyclic peroxy radicals are in good agreement with this relationship. Taking n= 8 in Eq. (8), and assuming that this rate is somewhat higher due to the numerous allyl and substituted secondary radicals present in the mechanism, a kselfof 4.0×10⁻¹³cm3molec−1s−1 is chosen for the R2R class. 10
Few data exist for the alkyl tertiary radicals (R3R). Lightfoot et al. (1992) re-ported a very low value of kself for (CH3)3CO2. We assume a value of 1.0×10⁻¹⁶ cm−3molec−1s−1to represent the R3R class.
β-hydroxy peroxy radicals (R1H, R2H,R3H)
15
The presence of a β-hydroxy functionality increases significantly the self-reaction rates of a peroxy radical. Lesclaux and coworkers (Boyd et al.,1996b,1997,2003) reported the measurements of self-reactions rates for β-hydroxy radicals. The values for the primary radicals (R1H) range from 2.3×10⁻¹²to 4.8×10⁻¹²cm−3molec−1s−1. To take into account the possible allyl function, the substitutions and the higher carbon number 20
of the radicals considered here, the kselfis taken equal to 8.0×10⁻¹²cm−3molec−1s−1 for the R1H class. On the same basis, we extrapolate the self-reaction rate measured for a C4 β-hydroxy secondary radical to 3.0×10⁻¹² cm−3molec−1s−1 for the R2H class. The kself of the R3H class is set to 5.0×10⁻¹⁴ cm−3molec−1s−1. Boyd et al.
(2003) measured the cross reaction rate between a R2H and a R3H C7radical. Using 25
Eq. (7) with our estimated self-reaction rates, we calculate a cross reaction rate in fair agreement with their experimental data of 6.2×10⁻¹³cm−3molec−1s−1.
ACPD
4, 4039–4103, 2004 α-pinene oxidation by OH M. Capouet et al. Title Page Abstract Introduction Conclusions References Tables Figures J I J I Back CloseFull Screen / Esc
Print Version Interactive Discussion
© EGU 2004 α-hydroxy/β-carbonyl/multifunctional peroxy radicals (R1M, R2M, R3M)
Measurements of self-reaction rates for α-hydroxy and β-carbonyl substituted pri-mary alkyl peroxy radicals show high rate values (Lightfoot et al., 1992). A value of 1.5×10⁻¹¹ cm3molec−1s−1 is chosen for this class (R1M). In absence of more measurement data, we consider this rate as an overall upper limit for the peroxy 5
radicals kself, and compounds containing more than one functionality among hydroxy, carbonyl and allyl substitutions in α or in β are also included in this class. Based on the measurements of Jenkin et al. (1998), rates of 1.0×10⁻¹¹ and 1.0×10⁻¹³ cm−3molec−1s−1 are used for the corresponding secondary (R2M) and tertiary (R3M) classes, respectively.
10
Acyl peroxy radicals (RO3)
Experimental evidence indicates that the cross reaction rates of acyl peroxy rad-icals (RO3) with all the other peroxy radrad-icals are of the same order of magnitude (1 − 1.25×10⁻¹¹cm3molec−1s−1) (Villenave and Lesclaux,1998;Atkinson et al.,2003). 15
A value of 1×10⁻¹¹ cm3molec−1s−1 is adopted for these reactions. The rate of the pseudo-reaction between an acyl peroxy radical and the RO3 class is set to 1.5×10⁻¹¹ cm3molec−1s−1, based on the measurement of the self-reaction rate constant of (CH3)3CC(O)O2(Tomas and Lesclaux,2000).
2.3. “Exotic” peroxy radical reactions in the oxidation of α-pinene 20
As described in Peeters et al. (2001), the reaction of a large secondary (or tertiary)
α-hydroxyalkyl radical with O2 produces an activated peroxy radical RCH(OH)O2† (or
R0C(OH)O2R†). The activated peroxy radical can either stabilize collisionally or decom-pose thermally in competing reactions. In the case of RCH(OH)O2†:
RCH(OH)O2†→ RCHO+ HO2 (R8a)
RCH(OH)O2†→ RCH(OH)O2. (R8b)
ACPD
4, 4039–4103, 2004 α-pinene oxidation by OH M. Capouet et al. Title Page Abstract Introduction Conclusions References Tables Figures J I J I Back CloseFull Screen / Esc
Print Version Interactive Discussion
© EGU 2004
Using a detailed RRKM-Master Equation (ME) analysis based on high-level G2M quan-tum chemical data. Hermans et al., (2004)4estimated the prompt decomposition rates for the nascent chemically activated HOCH2O2†, CH3CH(OH)O2†and C(CH3)2(OH)O2† to be on the order of 10−10s−1, and their effective stabilization rates were found to lie in the range 104–10−1 s−1. These results are in agreement with the available experi-mental data. For the much larger radicals involved in the oxidation of α-pinene, prompt decomposition and stabilization rates should be more competitive. Using RRKM-ME, we estimate the ratio kR8a/kR8b to be about 10/90 and 25/75 in the cases of R13O2† and R3O2† (Fig.1), respectively . The probable error on these ratios is a factor of 2.5. The stabilized α-hydroxyalkyl peroxy radical RCH(OH)O2can either decompose or be oxidized via the traditional reactions with NO, HO2 and RO2 radicals as described in Sect.2.2. In presence of NO, two reactions compete with each other:
RCH(OH)O2 → RCHO+ HO2 (R9)
RCH(OH)O2+NO → RCH(OH)O + NO2. (R10)
The α-hydroxyalkoxy radical produced in the reaction (R10) decomposes, produc-ing HCOOH (or CH3C(O)OH in the case of the decomposition of the tertiary R0C(OH)O2R†):
RCH(OH)O → R+ HCOOH. (R11)
The rate of the thermal decomposition reaction (R9) is strongly dependent on the de-5
gree of substitution of the alpha-hydroxy peroxy radical. Hermans et al. (2004)4 es-timated the decomposition rates of HOCH2O2 (primary), CH3CH(OH)O2 (secondary) and C(CH3)2(OH)O2 (tertiary) to 201 s−1, 2710 s−1 and 29 300 s−1 at 300 K, respec-tively. These results are in good agreement with the available experimental data, al-though the measured decomposition rate of CH3CH(OH)O2is somewhat lower (1870 10
4
Hermans, I., Nguyen, T. L., Jacobs, P. A., and Peeters, J.: Kinetics and dynamics of α-hydroxy-alkylperoxyl radicals in atmospheric chemistry and in the aerobic oxidation of alcohols and ketones, to be submitted to J. Phys. Chem. A., 2004.
ACPD
4, 4039–4103, 2004 α-pinene oxidation by OH M. Capouet et al. Title Page Abstract Introduction Conclusions References Tables Figures J I J I Back CloseFull Screen / Esc
Print Version Interactive Discussion
© EGU 2004
s−1 at 298 K) than the theoretical estimate by Hermans et al. (2004)5. In the case of R13O2 and R3O2, the fairly strong H-bond that can result between the hydroxyl-H and the carbonyl-O should slow down the decomposition somewhat, but as this bond is entropically disfavored, this should reduce the thermal decomposition rate kR9 by only a factor of 1.5. For R13O2, we adopt the experimental value of 1870 s−1 for 5
secondary radicals, but reduced by a factor of 1.5, i.e. kR9 = 1250 s−1. For R3O2, given the absence of experimental data for the tertiary case, we adopt the estimate by Hermans et al. (2004) again reduced for the hydroxyl-to-aldehyde hydrogen bonding, setting kR9 to 1.9×10⁴ s−1 at 298 K. Since HCOOH is mainly produced from reaction (11) in our mechanism, the laboratory measurement of the formic acid yield byOrlando
10
et al. (2000) (7% yield for [NO]=2−22×1014 molecule/cm3) partly validates the rates adopted here for R13O2† and R13O2. The yield estimated from our mechanism ranges from ∼2% at 2 ppm to 16% at 20 ppm NO. The statistical average over the 2–20 ppm range is ∼10%, i.e. reasonably close to the measurement. Reaction (R10) plays a role only in laboratory experiments, when the concentration of NO is higher than 100 15
ppb. Under these conditions, the overall product yields in the α-pinene oxidation are dependent on the concentration of NO. In particular, the yields of pinonaldehyde and acetone are determined by the fate of the radicals R3O2and R13O2(Fig.1).
Vereecken and Peeters (2004)6 demonstrated the importance of ring-closure reac-tions of unsaturated oxy and peroxy radicals formed in the atmospheric oxidation of 20
biogenic NMOCs. They showed in particular that the radical R7O2 formed in the α-pinene oxidation mechanism undergoes a ring closure reaction with a rate of ∼2.5 s−1. The primary production of acetone generated subsequent to the competing reactions
5
Hermans, I., Nguyen, T. L., Jacobs, P. A., and Peeters, J.: Kinetics and dynamics of α-hydroxy-alkylperoxyl radicals in atmospheric chemistry and in the aerobic oxidation of alcohols and ketones, to be submitted to J. Phys. Chem. A., 2004
6
Vereecken, L. and Peeters, J.: Non-traditional (per)oxy ring-closure paths in the atmo-spheric oxidation of isoprene and monoterpenes, J. Phys. Chem. A., submitted, 2004.
ACPD
4, 4039–4103, 2004 α-pinene oxidation by OH M. Capouet et al. Title Page Abstract Introduction Conclusions References Tables Figures J I J I Back CloseFull Screen / Esc
Print Version Interactive Discussion
© EGU 2004
of R7O2is therefore also dependent on the level of NO. A discussion of the influence of these specific reactions on the yield of pinonaldehyde and acetone is given in Sect.3.6. 2.4. Chemistry of the primary products
The OH-oxidation rates of the first generation products in the degradation of α-pinene can be estimated using the structure-reactivity approach (SAR) proposed byKwok et
5
al. (1995). The estimated rates for the compounds present in the mechanism range from 1×10⁻¹² to 7×10⁻¹¹cm3molecule−1sec−1 according to the structure of the com-pound considered. The estimation of their photolysis rate is described in the next section. There are no published degradation mechanism for these compounds, to the exception of pinonaldehyde. A detailed investigation of such degradation mechanisms 10
would be beyond the scope of the present study. A simplified representation is there-fore adopted. Our aim is to represent the main impact of the oxidation of primary products, i.e. the generation of a chain of peroxy radicals reactions which, in high NO conditions, contribute to NO to NO2conversion and to nitrate production. We assume here that the unknown chemistry of primary products proceeds in ways similar to the 15
explicit mechanism. Based on this similarity assumption, we estimate to about 4 the average number of successive peroxy radical reactions necessary to generate a stable compound from the oxidation of a typical (C9 or C10) product in high NOx conditions, about half of which are C≥7 peroxy radical reactions. Due to the marked dependence of the nitrate yield on the size of the peroxy radicals in RO2+NO reactions, it is found 20
useful to distinguish between large (C≥7) peroxy radicals produced from the oxidation of primary products, noted LXO2, and smaller (C<7) radicals, noted SXO2.
Based on these observations, the oxidation of C≥7 products is represented as a unique reaction producing generic peroxy radicals:
C≥7product+ OH → λ n X i=1 αi LXO2i, (R12) 25
ACPD
4, 4039–4103, 2004 α-pinene oxidation by OH M. Capouet et al. Title Page Abstract Introduction Conclusions References Tables Figures J I J I Back CloseFull Screen / Esc
Print Version Interactive Discussion
© EGU 2004
LXO2i is a generic peroxy radical C≥7of class i , as defined in Table2. λ represents the assumed average number of oxidation steps necessary to obtain a radical of carbon number lower than 7 and is taken equal to 2. The distribution of the generic peroxy radicals among the different classes are defined by the stoichiometric coefficients αi. It is assumed to be similar to the distribution of the different peroxy radicals classes 5
present in the explicit mechanism. The sum of the αi of the different classes i is equal to unity. Based on a simple count of the number of peroxy radicals in each class in the α-pinene+OH mechanism, the “RxO” and “RxM” (x=1,2 or 3) classes are found to be dominant. The distribution is parameterized as follows: αRxR=0.06, αRxO=0.1,
αRxM=0.1, αRO3=0.2.
10
These LXO2 radicals react with NO, HO2 and the other RO2 radicals, producing stable products and smaller (C<7) generic peroxy radicals SXO2:
LXO2i+NO → NO2+
n
X
i=1
αi SXO2i (R13a)
LXO2i+NO → LXONO2 (R13b)
LXO2i+HO2→ LXOOH+ O2 (R14)
LXO2i+RO2→ a
n
X
i=1
αi SXO2i+ b LXOH + c LXCHO. (R15)
The SXO2 radicals react in the same manner and terminate the propagation chain:
SXO2i+NO → NO2 (R16a)
SXO2i+NO → SXONO2 (R16b)
SXO2i+HO2→ SXOOH+ O2 (R17)
SXO2i+RO2→ b SXOH+ c SXCHO. (R18)
The coefficients a, b and c in (R15) and (R18) depend on the structure of the radicals LXO2iand SXO2i(see Table1).
ACPD
4, 4039–4103, 2004 α-pinene oxidation by OH M. Capouet et al. Title Page Abstract Introduction Conclusions References Tables Figures J I J I Back CloseFull Screen / Esc
Print Version Interactive Discussion
© EGU 2004
The C<7 primary products are treated as their C≥7counterparts:
C<7products+ OH → λ
n
X
i=1
αi SXO2i. (R19)
The coefficients λ and αi in Eq. (R19) are assumed to be the same as in Eq. (R12). The subsequent reactions of radicals for which the chemistry is still speculative are also treated following Eq. (R12) or (R19) according to the carbon number of the radical 5
considered. For example, in the case of the R11radical (Fig.1), we write:
R11 → 2 n X i=1 αi LXO2i. (R20) 2.5. Photolysis
Photochemistry in most NMOC photo-oxidation experiments is initiated by the pho-todissociation of an OH precursor, which is either H2O2:
10 H2O2+ hν → 2OH, (R21) or CH3ONO: CH3ONO+ hν → CH3O+ NO (R22) CH3O+ O2→ CH2O+ HO2 (R23) NO+ HO2→ NO2+ OH. (R24)
In the N99 experiments, H2O2 is photolysed by TUV mercury lamps emitting short-wave ultraviolet radiation with a concentrated radiation peak at 253.7 nm. In the sec-ond case, TL-05 mercury lamps (Philips, λmax=360 nm) are used. The lamp spectra are shown in Fig.3as well as the solar spectrum at ground level. The intensity of the 15
lamps reported in the figure are those estimated for the N99 experiments. Because the TL-05 lamps radiate mostly in the 300–480 nm range, they are often considered
ACPD
4, 4039–4103, 2004 α-pinene oxidation by OH M. Capouet et al. Title Page Abstract Introduction Conclusions References Tables Figures J I J I Back CloseFull Screen / Esc
Print Version Interactive Discussion
© EGU 2004
more appropriate to represent solar radiation in real tropospheric conditions. The ex-periments performed using TL-05 and TUV lamps will hereafter be referred as “visible” and “UV” experiments, respectively.
The photodissociation coefficient (J-value) for a given photolytic process i is calcu-lated as 5 Ji = Z λ I(λ) × σi(λ) × φi(λ) × d λ (9)
where λ is the wavelength, I(λ) is the average actinic flux in the reactor, σi(λ) and
φi(λ) are the absorption cross section and the photolysis quantum yield of the species i, respectively. The actinic flux I(λ) is not directly measured, but it can be related to measurable quantities by writing,
10
I(λ)= I0× f (λ) (10)
where f (λ) is either the TUV or TL-05 normalized lamp spectrum, and I0 is a scaling factor adjusted so that J(H2O2) or J(CH3ONO) calculated using Eq. (9) matches the observed decay rate of H2O2 or CH3ONO in the reactor. The following average photolysis rates are deduced from the observations of H2O2and CH3ONO in the N99 15
experiments:
J(H2O2)= 1.0×10⁻³s−1
J(CH3ONO)= 9.1×10⁻⁴s−1. 20
These values are corrected for minor effects due to secondary reactions influ-encing CH3ONO and H2O2. The derivation of I0 is straightforward, because the photolytic parameters for both precursors are well known (their absorption cross sections are shown in Fig.4).
Equation (9) has been used to derive J-values for inorganic compounds as well as 25
for the carbonyls, organic nitrates, peroxy acyl nitrates and hydroperoxides produced in the photooxidation of α-pinene. The photolysis of alcohols and carboxylic acids are not
ACPD
4, 4039–4103, 2004 α-pinene oxidation by OH M. Capouet et al. Title Page Abstract Introduction Conclusions References Tables Figures J I J I Back CloseFull Screen / Esc
Print Version Interactive Discussion
© EGU 2004
considered, since they are expected to be slow. The photodissociation processes for which the absorption cross sections and the quantum yields are known from laboratory studies are listed in Table 4. The corresponding J-values were calculated for both the UV and visible experiments in N99. In addition, the J-values estimated for typical tropospheric conditions using the TUV photolysis calculation model ofMadronich and
5
Flocke (1998) are also shown for comparison.
The photolysis parameters for other compounds which have not been directly inves-tigated in the laboratory have been estimated based on assumed simple relationships between the photolytic parameters of compounds of similar structures. Table5 sum-marizes the reactions and rates for the species of interest in this study. The reference 10
species on which the estimations are based are also indicated in the table. Pinonalde-hyde and organic nitrates are important special cases and will be discussed in the next sections.
2.5.1. Pinonaldehyde
The absorption cross sections of pinonaldehyde have been measured byHallquist et al.(1997) between 275 and 345 nm (Fig.5). Being a keto-aldehyde, it can be expected to photolyse following both aldehydic and ketone dissociation channels. In the first case, by analogy with other aldehydes like n-pentanal (Tadic et al., 2001a) and n-hexanal (Tadic et al.,2001b), intramolecular rearrangements and fragmentations into free radicals take place. One radical channel (R25a) (Norrish-Type I) and two molecular channels (R25b) and (R25c) (Norrish-Type II) can be considered (PINALD stands for pinonaldehyde):
PINALD+ hν → CHO + R17 (R25a)
PINALD+ hν → CH2=CHC(O)CH3+ CH3C(CH3)=CHCH2CHO (R25b) PINALD+ hν → CH3C(O)CH=C(CH3)CH3+ CH2=CHCH2CHO. (R25c) The molecular channels are assumed to proceed through two energetically favored 15
ACPD
4, 4039–4103, 2004 α-pinene oxidation by OH M. Capouet et al. Title Page Abstract Introduction Conclusions References Tables Figures J I J I Back CloseFull Screen / Esc
Print Version Interactive Discussion
© EGU 2004
data, the two resulting molecular channels are assumed to have the same probability. The ketone dissociation channel can be assumed to proceed by cleavage of the CH3CO−R bond of pinonaldehyde, based on the example of methyl ethyl ketone ( Atkin-son et al.,2003):
PINALD+ hν → R4+ CH3CO. (R25d)
Tadic et al. (2001a, b, 2002) measured the relative importance of the different photol-ysis channels of aldehydes. Their experiments between 275 and 380 nm showed that the contribution of the molecular channel increases slowly with chain length: 70% for
n-pentanal, 73% for n-hexanal and 80% for n-heptanal. The average quantum yields
5
(averages weighted by the lamp spectrum and the absorption cross sections) were measured to be 0.32, 0.34, 0.38 and 0.31 at 700 Torr for C4–C7 alkanals. They all show a similar dependence on total pressure. It should be noted however, thatDesai
et al. (1986) and Atkinson et al. (2003) reported substantially higher quantum yields for propanal and isobutanal. Based on these studies, we calculate average quantum 10
yields of 0.70 and 0.66 for these two species, respectively (averages weighted by their respective absorption cross sections (Atkinson et al.,2003) and by the spectrum of the lamp used in Tadic et al.). The origins of this difference are unclear.
We assume here that the averaged quantum yield of n-hexanal (0.38) can be used for the aldehydic channels of pinonaldehyde, with probabilities of 27% and 73% for the 15
Norrish-Type I and II, respectively. These yields are assumed to be essentially inde-pendent on wavelength. The wavelength-deinde-pendent quantum yields of methyl ethyl ketone (MEK) is used for the ketone photodissociation channel. Below 290 nm, the quantum yields are scaled down so that the total quantum yield does not exceed 1.
The estimated pinonaldehyde quantum yields are shown in Table6. It can be seen 20
that the ketone dissociation channel is expected to be dominant in the UV experiments, while the aldehydic channels are expected to prevail in the visible experiments.
By using the cross sections ofHallquist et al.(1997) with the quantum yields and the lamp spectrum in Eq. (9) described above, a rate of 9.2×10⁻⁶s−1 is calculated for the
ACPD
4, 4039–4103, 2004 α-pinene oxidation by OH M. Capouet et al. Title Page Abstract Introduction Conclusions References Tables Figures J I J I Back CloseFull Screen / Esc
Print Version Interactive Discussion
© EGU 2004
visible experiments, i.e. less than the measurement (5.5×10⁻⁵s−1) based on a blank pinonaldehyde experiment conducted in the absence of CH3ONO by N99. Such a discrepancy between the experimental and theoretical J-values cannot be attributed to uncertainties in the pinonaldehyde photolysis parameters. Indeed, even the maximum theoretical quantum yield (unity) would result in a J-value lower than the measured 5
value. In any case, both experimental and theoretical values are very low, making pinonaldehyde photolysis almost negligible in the visible experiments.
A similar estimation of the J-value using Eq. (9) is not possible for the UV experi-ments, because the cross sections are unknown at or around the lamp emission peak (253.7 nm). Therefore, the measured photolytic rate of 3.3×10⁻⁴ s−1 reported in N99 10
for the UV experiments is used in our model. Combining this value with the TUV lamp spectrum, we estimate the cross section of pinonaldehyde to about 2.8×10⁻²⁰cm2 at 253.7 nm (Fig.5).
2.5.2. Alkyl nitrates
The absorption cross sections of organic alkyl nitrates are based on the recommenda-15
tions ofAtkinson et al. (2003). The quantum yield is assumed equal to 1 throughout the visible and UV spectrum. The only channel considered is:
RONO2+ hν → RO + NO2. (R26)
The calculated photodissociation rates of several organic nitrates investigated in the laboratory are listed in Table 7. The rates are seen to increase with the number of 20
carbons. They are also higher when a ketone functionality is present. The increase of J(n-alkyl nitrates) with carbon number obeys roughly a logarithmic law. The rate de-pends also on the position of the nitrate group, as illustrated by the differences between isopropyl nitrate (i−CH3CH(ONO2)CH3), 2-butyl nitrate (CH3CH2CH(ONO2)CH3) and their n-alkyl counterparts. We group the numerous nitrates generated in the α-pinene 25
ACPD
4, 4039–4103, 2004 α-pinene oxidation by OH M. Capouet et al. Title Page Abstract Introduction Conclusions References Tables Figures J I J I Back CloseFull Screen / Esc
Print Version Interactive Discussion
© EGU 2004
and C≥7 keto-nitrates. The rate of 2-butyl nitrate is adopted for the C<7 alkyl ni-trates. Barnes et al.(1993) reported absorption cross sections of α-nitrooxy acetone, 1-nitrooxy-2-butanone and butanone. The photolysis rate of 3-nitrooxy-2-butanone (CH3CH(ONO2)C(O)CH3) is assumed to be representative for the C<7 keto-nitrates. The photodissociation rates for C≥7 alkyl and keto-nitrates compounds are 5
obtained by logarithmic extrapolation. Because of the presence of the carbonyl chro-mophore in the keto-nitrates, the photolytic cleavage of the RCO−CH(ONO2)R bond is another possible pathway for these compounds, in particular in the UV experiments. However, the rupture of the O−NO2bond probably dominates. Due to the lack of data, aldehyde-nitrates are assume to photolysis in the same fashion as keto-nitrates. 10
3. Results: Mechanism testing and validation with laboratory studies
3.1. Description of the box model and experiments
The full mechanism (about 1500 reactions) described in the previous section has been implemented in a box model. In addition, the losses of the stable products on the walls of the reactor were also taken into account based on the loss rate of pinonaldehyde 15
measured in N99 (4.3×10⁻⁵ s−1). The same rate is applied to all stable products. The box model solves the continuity equations for the ∼600 chemical species involved in this mechanism. The solver used in this study uses an embedded Rosenbrock scheme of order 4 (Hairer and Wanner,1990). The FORTRAN code is generated by a preprocessor KPP (Damian-Iordache et al., 1995) which reads text files listing the 20
chemical equations and the species involved in the mechanism.
N99 performed α-pinene+OH experiments with and without NO. In presence of NO, 9 experiments were conducted under UV light and 11 experiments under visible light with H2O2and CH3ONO as radical precursor, respectively. A few pinonaldehyde+OH experiments were also carried out in presence of NO. A selection of experiments 25
presenting typical features will be discussed in this study. In the following discus-4061
ACPD
4, 4039–4103, 2004 α-pinene oxidation by OH M. Capouet et al. Title Page Abstract Introduction Conclusions References Tables Figures J I J I Back CloseFull Screen / Esc
Print Version Interactive Discussion
© EGU 2004
sion, the experiments are numbered following their appearance number in Table 1 (α-pinene+OH in presence of NO: Experiments 1 to 21), Table 3 (in absence of NO: Experiments 22 to 31) and Table 4 (pinonaldehyde+OH: Experiments 32 to 37) in N99. The time concentrations of the chemical compounds in the reactor were measured with a Fourier transform infrared (FTIR) spectrometer. The species measured include 5
α-pinene, the OH precursor, pinonaldehyde, acetone and formaldehyde. In addition,
organic nitrates, acyl peroxy nitrates (PANs), NO and NO2were also estimated in some experiments. For a detailed description of the experiments, we refer to N99.
3.2. Methodology for comparison
A simple way to validate the mechanism could be to compare the primary product yields 10
deduced from the mechanism with the corresponding yields estimated from the labo-ratory data. However, this simplistic approach ignores the dependence of the yields on photochemical conditions (e.g. concentration of NO) which will be discussed in more detail in Sect.3.6. In addition, the derivation of primary yields from laboratory data is particularly difficult due to the product losses and to the existence of secondary pro-15
ductions. The effect of these processes can be minimized by using the concentrations measured in the early stages of the experiment, and by using the fact that the true primary yield can be approximated as
Y (X)= lim
t→0Yapp(X, t) (11)
where 20
Yapp(X, t)=[X(t)]/([REACTANT(0)]−[REACTANT(t)]). (12)
Yapp(X, t) is the apparent yield of the product X at time t, and [X(t)] and [REACTANT(t)] represent the concentration of X and the reactant, (α-pinene or pinonaldehyde) at time
t. [REACTANT(0)] is the initial concentration of the reactant. However, it is easy to see
that even small errors on the concentrations can lead to large errors on the yields. Also, 25
ACPD
4, 4039–4103, 2004 α-pinene oxidation by OH M. Capouet et al. Title Page Abstract Introduction Conclusions References Tables Figures J I J I Back CloseFull Screen / Esc
Print Version Interactive Discussion
© EGU 2004
any delay between the time when [REACTANT(0)] is measured and the actual start of the experiment can have large effects. For larger t values, the relative errors on [X(t)] and on the difference [REACTANT(0)]–[REACTANT(t)] become less important, but the photochemical sink and the secondary production play a larger role, which is difficult to quantify. Therefore, instead of comparing ’true’ yields, it is more meaningful for the 5
purpose of mechanism validation to compare the observed concentrations [X(t)] with concentrations calculated using a “box” model.
In order to quantify the model/data biases in a systematic way, we average the ap-parent yields deduced at measurement times ti comprised between 10% to 60% of pinene conversion, i.e. a time interval of typically about 10 min. Data before 10% of α-10
pinene conversion are discarded in order to minimize the relative errors on [∆APIN(t)] and on the product concentrations, whereas data after 60% of α-pinene conversion are rejected to moderate the influence of product losses and secondary productions. These processes are taken into account in the model, but to a much lesser degree of detail than the pathways leading to the primary products. For example, the experimen-15
tal average apparent yield of a product X is calculated as:
¯ Yappobs(X)= Pn i=1Y obs app(X, ti) n , (13)
where n is the number of samplings between 10% and 60% α-pinene converted. The corresponding model apparent yield ( ¯Yappmod(X)) is deduced in a similar way using the modelled values of X at the same measurement times ti. Note that the apparent yields 20
deduced from both the model and the observation are calculated using the α-pinene concentrations from the model.
The comparison between experimental and simulated apparent yields is meaning-ful only if the model is able to reproduce properly the observed variation of α-pinene. This is indeed the case for most experiments. The mean bias between the modelled 25
and measured α-pinene concentrations is below 10% for more than 70% of the exper-iments. Experiments showing a mean bias higher than 10% are discarded from our
ACPD
4, 4039–4103, 2004 α-pinene oxidation by OH M. Capouet et al. Title Page Abstract Introduction Conclusions References Tables Figures J I J I Back CloseFull Screen / Esc
Print Version Interactive Discussion
© EGU 2004
analysis. On average, the valid experiments show a mean bias that does not exceed 5%.
Secondary productions of a compound X (Ysec) may result from the photooxidation of other primary products, e.g. pinonaldehyde. The losses (L) of X occur via oxidation by OH, photolysis and, of least importance, by loss on the walls. ¯L(X) and ¯Ysec(X) are 5
averaged over the n sampling times of X in the same fashion as in Eq. (13). The values of Y (X) reported in this study are the theoretical yields obtained following Eq. (11). In principle, the yield of X can vary in the course of an experiment, because it is a function of the conditions ([NO], [NO2], [HO2]...) which influence the fate of peroxy radicals. In practice, however, these conditions do not vary dramatically in the N99 experiments 10
and Y (X) is almost constant during an experiment. Therefore, if the samplings of X are made in the early experimental times, we obtain the following relation:
Y (X) ≈ ¯Yapp(X)+ ¯L(X)− ¯Ysec(X). (14)
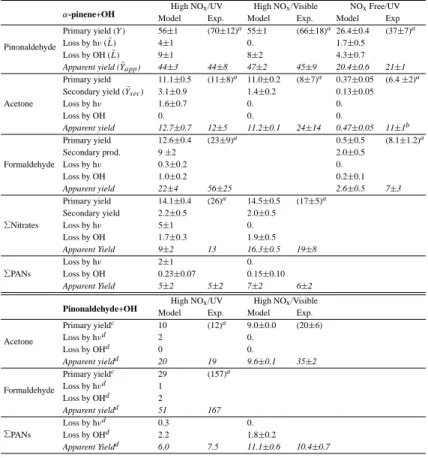
The yields Y , as well as the average apparent yields, ¯Yapp(X), the losses ¯L(X) and secondary productions ¯Ysec(X) are summarized in Table8. They are all expressed as 15
molar yields, i.e. as percentages of α-pinene converted. The yields reported by N99 are also shown. The variability in the modelled values are due to 1/differences in the initial conditions of NO and 2/differences in the sampling times. The time concentrations calculated by the model are compared with the measured concentrations in Fig. 6
(visible, in presence of NO), Fig.7(UV, in presence of NO) and Fig.8(UV, NO-free). 20
The same methodology was used for the pinonaldehyde experiments. However, the strong photolysis of pinonaldehyde in the UV experiments contributes to the product concentrations. Therefore Y (X) has to be corrected by retrieving the production from the photolysis and readjusting the yield to the actual [∆(PINALD)] that has reacted with OH. In the visible conditions, the photolysis of pinonaldehyde is weak, and no 25
correction is needed.
Only two pinonaldehyde+OH experiments were performed in UV conditions. The model fails to reproduce the degradation of pinonaldehyde (>10% deviation) for one of
ACPD
4, 4039–4103, 2004 α-pinene oxidation by OH M. Capouet et al. Title Page Abstract Introduction Conclusions References Tables Figures J I J I Back CloseFull Screen / Esc
Print Version Interactive Discussion
© EGU 2004
them. In the visible, the pinonaldehyde decay rate is well caught by the model for the three experiments reported. On average, the mean bias between the modelled and measured pinonaldehyde concentrations is about 5%. Results are reported in Table8
and shown in Fig.9.
3.3. α-pinene comparison results
5
3.3.1. α-pinene and OH-precursors
As explained previously, the intensity of the lamps in the model are adjusted on the measured decay rates of the OH-precursors. These rates are found to be essentially constant, demonstrating the stability of the lamps. The degradation of α-pinene is well simulated in the UV conditions in presence as well as in absence of NO, indicating that 10
the processes determining the concentration of OH are generally well represented by the model. In the visible conditions, the large production of formaldehyde generated through the degradation of CH3ONO (Eq.R22) as well as the concentration of NO are well reproduced. This indicates that the photolysis of CH3ONO is correctly estimated and so is the primary production of OH (through Eq. R24) in the reactor for these 15
conditions. However, discrepancies appear at longer experimental times between the modelled and measured α-pinene degradation rates for about half the experiments simulated in the visible conditions. Examples of this behaviour are seen in experiments 4 and 5 in Fig.6. The bias is small (<10%) in the first stage of the experiment (before 60% of α-pinene conversion) and it does not influence the estimation of the primary 20
product yields. The discrepancy at later times seems to be independent on the initial concentrations or on the evolution of the photochemical conditions in the course of the experiment (e.g. abrupt decrease of the NO level).
ACPD
4, 4039–4103, 2004 α-pinene oxidation by OH M. Capouet et al. Title Page Abstract Introduction Conclusions References Tables Figures J I J I Back CloseFull Screen / Esc
Print Version Interactive Discussion
© EGU 2004
3.3.2. Pinonaldehyde
The pinonaldehyde concentrations are very well reproduced by the model in presence (Figs.6and 7) as well as in absence (Fig. 8) of NO, in particular in the first stage of the experiments (<60% α-pinene conversion). This is reflected by the excellent agree-ment obtained regarding the apparent yields of pinonaldehyde, as defined by Eq. (13) 5
(see Table8). In presence of NO, the yield of pinonaldehyde (i.e. the yield corrected for its different losses) is calculated to be 55.5% for an initial concentration of NO of 3 ppm. The strong photolysis of pinonaldehyde in the UV conditions explains the lower apparent yields in the UV compared to the visible conditions, where photolysis plays a negligible role (Table 8). In both series of experiments, the reaction of pinonalde-10
hyde with OH represents 8–9% of the reacted α-pinene. As much as 10-25% of the pinonaldehyde produced when 60% of α-pinene has reacted is photooxidized in this interval. In the later stages of the experiments, when the oxidation of the primary prod-ucts plays a more important role in the reactor, pinonaldehyde is overestimated by the model in about half the visible experiments. The reason for this discrepancy might be 15
the oversimplified treatment of the oxidation mechanism of the primary products. In absence of NOx, pinonaldehyde is produced exclusively from cross reactions of peroxy radicals. About 10% among the 26% pinonaldehyde yield come from reactions of R12O2 (see Fig.1). The self-reaction rate of this tertiary radical explains that it re-acts for about 50% with HO2, thereby contributing to about 8% among the total 30% 20
of peroxides generated in the system. The remaining 50% of the R12O2radicals react mainly with acyl peroxy radicals, then with O2, producing R13O2. The fast decomposi-tion of R13O2outruns its reaction with HO2and other RO2s, producing pinonaldehyde. The other channel leading to pinonaldehyde (16%) proceeds via the secondary radical R2O2. The high self-reaction rate allows R2O2 to react for 90% via the permutation 25
reactions. Among them, the reaction of R2O2 with the β-hydroxy secondary radicals (actually mainly composed of R2O2) is the preferred pathway (∼40%). The other per-mutation reactions contribute equally (∼5–10%) at the exception of the cross reactions
ACPD
4, 4039–4103, 2004 α-pinene oxidation by OH M. Capouet et al. Title Page Abstract Introduction Conclusions References Tables Figures J I J I Back CloseFull Screen / Esc
Print Version Interactive Discussion
© EGU 2004
with the alkyl tertiary radicals R3R which are negligible.
N99 reported yield estimates about 10% higher than reported here. Considering the difficulty to retrieve true product yields from the measured concentrations and the large uncertainties in the reaction rates of large peroxy/alkoxy organic radicals in the mechanism, these estimates are in fairly good agreement with our model.
5
3.3.3. Acetone
The calculated primary yield of acetone for a mean initial concentration of NO of 3 ppm is 11%, in good agreement with N99. The sink of acetone is small: oxidation by OH is negligible, and photolysis plays at most a minor role. The secondary production of ace-tone originates from the photooxidation of pinonaldehyde. It is more important in the 10
experiments using the UV lamp due to the higher photodissociation rate of pinonalde-hyde under these conditions. Considering the large dispersion in the data, the model reproduces quite well the time evolution of acetone.
An important disagreement exists for acetone in the experiments without NOx. The data show a significant production of acetone (≈10% yield) through primary or/and 15
secondary reactions in these conditions, whereas the model simulates a production close to zero. As explained in Sect. 2.3, the ring closure reaction of R7O2 outruns the channel leading to the production of acetone in presence of NO. Due to the lack of measurements in the early stages of the experiments, the acetone yields (Table8) are calculated using concentration data for α-pinene conversions from 60 to 90%. The 20
production from secondary reactions like the photooxidation of pinonaldehyde and per-oxides may be important. Further theoretical work will be needed to investigate the origin of acetone at low NOx.
3.3.4. Formaldehyde
The model cannot reproduce the large formaldehyde concentrations measured in the 25
UV experiments. However, the measured production of formaldehyde appears to be 4067
ACPD
4, 4039–4103, 2004 α-pinene oxidation by OH M. Capouet et al. Title Page Abstract Introduction Conclusions References Tables Figures J I J I Back CloseFull Screen / Esc
Print Version Interactive Discussion
© EGU 2004
constant in time (experiments 3 and 17 in Fig.7) and independent on the photochem-ical regime (experiments 25 and 30 in Fig.8), suggesting a desorption of this com-pound from the walls. This effect is not seen in the visible conditions because of the large amount of formaldehyde generated by the photolysis of CH3ONO (experiment 4 in Fig.6). The modelled primary yield is 12.6% at high NOxconcentrations. The main 5
production pathways proceed through the reactions of the radicals R3O2 and R13O2 with NO. Secondary productions originate from the photooxidation of pinonaldehyde (6%) and from other sources (3%). Yield values are not reported for the visible ex-periments, since methyl nitrite photolysis generates large quantities of formaldehyde. The formaldehyde yield is very low in the NOx-free experiments. This is due to the fast 10
decomposition of the radicals R3O2 and R13O2 to pinonaldehyde, outrunning the for-mation of formaldehyde through these radicals. The other channel (via R6and R7O2) leads to R8for which we have no explicit mechanism. Therefore we can assume that, as for acetone, formaldehyde is underestimated in the model in absence of NO. 3.3.5. Nitrates
15
The total concentration of organic nitrates (mainly made of C≥7 compounds) gen-erated by the α-pinene oxidation were quantified by N99 on the basis of the inte-grated cross sections (σint) of 2-hydroxypinane-3-nitrate and 3-oxopinane-2-nitrate in the range 1635–1700 cm−1. The first compound represents 20% of the total amount of nitrates produced according to the mechanism, whereas the latter is not produced. 20
However, the great majority of the nitrates generated in the α-pinene mechanism have a structure comparable to 2-hydroxypinane-3-nitrate (presence of a cycle, presence of an alcohol function, and similar number of carbons), so that we can consider plausible that they absorb in a similar fashion as 2-hydroxypinane-3-nitrate and 3-oxopinane-2-nitrate.
25
The model reproduces quite well the observed apparent yields for both actinic con-ditions. The nitrates were quantified in only one experiment in the UV series. In that case, the data at longer times show a sharp increase of the nitrates concentration that