HAL Id: hal-00295762
https://hal.archives-ouvertes.fr/hal-00295762
Submitted on 21 Oct 2005
HAL is a multi-disciplinary open access
archive for the deposit and dissemination of
sci-entific research documents, whether they are
pub-lished or not. The documents may come from
teaching and research institutions in France or
abroad, or from public or private research centers.
L’archive ouverte pluridisciplinaire HAL, est
destinée au dépôt et à la diffusion de documents
scientifiques de niveau recherche, publiés ou non,
émanant des établissements d’enseignement et de
recherche français ou étrangers, des laboratoires
publics ou privés.
pollution scenarios on coastal complex terrain
J. L. Palau, G. Pérez-Landa, J. J. Diéguez, C. Monter, M. M. Millán
To cite this version:
J. L. Palau, G. Pérez-Landa, J. J. Diéguez, C. Monter, M. M. Millán. The importance of meteorological
scales to forecast air pollution scenarios on coastal complex terrain. Atmospheric Chemistry and
Physics, European Geosciences Union, 2005, 5 (10), pp.2771-2785. �hal-00295762�
SRef-ID: 1680-7324/acp/2005-5-2771 European Geosciences Union
Chemistry
and Physics
The importance of meteorological scales to forecast air pollution
scenarios on coastal complex terrain
J. L. Palau, G. P´erez-Landa, J. J. Di´eguez, C. Monter, and M. M. Mill´an
Fundaci´on Centro de Estudios Ambientales del Mediterr´aneo (CEAM), Val`encia, Spain Received: 25 May 2005 – Published in Atmos. Chem. Phys. Discuss.: 12 July 2005 Revised: 29 September 2005 – Accepted: 29 September 2005 – Published: 21 October 2005
Abstract. Some of the meteorological approaches com-monly considered in urban air pollution models do not take into account the importance of the smaller scales in the me-teorology of complex-terrain coastal sites. The aim of this work is to estimate the impact of using the proper meteoro-logical scales when simulating the behaviour of the pollutant concentrations emitted in the lower layers over coastal com-plex terrain areas. The availability of experimental measure-ments of a power plant plume near the Castell´on conurbation (on the Spanish Mediterranean coast) has allowed us to use this plume as a tracer of opportunity of the lower atmosphere to check the results of a simulation exercise using the RAMS mesoscale model coupled to the HYPACT particle model. The results obtained show that in a complex-terrain coastal site, because of the strong effect of the meteorological inter-actions between the different scales on the integral advection and the turbulent dispersion of pollutants, using an inade-quate scale to solve the meteorology can result in a very big gap in the simulation of lower-layer pollutant behaviour at urban scales.
1 Introduction
In recent years, different research projects around the world have evidenced that the formation and distribution of pri-mary pollutants and photo-oxidants in urban plumes, at re-gional or continental scales, in the boundary layer and in the free troposphere, are all linked together (Mill´an et al., 1992; Fast et al., 1998; Menut et al., 1999, 2005; Dupont et al., 1999; Alonso et al., 2000; Fiore at al., 2002; Mill´an et al., 2002; Snyder, 2002; Gerbig et al., 2003; Rotach et al., 2004; Weigel et al., 2004; Weigel and Rotach, 2004; and e.g., web-pages of the research projects ECLAP; MAP-Riviera;
ES-Correspondence to: J. L. Palau
COMPTE; VOTALP I and II; PACIFIC2001; AIR4EU; CO-BRA2000; COBRA-NA2003). Experimental data and com-plementary modelling results from different research projects have studied links between atmospheric circulations from lo-cal, through regional, to sub-continental scales, particularly in summer and in the Mediterranean basin (Mill´an et al., 1992, 2002).
The evidence collected to date from urban monitoring networks shows that photochemical air-quality problems in southern Europe, as in other mid-latitude regions through-out the world, are governed by meteorological processes with marked diurnal cycles and space scales of tens-to-hundreds of km which are not associated exclusively to classical sea-breeze-type circulations (Lalas et al., 1983; Mill´an et al., 1984, 1987, 2000; Steyn, 1996; Fast and Zhong, 1998; Gan-goiti et al., 2002; Menut et al., 2005).
Over complex terrain the properties of the lower tropo-sphere strongly depend on the thermally induced local circu-lations that develop under clear sky conditions. Many stud-ies have examined the daytime evolution of these processes. Whiteman (1982) observed the development of the boundary layer in mountain valleys, indicating that local subsidence influences convective boundary layer formation. Segal et al. (1988a) evaluated the impact of valley/ridge circulations on regional transport. In complex-terrain coastal areas the aforementioned “local circulations” couple with sea breezes to merge into a new and stronger thermal circulation.
The sea-breeze diurnal cycle associated with land-water temperature contrast, vertical structure, depth, return current, horizontal extent and life cycle has been observed in many coastal areas (Atkinson, 1981; Pielke, 1984). Likewise, the influence that increased stability due to subsidence off-shore has on breeze development was documented by Mizzi and Pielke (1984). Other studies using numerical meteoro-logical models (Mahrer and Pielke, 1977) have shown that the combination of sea breeze and mountain circulations in-duces more intense circulations than does each separately
(synergistic effect). In this sense, Kurita et al. (1985), Assai and Mitsumoto (1978) and Ookouchi et al. (1978) showed that mountains ranges contribute to intensify the sea breeze due to the thermal effect. Moreover, surface heat flux dif-ferences of 100 W/m2over several tens of kilometres due to physiographic differences on the surface can generate sea-breeze-like circulations (Segal et al., 1988b).
In the case of Spain, experimental results up to 1987 showed that the observed sea breeze could be caused by a forcing mechanism which acts at larger scales than the purely local one and is associated with the formation of the Iberian Thermal Low (ITL) between late spring and the beginning of autumn (Mill´an et al., 1991, 1992). These meteorological interactions between different scales strongly affect the inte-gral advection and the turbulent dispersion (Moran, 2000) of atmospheric pollutants at different times and distances between emission sources and impacts areas (Kallos et al., 1998; Mill´an et al., 1992, 1997, 2000; Gangoiti et al., 2001, 2002).
With respect to the representativeness of these kind of forcings (under summer anticyclonic conditions with low synoptic isobaric gradients), results from MECAPIP and RE-CAB projects showed that the Thermal Low over the Iberian Peninsula acquires a quasi-permanent character in summer and constitutes the most frequent surface meteorological sit-uation (Fig. 1, from the EC-funded RECAB project).
Because all these results show a mosaic of processes interacting at different scales synergistically, with a self-organization of the local flows at the regional level (Mill´an et al., 1997, 2002), it is necessary to consider the mesoscale circulations as a whole to be able to characterise the pollu-tant advection on mid-latitude complex terrain coastal areas (Kallos et al., 1998; Salvador et al., 1999; Gangoiti et al., 2001), (as is the case for the Spanish Mediterranean Coast). Thus, we took this approach into account to design both a modelling strategy to simulate pollutant transport and an Air Quality Forecasting System for photochemical air pollution scenarios on complex terrain (within the context of the EC-funded project FUMAPEX – “Integrated Systems for Fore-casting Urban Meteorology, Air Pollution and Population Exposure”).
The aim of the present work is thus to estimate the im-pact of applying incorrect meteorological scales when sim-ulating the behaviour of pollutant concentrations emitted in the lower layers of coastal complex terrain areas. The exper-imental data for this study were obtained during the BEMA Step 1 campaign, which used an SO2 plume emitted from
a power plant near the Castell´on conurbation (Fig. 2a) as a tracer of opportunity of the lower atmosphere. With these data we check the results of a simulation exercise using the RAMS mesoscale model coupled to the HYPACT particle model. Our results point out the dependence between the simulation of lower-layer pollutant behaviour and the ability of operational meteorological models to correctly reproduce the daily cycle of the lower atmosphere.
2 Study area
The Castell´on area (North of Valencia) is located on the east coast of the Iberian Peninsula in the Western Mediterranean Basin (Fig. 2a). The Castell´on coastal plain (characterised by irrigated-crops vegetation) is delimited on the North, at 7 km from the coast, by a mountain range averaging 780 m above sea level, m.a.s.l. (with a very steep slope towards the coastal side), and on the west, at 20-to-30 km from the coast, by the Iberian mountain range (with Mediterranean forest and a mean altitude of 1000 to 1300 m a.s.l.), which runs parallel to the coast.
Under typical summer conditions the surrounding moun-tains are strongly heated during the day favouring the de-velopment of upslope winds, which combine with the sea breezes and the compensatory flows over the coast. Dur-ing the night these processes relax and drainage flows are dominant over the surface. This typical daily cycle can be explained as a combination of local and regional forcing (Mill´an et al., 2000).
Studies on the historical meteorological data (Bolle, 2003; Palau, 2003; Mill´an et al., 2004) show that the sea-breeze cycle developes all year long under anticyclonic conditions (associated with a low synoptic isobaric gradient). Under this meteorological scenario, two predominant wind-field direc-tions occur on this site. One corresponds to the daytime sea-land breeze with an east to south-southeast direction, and the second corresponds to the night-time land-sea breeze with a west to northwest direction .
3 Methodology
3.1 Experimental setup
Within the context of the EC-funded project BEMA Step 1 (Biogenic Emissions in the Mediterranean Area), experi-mental measurements were taken using two vehicles (mobile units), both instrumented with a COrrelation SPECtrometer (COSPEC) for recording the distribution of pollutants aloft (Mill´an et al., 1976). The COSPEC is a passive remote sen-sor that uses the sunlight dispersed in the atmosphere as its radiation source . Its response is proportional to the vertically – integrated SO2concentration (throughout the optic path
be-tween the infinitum and the instrument telescope, Mill´an et al., 1977).
Measurements were taken around a power plant located near the Castell´on conurbation, 2-to-3 km from the seashore. This power plant has two 540 MW units, each with a 150 meter-tall stack. In the plume-measurement strategy, both mobile unites (vehicles) made simultaneous transects around the Castell´on conurbation at different distances from the stack (Fig. 2a). Measurements were taken throughout the day to record any changes that might occur in the plume transport direction or in the dispersive conditions. Thus, using this
(a)
26
Fig. 1. (A) Iberian Thermal Low (ITL) occurrences between 1997 and 2003; negative values
indicate that no ITL was recorded on the Iberian Peninsula, and positive values indicate the
number of ITL occurrences on each day of the month during this seven-year period. (B)
Number of ITL formations in summer during a twenty-year period (1980-2000);
disaggregation of ITL types was performed on the basis of the intensity (isobaric gradient in
the synoptic analysis charts) of the ITL formed each day. BT2 indicates the ITL highest
strength (number of days when the ITL was shown as a closed loop of low pressure at both
12:00 and 18:00 on the Iberian Peninsula) and BT0.5 indicates the number of days the thermal
low appeared just as an open loop of low pressure over the Iberian Peninsula at 12:00. BT0
indicates the number of days with no ITL formation (negative numbers in the graph). Data
was obtained from the EC-funded project RECAB (2000 - 2003); more info is available in the
final report of that project.
(b)
Fig. 1. (a) Iberian Thermal Low (ITL) occurrences between 1997 and 2003; negative values indicate that no ITL was recorded on the Iberian Peninsula, and positive values indicate the number of ITL occurrences on each day of the month during this seven-year period. (b) Number of ITL formations in summer during a twenty-year period (1980–2000); disaggregation of ITL types was performed on the basis of the intensity (isobaric gradient in the synoptic analysis charts) of the ITL formed each day. BT2 indicates the ITL highest strength (number of days when the ITL was shown as a closed loop of low pressure at both 12:00 UTC and 18:00 UTC on the Iberian Peninsula) and BT0.5 indicates the number of days the thermal low appeared just as an open loop of low pressure over the Iberian Peninsula at 12:00 UTC. BT0 indicates the number of days with no ITL formation (negative numbers in the graph). Data was obtained from the EC-funded project RECAB (2000–2003); more info is available in the final report of that project.
plume as a tracer of opportunity of the lower atmosphere, it was possible to track the daily evolution of the wind field and the dispersive conditions (as previously performed in other experiments in different regions, Mill´an et al., 1979; Guillot et al, 1979; Chung et al., 1981; Hoff et al., 1982; Portelli, 1982; Mill´an et al., 1987; Eastman et al., 1995; Palau, 2003). Moreover, there are eleven sets of measurements obtained from the Regional Air Quality Network (measuring contin-uously air pollutants and meteorological parameters), and from meteorological towers installed during the BEMA cam-paign. The available meteorological data were recorded elec-tronically every 15 min (wind direction and wind speed, at 10 m above the ground, and temperature at 2 m above the ground). Sensors are located on different sites in the study area (Fig. 2).
3.2 Model configuration
In this study we used the mesoscale meteorological model, Regional Atmospheric Modeling System (RAMS version 4.3.0 – Pielke et al., 1992) coupled to the RAMS HYbrid Particle And Concentration Transport model (HYPACT ver-sion 1.2.0 – Tremback et al., 1993). The RAMS model is quite flexible and includes different options for parameteris-ing physical processes. In this study the turbulence parame-terisation used was a TKE level 2.5 scheme (Mellor and Ya-mada, 1982). Surface layer fluxes were obtained with the Louis (1979) scheme. The shortwave and longwave radia-tion parameterisaradia-tion applied was a full-column two-stream single-band radiation scheme (Chen and Cotton, 1983). The LEAF-2 soil-vegetation model calculates the sensible, la-tent and soil heat fluxes exchanged with the atmosphere, us-ing prognostic equations for soil moisture and temperature (Walko et al., 2000).
(a)
(b) (c)
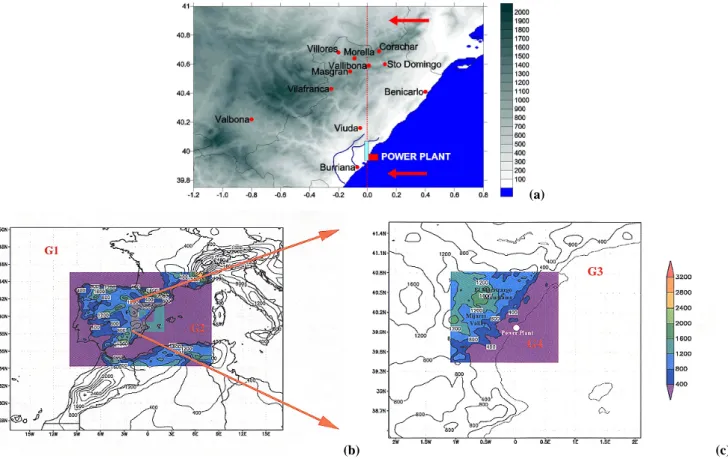
Fig. 2. (a) Study area in eastern Spain; the eleven meteorological towers providing experimental measurements are marked with red points. Vertical (longitudinal) red line indicates the transversal section used for generating Figs. 8 to 11. Road network used by the two mobile units (instrumented with a COSPEC) to take measurements around the power plant is also indicated. (b) and (c): modelling configuration with the four grids of different resolution employed in the simulations centred over the Castell´on power plant (G140.5 km, G213.5 km, G34.5 km,
G41.5 km).
Fig. 3. Modelling scheme followed during the simulation exercise. For the first meteorological simulation (S1)four domains were employed
in the meteorological model (RAMS) with two-way nesting domains. Results were obtained for grids G1to G4. To perform the HYPACT
simulations (S12 and S14), two different configurations were employed: using only the G1and G2grids from RAMS (simulation S12),
and using the four domains from RAMS (S14). The second meteorological simulation (S2)was configured with the G1and G2domains
only (two-way nested). Its solution was fed into the HYPACT particle model, generating a new solution (S22). All results are compared
and discussed in the present paper. Meteorological fields within G4and HYPACT results within S14 are used for validating purposes; meteorological fields in G2(for both meteorological simulations) and HYPACT results within S12and S22are used to evaluate the importance
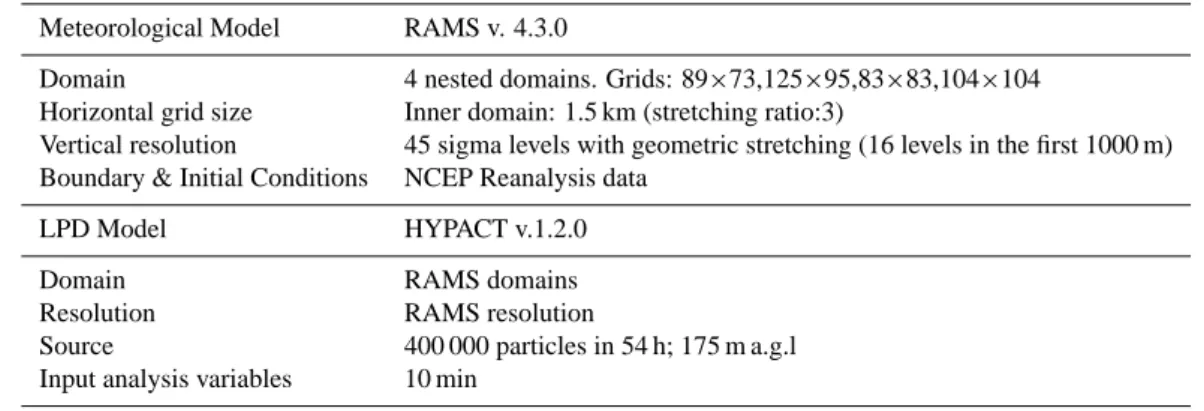
Table 1. Configuration of the Mesometeorological Model – RAMS, and the Lagrangian Particle Dispersion Model – HYPACT. Meteorological Model RAMS v. 4.3.0
Domain 4 nested domains. Grids: 89×73,125×95,83×83,104×104 Horizontal grid size Inner domain: 1.5 km (stretching ratio:3)
Vertical resolution 45 sigma levels with geometric stretching (16 levels in the first 1000 m) Boundary & Initial Conditions NCEP Reanalysis data
LPD Model HYPACT v.1.2.0
Domain RAMS domains
Resolution RAMS resolution
Source 400 000 particles in 54 h; 175 m a.g.l Input analysis variables 10 min
We performed simulations of the RAMS coupled to HY-PACT model (Tables 1 and 2) for 17, 18 and 19 July 1995, to check the effect of different meteorological approaches on the simulation of pollutant behaviour in a complex terrain coastal area. For this, two different meteorological config-urations of the RAMS model were employed, but, in both cases, the same initial and boundary conditions were used: a) Simulation 1 (S1), using four nested domains centred over
the Castell´on power plant (with grid size of: G1 (grid one)
40.5 km, G213.5 km , G34.5 km, G41.5 km), and b)
Simu-lation 2 (S2), using only the outer two nested domains (with
the same resolutions and boundaries as the aforementioned G1and G2).
It is important to note that both configurations permit two-way nesting between grids (Table 2 and Fig. 3) with the only difference between them being that simulation S1 resolves
the meteorology by considering 1.5 km as the smallest grid size while simulation S2 resolves the meteorology without
feedback from the two inner domains; i.e., by considering 13.5 km as the lowest grid size (Fig. 2b and c). Thus, the me-teorology resolved within the second grid (G2)for both
sim-ulations differs strictly in the fact that in the first case (S12),
the results are consistent with inner domains feedback (i.e., the model resolves the inner domain meteorology) while in the second simulation (S22), there is no inner domains
feed-back because G2is the highest resolution domain.
RAMS output fields were obtained every 10 min to avoid time steps too big for dispersive simulations under sea-breeze-type circulations. The HYPACT model was run us-ing the Lagrangian dispersion scheme with 3-D wind and turbulence fields provided by the three RAMS outputs (S14,
S12, and S22)(Table 2 and Fig. 3). This model was
em-ployed to both simulate the SO2 emissions from the power
plant and analyse the effect that the different meteorologi-cal fields obtained within the second domain (simulations S1
and S2) have on the dispersive pattern of the SO2 plume.
The atmospheric dispersion was simulated as emitting, at 175 m a.g.l., 400 000 particles at a constant rate for 54 h. The
Table 2. Modelling Strategy. Simulation S14was performed with
four nested domains and a 1.5 km horizontal grid size in the inner domain. Simulation S12 corresponds to the simulation within the second domain (13.5 km horizontal grid size), but considering feed-backs from the four nested domains. Simulation S22was performed with only two nested domains and a 13.5 km horizontal grid size in the inner domain.
Simulation Grid size (grid number) Nesting and grids considered S14 1.5 km (G4) 2-way; grids 1 to 4
S12 13.5 km (G2) 2-way; grids 1 to 4
S22 13.5 km (G2) 2-way; grids 1 to 2
trajectories were calculated by making use of the average wind fields, and the turbulence velocities by resolving the Langevin equation with a Markov process (Legg and Rau-pach, 1982). Uliasz (1994) provides information about the physical parameterisations developed for the HYPACT. Input analysis variables from the RAMS simulations were 10 min each. To simulate the dispersion of pollutants under different meteorological approaches, the HYPACT (Lagrangian) out-put for the first RAMS simulation (S1), the 1.5 km grid size
domain is denoted as S14; the Lagrangian output for the very
same simulation but considering only the wind fields in the first two grids, i.e. reaching the 13.5 km grid size domain, is denoted as S12 .The output for the second RAMS
simula-tion (S2; for the 13.5 km grid size domain) is denoted as S22
(Fig. 3).
3.3 Model validation
To validate these simulations, within the higher resolution domain, we followed two different and independent proce-dures, as suggested in various papers dealing with meteo-rological and air quality model validations (Willmott, 1981; Pielke, 1984; Uliasz, 1994; Stauffer and Seaman, 1990; Fast, 1995; Uliasz et al., 1996; Pielke and Uliasz, 1997; Seaman,
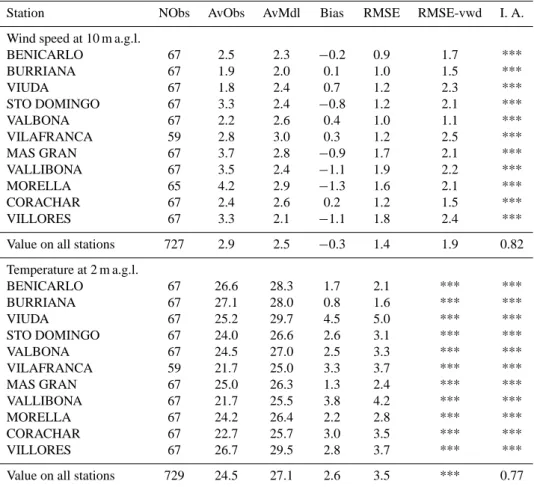
Table 3. Average observational and modelled values (AvObs and AvMdl), Bias, Root Mean Square Error (RMSE) of temperature (at 2 m a.g.l.) and wind speed (at 10 m a.g.l.), RMSE-vwd (RMSE of the horizontal vector-wind-difference), at eleven different sites (see geographical locations in Fig. 2) for the three days simulated. Value on all stations during the three simulated days has been calculated on a total of 729 values for 1 h-averaged temperature and 727 values for 1h-averaged wind speed (Nobs). In addition, the I.A. (Index of Agreement) value is calculated as the average of the eleven different sites (index of agreement of 729 pairs of values for temperature and 727 pairs of values for wind speed).
Station NObs AvObs AvMdl Bias RMSE RMSE-vwd I. A.
Wind speed at 10 m a.g.l.
BENICARLO 67 2.5 2.3 −0.2 0.9 1.7 *** BURRIANA 67 1.9 2.0 0.1 1.0 1.5 *** VIUDA 67 1.8 2.4 0.7 1.2 2.3 *** STO DOMINGO 67 3.3 2.4 −0.8 1.2 2.1 *** VALBONA 67 2.2 2.6 0.4 1.0 1.1 *** VILAFRANCA 59 2.8 3.0 0.3 1.2 2.5 *** MAS GRAN 67 3.7 2.8 −0.9 1.7 2.1 *** VALLIBONA 67 3.5 2.4 −1.1 1.9 2.2 *** MORELLA 65 4.2 2.9 −1.3 1.6 2.1 *** CORACHAR 67 2.4 2.6 0.2 1.2 1.5 *** VILLORES 67 3.3 2.1 −1.1 1.8 2.4 ***
Value on all stations 727 2.9 2.5 −0.3 1.4 1.9 0.82
Temperature at 2 m a.g.l. BENICARLO 67 26.6 28.3 1.7 2.1 *** *** BURRIANA 67 27.1 28.0 0.8 1.6 *** *** VIUDA 67 25.2 29.7 4.5 5.0 *** *** STO DOMINGO 67 24.0 26.6 2.6 3.1 *** *** VALBONA 67 24.5 27.0 2.5 3.3 *** *** VILAFRANCA 59 21.7 25.0 3.3 3.7 *** *** MAS GRAN 67 25.0 26.3 1.3 2.4 *** *** VALLIBONA 67 21.7 25.5 3.8 4.2 *** *** MORELLA 67 24.2 26.4 2.2 2.8 *** *** CORACHAR 67 22.7 25.7 3.0 3.5 *** *** VILLORES 67 26.7 29.5 2.8 3.7 *** ***
Value on all stations 729 24.5 27.1 2.6 3.5 *** 0.77
2000; Hanna and Yang; 2001). Both validation procedures utilised the simulated results obtained with the highest reso-lution domain (simulation S1, reaching grid 4) to account for
terrain influence on the atmospheric flows (Salvador et al., 1999).
The first validation exercise checked the RAMS results against the available experimental measurements of meteoro-logical parameters (temperature, wind speed and wind direc-tion) from eleven meteorological towers located within the inner domain (G4), Fig. 2a. During this first
meteorological-field validation process, the temporal series of measurements and the corresponding modelled magnitudes were plotted for visual intercomparison. Besides comparing the temporal se-ries, we also made statistical calculations (on Bias, Root Mean Square Error (RMSE), Root-Mean-Square vector-wind-difference Error (RMSE-vwd), Index of Agreement (I.A.), observed averaged (AvObvs) value and modelled av-eraged (AvMdl) value) for the temperature at 2 m above ground level (m a.g.l.) and the wind speed at 10 m a.g.l.;
Ta-ble 3). Bias (or mean bias, Pielke, 1984) is defined as the average of the simulated value minus the observed value; it quantifies the systematic error of the model. RMSE (Pielke, 1984) is the square root of the individual differences between simulated and observed values; it quantifies the accuracy of the model. RMSE-vwd (Pielke, 1984; Fast, 1995) is the RMSE of the horizontal vector-wind-difference. I.A. (Will-mott, 1981) is the ratio between the Mean Square Error and the “Potential Error” (where “Potential Error” specifies the degree to which the observed deviations in the mean obser-vation correspond, both in magnitude and sign, to the pre-dicted deviations in the mean observation). This dimension-less statistic reflects the degree to which the observed variate is accurately estimated by the simulated variate. It varies from 0.00 and 1.00.
The second validation exercise consisted of using the dispersion measurements of the plume aloft to validate the results obtained from the S14 dispersive simulations,
meteorological fields produced by RAMS and previously validated). Using the plume measurements aloft as a tracer of opportunity of the wind field at the plume transport height, the simulated dispersion results were compared with the ex-perimental measurements (taken, as described before, with two mobile units driving around the power plant at different times of the day). During this second validating process, we checked the daily evolution in the experimental and simu-lated integral advections of the plume aloft and evaluated the ability of the model to reproduce the daily cycle of the wind field (associated, as aforementioned, with the development of thermal mesoscale circulations).
4 Experimental campaign
During the campaign analysed (on 17, 18 and 19 July 1995), typical summer conditions prevailed over the Iberian Penin-sula, dominated by the influence of the Atlantic Anticy-clone, which extended towards Central-Europe and the West-ern Mediterranean Basin. Under such conditions, a zone of thermal low pressure associated with the semipermanent Sa-hara Low formed over the Iberian Peninsula.
On 17 July 1995, a complete daily cycle of the sea breeze was tracked using the SO2 emissions from the Castell´on
coastal power plant. In the present paper we discuss three situations that develop during this time period, corresponding to three different stages in the sea breeze development. The first, at 07:00 UTC, corresponds to the nocturnal drainage flow (Fig. 5); the second (not shown), at 12:00 UTC, corre-sponds to a developed sea breeze with intense convective ac-tivity (along the Mijares valley, West of the Castell´on Power Plant); the third, at 17:00 UTC, corresponds to the last ex-perimental measurements available and shows a sea breeze driven by mesoscale features (along the Rambla de la Viuda towards the El Maestrazgo Mountains, NW of the Castell´on Power Plant; Fig. 6).
The Mobile Unit (M.U.) records until 09:00 UTC locate the power plant plume South-East of the emission point, run-ning parallel to the coastline within a stable stratum of the nocturnal drainage flow (Fig. 5b).
The sea breeze develops clearly from 08:00–09:00 UTC at the site located close to the power plant. From the M.U. records at 12:00 UTC, the plume is seen to be advected in-land (flow from the East) while strong convective activity soon “disorganizes” the plume, spreading it over a wide area (not shown). The surface measurements continue to show winds from the Southeast. This is a sign of the complex ver-tical structure of the wind field, typical of Western Mediter-ranean coastal sites (as documented previously during the MECAPIP campaign; Mill´an et al., 1992).
The last M.U. record at 17:00 UTC evidences how the plume is being transported within a SE flow along the Ram-bla de la Viuda (Fig. 6b), while surface measurements at the coastal sites record ESE winds.
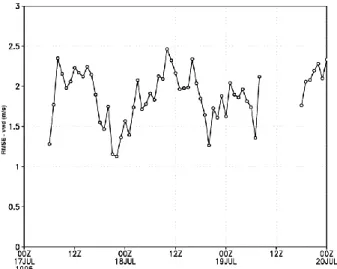
Fig. 4. Time series of the root-mean-square wind-vector-difference error (RMSE-vwd) for the near-surface wind field (10 m a.g.l.) as spatial average on all stations for simulation S1in grid G4. The
corresponding temporal average value over the three-day period is 1.9 m/s.
5 Results and discussion
5.1 Results of the validation
To validate the model skills, the simulated meteorological data on temperature, wind speed and wind direction were compared with the experimental measurements at eleven dif-ferent meteorological sites located within the inner domain, G4, (Fig. 2). In this paper, we include as representative of
the model skills within the whole inner domain, the statistics obtained for temperature and wind for the eleven meteoro-logical stations available (Table 3 and Fig. 4).
Logarithmic vertical interpolation between the lowest model layer (14 m) and the canopy temperature at the rough-ness height was performed to estimate simulated temperature at the measurements height (2 m). Although some significant differences in the model’s skills were observed at the dif-ferent stations due to terrain complexity, on average, for the temperature at 2 m a.g.l. a significant and systematic error of the model was detected (RMSE value of 3.5◦C as tempo-ral and spatial average on all stations). Therefore, bias and average values of the eleven stations show a clear overesti-mation of about 2.6◦C probably due to topography complex-ity and to deficiencies in the initialisation of the thermody-namic properties of the soil which play a role in the simu-lated local energy budget. Moreover, it is important to note that the worst-simulated temperatures were found during the nocturnal hours, probably due to limitations of the RAMS primary boundary layer (PBL) parameterisation under stable conditions. Nocturnal cooling of the lower layers of the troposphere has not been well reproduced by the model in most of the sites within the inner domain. Nevertheless,
(a)
(b) Fig. 5. Simulation S14 with an inner domain of 1.5 km, for
07:00 UTC on 17 July 1995: (a) modelling simulation results and (b) experimental measurements . During the early morning the plume is advected southward parallel to the coast within a stable stratum (nocturnal drainage winds). Black square in figure (a) indi-cates the experimental area plotted in (b). Red arrow indiindi-cates the mean plume transport direction.
index of agreement is 0.77, i.e. daily and day-to-day evo-lution of temperature, is quite well reproduced by the model. The meteorological observations of wind speed and di-rection were made at a height of 10 m a.g.l.; Louis similar-ity theory (1979) was used to adjust simulated wind speed at the height of the lowest model layer (14 m) to the mea-surements height (10 m). Under this summer three-days pe-riod (with clear skies and low surface wind speeds), the day-to-day results are fairly consistent and good results for the root-mean-square error (RMSE) of the wind speed at 10 m a.g.l. (1.4 m/s) and of the vector-wind-difference at the same height (1.9 m/s) were obtained (Table 3 and Fig. 4).
(a)
(b) Fig. 6. Simulation S14 with an inner domain of 1.5 km, for
18:00 UTC on 17 July 1995: (a) modelling simulation results and (b) experimental measurements. The plume has turned towards the North – Northwest with respect to the emission point. This time of the day corresponds to a developed sea breeze. Black square in figure (a) indicates the experimental area plotted in (b). Red arrow indicates the mean plume transport direction.
No systematic bias was observed in the model, and the mean bias value obtained (−0.3 m/s) is the result of a sharp and non-skewed distribution around zero. Coherently, the index of agreement obtained for the whole measurements for the eleven stations (727 hourly values) was 0.82 (Table 3).
It is important to note that for light wind speeds (lower than 0.5 m/s), wind directions measured at the stations are known to be variable and unreliable. This feature makes it difficult to validate the simulated drainage winds on the basis of the wind direction. Nevertheless, by using air pollutants as tracers of opportunity during consecutive daytime periods (2-to-4 days or more), it is possible to infer the nocturnal
dynamic of the winds, as well as directly validate the diurnal sea breezes (with wind speeds much higher than the noctur-nal ones).
As a first result from the validation, it is important to note that, as the index of agreement for both magnitudes (temper-ature and wind speed) is the result of a spatial and temporal average over the whole G4domain, the degree to which the
observed variate is accurately estimated by the simulate vari-ate is of 77% for temperature and of 82% for wind speed within the higher resolution domain.
Besides, before evaluating the impact of using different meteorological scales on the simulated wind fields, one fur-ther validating procedure was performed using the COSPEC SO2measurements aloft during the three-days period.
To validate the wind fields aloft and to corroborate that the high horizontal resolution used (grid size of 1.5 km) had correctly simulated the dynamic of the winds (sea breeze de-velopment and drainage winds) allowing us to reproduce the daily cycle of a point source plume on a coastal area with complex terrain, we compared the dispersive results obtained from the simulation S14(Table 2) with the experimental
mea-surements of the SO2plume aloft.
The simulations of the power plant dispersion on 17 July are able to reproduce the complete daily cycle of the sea breeze when high resolution is employed. During the early morning hours, the simulated plume is advected within a sta-ble stratum of the nocturnal drainage flowing parallel to the coast, as the experimental results show (Figs. 5a and b). At 12:00 UTC, the simulation shows how the sea breeze trans-ports the plume inland, perpendicular to the coastline, and this is also seen in the measurements (not shown). Five hours later, in the afternoon, both the simulation and the measure-ments show that the plume turns N-NW with respect to the emission point (Figs. 6a and b).
Thus, as a second validation result, a horizontal resolution that enabled us to simulate the dynamic of the winds (sea breeze development and drainage winds), allowed us to re-produce the daily cycle of a point source plume in a coastal area with complex terrain.
5.2 Effects of feedback from small scales
To check the effect that the different resolved meteorologi-cal smeteorologi-cales have on the simulation of pollutant behaviour in a complex-terrain coastal area, we compared two meteorolog-ical configurations of the RAMS model. As described before (within the “model configuration”), in both cases we have used the very same initial and boundary conditions; the only difference is that in simulation S12(Table 2) the grid-2 wind
fields are coherent with the grid-4 wind fields (because of the two-way nested configuration of the four domains); i.e., the meteorological solution in S12 has resolved the finer-scale
meteorology. Moreover, simulation S22 has no finer-scale
meteorological information because of the two-way nested configurations of just two domains (Table 2).
(a)
(b) Fig. 7. Comparison between (a) meteorological simulation within G2for simulation S1, i.e., with inner domain feedbacks and (b)
me-teorological simulation within the same grid G2but for simulation
S2, i.e., without inner domain feedbacks. In each simulation the
PBL parameterisation behaviour is different. With feedback from the two higher resolution domains, a PBL height of 800 m a.g.l. is simulated. Without any feedback from higher resolution domains, a PBL height of 2100 m a.g.l. is obtained. It is also important to note the different wind-field structure due to feedback from inner do-mains (mainly during the nocturnal hours). These time series were obtained on the vertical of the power plant.
The S12wind-field simulation shows the daily cycle of the
typical coastal flows with land-driven thermal circulations that die down during the night. In spite of the 13.5 km grid size, the early morning drainage winds to 07:00 UTC are cap-tured by the S12simulation, because of the model’s ability to
work with the information resolved within the inner domains (4.5 and 1.5 km). With the S22 simulation configuration
(without inner domains), the wind field behaviour in the lower levels is essentially different from the previous case. It is of interest to note that the drainage wind is not reproduced during the night-time in the latter case (Fig. 7b). Another
(a)
(b) Fig. 8. Longitudinal cross section, spatially indicated in Fig. 2, of the simulated plume within grid G2for both meteorological sim-ulations, S1and S2. Black line on lat. 40 N indicates the power
plant chimney height. (a) simulation S12and (b) simulation S22
of the vertical distribution of the simulated SO2at Lon 0◦for the
00:00 UTC on 18 July 1995 (beginning of the second simulated day). At lower levels, the spatial distributions of the SO2
concentra-tions are different due to the drainage effect which the S12
simula-tion resolves but the S22simulation is not able to reproduce. Great differences in SO2concentrations at ground level are observed. In
case (a) ground concentrations are due to the emissions advected inland with the sea breeze on the previous day and returned towards the coast with the drainage winds.
important feature is the difference in the behaviour of the PBL parameterisation between both simulations. While in S12 the maximum height is 800 m a.g.l., in S22 it extends to
2100 m a.g.l. (Fig. 7).
This analysis of the meteorological data shows important differences in the mesoscale model outputs between the two meteorological approaches: In the first one (S12), the
high-(a)
(b) Fig. 9. Longitudinal cross section, spatially indicated in Fig. 2, of the simulated plume within grid G2for both meteorological
sim-ulations, S1 and S2. Black line on lat. 40 N indicates the power
plant chimney height. (a) simulation S12and (b) simulation S22of the simulated SO2vertical distribution at Lon 0◦for 06:00 UTC on
18 July 1995. New emissions (plume aloft) are advected south-ward parallel to the coastline within a stable stratum of nocturnal drainage flow. Great differences in ground-level SO2
concentra-tions are observed. In case (a) ground concentraconcentra-tions are due to the emissions advected inland with the sea breeze on the previous day and returned towards the coast with the drainage winds.
resolution effects are included thanks to the two-way op-tion between grids, and in the second one (S22), the model
resolves the 13.5 km-grid resolution without any feedback from the inner domains (Fig. 7).
To check the implications of the two different meteorolog-ical approaches on the simulation of a plume from a point source located in an area like Castell´on, both model outputs were employed to run two respective HYPACT simulations.
(a)
(b) Fig. 10. Longitudinal cross section, spatially indicated in Fig. 2, of the simulated plume within grid G2for both meteorological
sim-ulations, S1and S2. Black line on lat. 40 N indicates the power
plant chimney height. (a) simulation S12and (b) simulation S22
of the vertical distribution of the simulated SO2 at Lon 0◦ for
12:00 UTC on 18 July 1995. Under convective conditions with a well-developed sea breeze, the differences between the meteoro-logical simulations of the PBL (Fig. 7) result in different mixing heights; thus, highly different plume fumigations on regions close to the point source are estimated.
The vertical distribution of the simulated SO2concentration
at Lon 0◦, from 18 July 00:00 UTC to 18 July 18:00 UTC, differs greatly in both simulations (S12versus S22).
– At 00:00 UTC: In the lower levels, the spatial
distribu-tions of the SO2concentrations are different due to the
drainage effect which the S12 simulation resolves but
the S22simulation is not able to reproduce (Fig. 8).
– At 06:00 UTC: New emissions (plume aloft) are
ad-vected parallel to the coastline within a stable stratum
(a)
(b) Fig. 11. Longitudinal cross section, spatially indicated in Fig. 2, of the simulated plume within grid G2for both meteorological
simu-lations, S1and S2. Black line on lat. 40N indicates the power plant
chimney height. (a) simulation S12and (b) simulation S22of the vertical distribution of the simulated SO2at Lon 0◦for 18:00 UTC
on 18 July 1995. At the end of the daytime period on the second simulated day, differences between the simulations with respect to the maximum concentration height become evident. In the first case (with inner domain feedback) plume fumigations have higher con-centrations than in the second case (without feedback from higher resolution domains). Moreover, the return flows of the sea breeze aloft are located at different heights and the simulated plumes aloft are located in different locations according to whether or not feed-back effects are considered (differences in the mean plume axis of more than 0.7◦).
of nocturnal drainage flow towards the South. Ground concentrations (emitted the previous day and swept to-wards the coast with the surface nocturnal winds) drain towards the South (Fig. 9).
– At 12:00 UTC: A major difference is that S12 shows
significant impacts close to the point source, but S22
shows no major impacts on the ground (Fig. 10).
– At 18:00 UTC: In S22 the maximum concentration
ex-tends between 1200 and 1800 m in height while in S12
it reaches 1000 m with significant impacts close to the point source due to strong convective activity (Fig. 11). These results show that in a coastal complex terrain area, the wind flow and the boundary layer estimated by the mod-els can be very different depending on the meteorological scale resolved, which conditions strongly the pollutant be-haviour simulated by the HYPACT Particle Model. The re-sults shown were obtained on the basis of a release of parti-cles at 175 m a.g.l (according to the estimated plume height), however, when we changed the release height to 25 m a.g.l, in order to represent the emission height of any urban pollutant, we obtained similar results (not shown). Thus, a model’s ability to simulate the behaviour of pollutants emitted in the Castell´on area, at least in the first 200 m a.g.l., will depend highly on its ability to correctly reproduce the daily cycle of the lower atmosphere.
These results are relevant in light of the fact that some of the meteorological approaches commonly considered to forecast urban air pollution episodes do not take into account the importance of the smaller scales for explaining the mete-orology of sites like the Spanish Mediterranean coasts.
6 Conclusions
The availability of both 10 m a.g.l. meteorological data and experimental measurements aloft obtained by means of a vehicle equipped with a remote sensor, enabled us to vali-date a high-resolution simulation (S14; with a grid size of
1.5 km) of the daily behaviour of a Power Plant Plume (lo-cated in a coastal complex-terrain area) by means of the RAMS mesoscale model coupled with the HYPACT particle model.
This double model-validation procedure produced two main results: A) We were able to evaluate the degree to which the observed variate was accurately estimated by the simulated variate (index of agreement) on eleven sites lo-cated within the high-resolution domain, obtaining values of 77% for temperature and 82% for wind speed; and B) we were able to reproduce the daily cycle of a point-source plume in a coastal area with complex terrain because the highest horizontal resolution used enabled us to simulate the dynamic of the winds (sea breeze development and drainage winds).
Two additional simulations of the coupled models were performed using a grid size of 13.5 km. In the first of these (S12)the high-resolution effects were included thanks to the
ability of the model to work with two-way interactions be-tween inner domains, while in the second (S22)there were
no feedback effects with finer scales. As a result, in our sim-ulation of pollutant dispersion in the lower layers of the at-mosphere in a coastal complex-terrain area, we were able to compare the effects of two different meteorological ap-proaches regarding the scales resolved. The main differences obtained were:
– Pollutant advections in the S12and S22simulations
dif-fer greatly during the early morning due to the difdif-fer- differ-ence in the drainage winds. This differdiffer-ence accumulates throughout the daily cycle because the emissions ad-vected during the drainage flows are swept inland with the diurnal sea breeze development.
– The vertical distribution of the simulated SO2
concen-tration is very different in both simulations as a conse-quence of the discrepancies in PBL parameterisation be-haviour: the S12 simulation predicts much higher
con-centration values for the lower layers than the simula-tion without high-resolusimula-tion effects.
The results show that in a complex-terrain coastal site, be-cause of the strong effect of the meteorological interactions between the different scales on the integral advection and the turbulent dispersion of pollutants, using an inadequate scale to solve the meteorology can result in a very big gap in the simulation of lower-layer pollutant behaviour at urban scales.
Acknowledgements. This paper is dedicated in memoriam to D.
Vicente Palau Blay (1929–2005). The authors would like to ac-knowledge the people from the Fundaci´on CEAM who participated in the field measurements campaign. We are also indebted to M.-J. Sanz for kindly providing the RECAB-data for Fig. 1 and her continuous and valuable comments and support. This study has been mainly funded by the EC-research project FUMAPEX-EVK4-CT-2002-00097, by the Ministerio de Ciencia y Tecnologia (Spain) REN2002-10681-E, and by the Generalitat Valenciana research project MEDICO-GV04B-069. The Commission of the European Communities also supported the experimental campaigns under the BEMA Step 1 project (1994–1995) 11096.95.07 F1PC.ISP E. The CEAM foundation is supported by the Generalitat Valenciana and BANCAIXA (Val`encia, Spain).
Edited by: A. Baklanov
References
AIR4EU.: Recommendations on Air Quality assessment by moni-toring and modelling for regulated pollutants in Europe, Frame-work Programme VI, 2004–2006, http://www.air4eu.nl/index. html, 2004.
Alonso, L., Gangoiti, G., Navazo, M., Mill´an, M. M., and Mantilla, E.: Transport of tropospheric ozone over the bay of Biscay and the eastern Cantabrian coast of Spain, J. Appl. Met., 39 (4), 475– 486, 2000.
Assai, T. and Mitsumoto, S.: Effects of an inclined land surface on the land and sea breeze circulation: A numerical experiment, J. Met. Soc. Jpn., 56, 559–570, 1978.
Atkinson, B. W.: Meso-Scale Atmospheric Circulations, Academic Press, 1–445, 1981.
BEMA (I): Biogenic Emissions in the Mediterranean Area, EU-funded project, Contrat: 11096.95.07 F1PC.ISP E., 1994–1995. Bolle, H. J. (Ed.): Mediterranean climate: Variability and trends,
Chapter 1, Springer-Verlag, Berlin (Germany), 2003.
Chaxel, E., Brulfert, G., Chemel, C., and Chollet, J. P.: Simula-tion of air quality in Chamonix valley (France): Impact of the road traffic of the tunnel on ozone production, 9th Conference on harmonisation within atmospheric dispersion modelling for regulatory purposes, Garmisch-Partenkirchen, Germany, 2004. Chen, C. and Cotton, W. R.: A one-dimensional simulation of the
stratocumulus-capped mixed layer, Boundary-layer Meteorol., 25, 289–321, 1983.
Chung, Y. S., Gallant, A., Fanaki, F., and Mill´an, M. M.: On the ob-servation of Mount St. Helens Volcanic emissions, Atmosphere-Ocean, 19 (2), 172–178, 1981.
COBRA2000: CO2 budget and rectification airborne: Airborne
measurements of regional to continental fluxes of CO and CO2, USA, http://www-as.harvard.edu/chemistry/cobra/, 2005. COBRA-NA2003: CO2 budget and rectification airborne study:
North America 2003, USA, http://www-as.harvard.edu/ chemistry/cobra/, 2005.
Dupont, E., Menut, L., Carissimo, B., Pelon, J., and Flamant, P.: Comparison between the atmospheric boundary layer in Paris and its suburbs during the ECLAP experiment, Atmos. Environ., 33, 979–994, 1999.
Eastman, J. L., Pielke, R. A., and Lyons, W. A.: Comparison of lake-breeze model simulations with tracer data, J. Appl. Met., 34, 1398–1418, 1995.
ECLAP: ´Etude de la Couche Limite en Agglom´eration Parisienne (Study of the Boundary Layer over the Paris Area), 1994–1995, This experiment is a partnership between the three French lab-oratories: Service d’A´eronomie [CNRS/Paris/Jussieu], Labora-toire de Meteorologie Dynamique [CNRS/Palaiseau], Environ-ment Service of EDF [Chatou], http://euler.lmd.polytechnique. fr/menut/eclap95/eclap95eng.html, 2005.
ESCOMPTE: Exp´erience sur site pour contraindre les mod`eles de pollution atmospherique et de transport d’emissions, France, http://medias.obs-mip.fr/escompte/projet/index, Special Issue in Atmospheric Research, 74 (1–4), March 2005.
Fast, J. D.: Mesoscale modeling in areas of highly complex ter-rain employing a four-dimensional data assimilation technique, J. Appl. Met., 34, 2762–2782, 1995.
Fast, J. D. and Zhong, S.: Meteorological factors associated with inhomogeneous ozone concentrations within the Mexico City basin, J. Geophys. Res., 103 (D15), 18 927–18 946, 1998. Fiore, A. M., Jacob, D. L., Bey, I., Yantosca, R. M., Field, B.
D., Fusco, A. C., and Wilkinson, J. G.: Background ozone over the United States in summer: Origin, trend and contri-bution to pollution episodes, J. Geophys. Res., 107, D(15), doi:10.1029/2001JD000982, 2002.
FUMAPEX: Integrated Systems for Forecasting Urban Meteorol-ogy, Air Pollution and Population Exposure, Funded by the Eu-ropean Commission, 2002–2005, http://fumapex.dmi.dk/, 2005. Gangoiti, G., Alonso, L., Navazo, M., Albizuri, A., P´erez-Landa,
G., Matabuen, M., Valdenebro, V., Maruri, M., Garc´ıa, J. A., and Mill´an, M. M.: Regional transport of pollutants over the bay of Biscay: Analysis of an ozone episode under a blocking
anticy-clone in west-central Europe, Atmos. Environ., 36, 1349–1361, 2002.
Gangoiti, G., Mill´an, M. M., Salvador, R., and Mantilla E.: Long-Range transport and re-circulation of pollutants in the western Mediterranean during the project Regional Cycles of Air Pollu-tion in the west-central Mediterranean Area, Atmos. Environ., 35, 6267–6276, 2001.
Gerbig, C., Lin, J. C., Wofsy, S. C., Daube, B. C., Andrews, A. E., Stephens, B. B., Bakwin, P. S., and Grainger, C. A.: To-ward constraining regional-scale fluxes of CO2with atmospheric observations over a continent: 1. Observed spatial variability from airbone platforms, J. Geophys. Res., 108 (D24), 4756, doi:10.1029/2002JD003018, 2003.
Guillot, P., Bonometti, G., Hasenjaeger, H., Van der Meulen, A., Hamilton, P. M., Haulet, R., Laurent, J., Sandroni, S., Cerutti, C., Giovanelli, G., Tirabassi, T., Vittori, O., and Piccinini, P.: First European Community campaign for remote sensing of at-mospheric pollution, Lacq (France), 7–11 July 1975, Atmos. En-viron., 13, 895–917, 1979.
Hanna, S. R. and Yang, R.: Evaluation of mesoscale models’ simu-lations of near-surface winds, temperature gradients, and mixing depths, J. Appl. Met., 40, 1095–1104, 2001.
Hoff, R. M., Trivett, N. B. A., Mill´an, M., Fellin, P., Anlauf, K. G., and Wiebe, H. A.: The Nanticoke shoreline diffusion experiment, June 1978-III. Ground-based air quality measurements, Atmos. Environ., 16 (3), 439–454, 1982.
Kallos, G., Kotroni, V., Lagouvardos, K., and Papadopoulos, A.: On the Long-Range Transport of air pollutants from Europe to Africa, Geophys. Res. Lett., 25 (5), 619–622, 1998.
Kurita, H., Sasaki, K., Muroga, H., Ueda, H., and Wakamatsu, S.: Long-range transport of air pollution under light gradient wind conditions, J. Clim. Appl. Met., 24, 425–434, 1985.
Lalas, D. P., Asimakopoulos, D. N., Deligiorgi, D. G., and Helmis, C. G.: Sea-breeze circulation and photochemical pollution in Athens, Greece, Atmos. Environ., 17, 621–632, 1983.
Legg, B. J. and Raupach, M. R.: Markov-chain simulation of par-ticle dispersion in inhomogeneous flows: the mean drift velocity induced by a gradient in Eulerian velocity variance, Boundary-Layer Meteorol., 24, 3–13, 1982.
Louis, J. F.: A parametric model of vertical eddy fluxes in the atmo-sphere, Boundary-Layer Meteorol., 17, 187–202, 1979. Mahrer, Y. and Pielke, R. A.: The effects of Topography on sea and
land breezes in a two-dimensional numerical model, Mon. Wea. Rev., 9, 1151–1162, 1977.
MAP-Riviera: Mesoscale Alpine Programme, Swiss National Sci-ence Foundation, 1999, http://www.iac.ethz.ch/en/research/map riviera/, 2005.
Mart´ın, M., Plaza, J., Andr´es, M. D., Bezares, J. C., and Mill´an, M. M.: Comparative study of seasonal air pollutant behaviour in a mediterranean coastal site: Castell´on (Spain), Atmos. Environ., 25A (8), 1523–1535, 1991.
MECAPIP: Mesometeorological cycles of air pollution in the Iberian Peninsula, Funded by the European Commission, 1988– 1991.
MEDUSE: Monitoring and prediction of the atmospheric transport and deposition of desert dust in the Mediterranean Region, Sup-ported by the DG-XII of the EU, 1996–1998.
Mellor, G. L. and Yamada, T.: Development of a turbulence clo-sure model for geophysical fluid problems, Rev. Geophys. Space
Phys., 20, 851–875, 1982.
Menut, L., Coll, I., and Cautenet, S.: Impact of meteorological data resolution on the forecasted ozone concentrations during the ES-COMPTE IOP2a and IOP2b, Atmos. Res., 74, 139–159, 2005. Menut, L., Flamant, C., and Pelon, J.: Evidence of interaction
be-tween synoptic and local scales in the surface layer over the Paris area, Boundary-Layer Meteorol., 93, 269–286, 1999.
Mill´an, M. M.: Ozone dynamics in the Mediterranean basin. A col-lection of scientific papers resulting from the MECAPIP, RE-CAPMA and SECAP Projects, Air Pollution Research Report 78, Brussels, 2002.
Mill´an, M. M.: Passive remote sensing of SO2, Proceedings from the EPA seminar - Workshop on prolonged elevated pollution episodes (PEPE), 19–23 March, 406–424, 1979.
Mill´an, M. M. and Hoff, R. M.: Dispersive correlation spec-troscopy: a study of mask optimization procedures, Appl. Opt., 16, 1609–1618, 1977.
Mill´an, M. M., Alonso, L. A., Legarreta, J. A., Albizu, M. V., Ureta, I., and Egusquiaguirre, C.: A fumigation episode in an industri-alized estuary: Bilbao, November 1981, Atmos. Environ., 18 (3), 563–572, 1984.
Mill´an, M. M., Mantilla, E., Salvador, R., Carratal´a, A., Sanz, M.J., Alonso, L., Gangoiti, G., and Navazo, M.: Ozone cycles in the Western Mediterranean basin: Interpretation of monitoring data in complex coastal terrain, J. Appl. Met., 39 (4), 487–508, 2000. Mill´an, M. M., Otamendi, E., Alonso, L., and Ureta, I.: Experimen-tal characterization of atmospheric diffusion in complex terrain with land-sea interactions, International Journal of Air Pollution and Hazardous Waste Management, 37 (7), 807–811, 1987. Mill´an, M. M., Arti˜nano, B., Alonso, L., Navazo, M., and Castro,
M.: The effect of meso-scale flows on regional and long-range atmospheric transport in the western Mediterranean area, Atmos. Environ., 25A, 949–963, 1991.
Mill´an, M. M., Arti˜nano, B., Alonso, L., Castro, M., Fernandez-Patier, R., and Goberna, J.: Meso-Meteorological Cycles of Air Pollution in the Iberian Penisula, (MECAPIP) (Air Pollution Re-search Report 44, EUR No. 14834), European Commision DG XII/E-1, Rue de la Loi, 200, B-140, Brussels, 1992.
Mill´an, M. M., Salvador, R., Mantilla, E., and Arti˜nano, B.: Meteo-rology and photochemical air pollution in southern Europe: Ex-perimental results from EC research projects, Atmos. Environ., 30 (12), 1909–1924, 1996.
Mill´an, M. M., Salvador, R., Mantilla, E., and Kallos, G.: Photoox-idants dynamics in the Mediterranean basin in summer: results from European research projects, J. Geophys. Res., 102 (D7), 8811–8823, 1997.
Mill´an, M. M., Sanz, M. J., Calatayud, V., Palau, J. L., Di´eguez, J. J., P´erez-Landa, G., Mantilla, E., Cerver´o, J., and Chord´a, J. V.: La calidad del aire en las comarcas de Els Ports-Maestrat, (Air quality in the Els Ports-Maestrat region), in Spanish, edited by: CEAM Foundation, 1–408, 2004.
Mizzi, A. P. and Pielke, R. A.: A numerical study of the mesoscale atmospheric circulation observed during a coastal upwelling event on 23 August, 1972, Part I: Sensitivity studies, Mon. Wea. Rev., 112, 76–90, 1984.
Moran, M. D.: Basic aspects of mesoscale atmospheric dispersion, in: Mesoscale atmospheric dispersion, edited by: Boybeyi, Z., Wit Press, London, 2000.
Ookouchi, Y., Uryu, M., and Sawada, R.: A numerical study of the effects of a mountain on land sea breezes, J. Met. Soc. Jpn., 56, 368–385, 1978.
PACIFIC2001: Air quality field study, Georgia Basin, Canada, Au-gust 2001, http://www.smc-msc.ec.gc.ca/projects/pacific2001/ index e.html, 2005.
Palau, J. L.: Dispersi´on atmosf´erica de las emisiones de una chime-nea alta en terreno complejo (Atmospheric dispersion of a tall-stack plume on complex terrain), PhD Thesis (in Spanish), Uni-versity of Valencia (Spain), edited by: CEAM Foundation, 366, 2003.
Pielke, R. A. and Uliasz, M.: Use of meteorological models as input to regional and mesoscale air quality models – limitations and strengths, Atmos. Environ., 32, 1455–1466, 1997.
Pielke, R. A.: Mesoscale meteorological modeling, 1st Edition Aca-demic Press, New York, N.Y., USA, 1–612, 1984.
Portelli, R. V.: The Nanticoke shoreline diffusion experiment, June 1978-I, Experimental design and program overview, Atmos. En-viron., 16 (3), 413–421, 1982.
POVA: POllution in Alpine Valleys, supported by Air de l’Ain et des Pays de Savoie, R´egion Rhˆone Alpes, launched in 2000. RECAB: Regional Assessment and Modelling of the CARbon
Balance within Europe, Funded by the European Commission, 2000–03.
RECAPMA: Regional cycles of air pollutants in the West-Central Mediterranean area, Funded by the European Commission, 1990–92.
Rotach, M. W., Calanca, P., Graziani, G., Gurtz, J., Steyn, D. G., Vogt, R., Andretta M., Christen, A., Cieslik, S., Connolly, R., De Wekker, S. J. F., Galmarini, S., Kadygrov, E. N., Kadygrov, V., Miller, E., Neininger, B., Rucker, M., Van Gorsel, E., We-ber, H., Weiss, A., and Zappa, M.: Turbulence structure and ex-change processes in an Alpine valley, The Riviera Project. Severe convective storms, Meteorological monograph no. 50, American Meteorological Society, 1367–1385, 2004.
Salvador, R., Calb´o, J., And Mill´an, M. M.: Horizontal grid size se-lection and its influence on mesoscale model simulation, J. Appl. Met., 38 (9), 1311–1329, 1999.
Seaman, N. L.: Meteorological Modelling for Air-Quality Assess-ments, Atmos. Environ., 34, 2231–2259, 2000.
SECAP: South European cycles of air pollution, Support from the Directorate General XII of EU, 1992–1994.
Segal, M. , Yu , C.-H., Arritt, R. W., and Pielke, R. A.: On the impact of valley/ridge thermally induced circulations on regional pollutant transport, Atmos. Environ., 22, 471–486, 1988a. Segal, M., Avissar, R., McCumber, M. C., and Pielke, R. A.:
Evalu-ation of vegetEvalu-ation effects on the generEvalu-ation and modificEvalu-ation of mesoscale circulations, J. Atmos. Sci., 45, 2268–2292, 1988b. Snyder, B.: Meteorological summary of the PACIFIC 2001 air
quality field study, Atmospheric Science Section, Environmental Conservation Branch, Pacific and Yukon Region, Environment Canada, 2002.
Stauffer, D. R. and Seaman, N. L.: Use of four-dimensional data assimilation in a limited-area mesoscale model. Part I: Exper-iments with synoptic-scale data, Mon. Wea. Rev., 118, 1250– 1277, 1990.
Steyn, D. G.: Air pollution in coastal cities, in Air Pollution Mod-eling and its Application XI, Plenum Press, New York, 505–517, 1996.
TRACT: Transport of Pollutants over Complex Terrain – EUROTRACT-1 (The European Experiment on the Transport and Transformation of Environmentally Relevant Trace Con-stituents over Europe) subproject, Joint project with the EC, 1986–1995.
T-TRAPEM: Transport and transformation of air pollutants from Europe to the Mediterranean Region, AVICENNE Initiative, Supported by the DG XII of EU, 1993–1995.
Uliasz, M.: Lagrangian particle modeling in mesoscale applica-tions, Environmental Modeling II, edited by: Zannetti, P., Com-putational Mechanics Publications, 71–102, 1994.
Uliasz, M., Socker, R. A., and Pielke, R. A.: Regional modeling of air pollution transport in the southwestern United States, Envi-ronmental Modeling III, edited by: Zannetti, P., Computational Mechanics Publications, 145–182, 1996.
VOTALP: Vertical ozone transports in the Alps – VOTALP I (1996– 1998) VOTALP II (1998–2000), Funded by the European Com-mission under Framework Programme IV, Environment and Cli-mate, and by the Government of Switzerland, http://www.boku. ac.at/imp/votalp/, 2005.
Walko, R. L., Band, L. E., Baron, J., Kittel, T. G. F., Lammers, R., Lee, T. J., Ojima, D., Pielke Sr., R. A., Taylor, C., Tague, C., Tremback, C. J., and Vidale, P. J.: Coupled atmospheric-biophysics-hydrology models for environmental modeling, J. Appl. Met., 39, 931–944, 2000.
Weigel, A. P., Chow, F. K., Rotach, M. W., Street, R. L., and Xue, M.: High-resolution Large-Eddy Simulation of the Riviera val-ley: Assesment of the flow structure and the heat and mois-ture budgets, 11th Conference on Mountain Meteorology and the Annual Mesoscale Alpine Program (MAP), American Me-teorological Society, USA, http://www.ametsoc.org/meet/fainst/ 11mountain.html, 2004.
Weigel, A. P. and Rotach, M. W.: Flow structure and turbulence characteristics of the daytime atmosphere in a steep and narrow Alpine valley, Quat. J. Royal Met. Soc., 130, No. 62, 2605–2627, 2004.
Whiteman, C. D.: Breakup of temperature inversions in deep moun-tain valleys: Part I. Observations, J. Appl. Met., 21, 270–289, 1982.
Willmott, C. J.: On the validation of models, Physical Geography, 2 (2), 184–194, 1981.