HAL Id: hal-01407271
https://hal.archives-ouvertes.fr/hal-01407271
Submitted on 5 Dec 2016
HAL is a multi-disciplinary open access
archive for the deposit and dissemination of
sci-entific research documents, whether they are
pub-lished or not. The documents may come from
teaching and research institutions in France or
abroad, or from public or private research centers.
L’archive ouverte pluridisciplinaire HAL, est
destinée au dépôt et à la diffusion de documents
scientifiques de niveau recherche, publiés ou non,
émanant des établissements d’enseignement et de
recherche français ou étrangers, des laboratoires
publics ou privés.
Generation of shear waves by laser in soft media in the
ablative and thermoelastic regimes
Pol Grasland-Mongrain, Yuankang Lu, Frédéric Lesage, Stefan Catheline, Guy
Cloutier
To cite this version:
Pol Grasland-Mongrain, Yuankang Lu, Frédéric Lesage, Stefan Catheline, Guy Cloutier. Generation
of shear waves by laser in soft media in the ablative and thermoelastic regimes. Applied Physics
Letters, American Institute of Physics, 2016, 109 (22), pp.1901. �10.1063/1.4968538�. �hal-01407271�
Thermoelastic Regimes.
Pol Grasland-Mongrain1, Yuankang Lu1,2, Frederic Lesage2,3, Stefan Catheline4, Guy Cloutier1,3,5
(1) Laboratory of Biorheology and Medical Ultrasonics, Montreal Hospital Research Center, Montreal (QC), H1X0A9, Canada
(2) Departement of Electrical Engineering, ´Ecole Polytechnique of Montreal, Montreal (QC), H3C3A7, Canada
(3) Institute of Biomedical Engineering, ´Ecole Polytechnique and University of Montreal, Montreal (QC),
H3T1J4, Canada
(4) Laboratory of Therapeutic Applications of Ultrasound, Inserm u1032, Inserm, Lyon, F-69003, France (5) Departement of Radiology, Radio-oncology and Nuclear Medicine, University of Montreal, Montreal (QC), H3C3J7, Canada
(Dated: December 5, 2016)
This article describes the generation of elastic shear waves in a soft medium using a laser beam. Our
experiments show two different regimes depending on laser energy. Physical modeling of the underlying phenomena reveals a thermoelastic regime caused by a local dilatation resulting from temperature increase, and an ablative regime caused by a partial vaporization of the medium by the laser. Computed theoretical displacements are close to experimental measurements. A numerical study based on the physical modeling gives propagation patterns comparable to those generated experimentally. These results provide a physical basis for the feasibility of a shear wave elastography technique (a technique which measures a soft solid stiffness from shear wave propagation) by using a laser beam.
When a laser beam of sufficient energy is incident on a medium, the absorption of the electromagnetic radia-tion leads to an increase in the local temperature. Due to thermal effects, displacements occur in the medium, which can then propagate as elastic waves. Elastic waves within a bulk can be separated into two components: compression waves, corresponding to a curl-free propaga-tion, and shear waves, corresponding to a divergence-free
propagation1. Measures of the transmission
characteris-tics of compression and shear waves are useful for inspect-ing solids, such as a metal, to reveal potential cracks or
defects21. In biological tissues, induction of compression
waves by laser has been studied with the development of
photoacoustic imaging23. Elastic waves used in
photoa-coustic imaging are typically of a few megahertz; at this frequency, shear waves are quickly attenuated in soft tis-sues, typically over a few microns, and only compression waves can propagate over a few centimeters.
While the induction of surface acoustic waves by laser
in soft tissues was recently demonstrated by Li et al.9,10,
a similar phenomenon with shear waves in bulk medium has never been described. This is of great interest for
the shear wave elastography technique. As its name
indicates, shear wave elastography comprises the tech-niques used to map the elastic properties of soft
me-dia using shear wave propagation18,15,4. These
tech-niques typically use low frequency (50-500 Hz) shear waves so that their propagation can be observed over a few centimeters. The shear waves are currently gener-ated using either an external shaker or a focused acoustic wave. However, alternative shear wave generation meth-ods have drawn important attention recently. For ex-ample, it has been demonstrated that one can use
nat-ural motion of the medium8,24, the Lorentz force3,7,6or
electrolysed-induced bubbles14. Compared to these
gen-eration sources, a laser presents the advantage of being fully remote, without need of coupling gel; and of being miniaturizable at low cost using an optical fiber.
In our experiment, illustrated in Figure 1, we used a Q-switch Nd:YAG laser (EverGreen 200, Quantel, Les Ulis, France) to produce a 10-ns pulse of 10 to 200 mJ energy at a central wavelength of 532 nm in a 5-mm diameter
cir-cular beam. The laser beam was absorbed in a 4x8x8 cm3
black mat phantom composed of water, 5% polyvinyl al-cohol, and 1 % black graphite powder. Two freeze/thaw cycles were applied to stiffen the material to a shear
mod-ulus of 25±5 kPa5. To observe the resulting shear waves,
the medium was scanned simultaneously with a 5-MHz ultrasonic probe, consisting of 128 elements, connected to a multi-channeled ultrasound scanner (Verasonics V-1, Redmond, WA, USA), and placed on the other side of the sample. The probe was acquiring 4000 ultrasound images per second during 30 ms. Due to the presence of graphite particles, the medium presented a speckle pat-tern on the ultrasound image.The computation of dis-placements along the Z axis (the ultrasound axis) was computed by tracking the speckle spots with the
Lucas-Kanade method12. This method solves basic optical flow
equations by least squares criterion in a window of 64*5 pixels centered on each pixel. Displacements over time were then filtered from 200 to 800 Hz using a 5th-order Butterworth filter and averaged over four experiments.
Figure 2 illustrates the resulting displacement ampli-tude maps observed along the ultrasound axis at 1.0, 1.5, 2.0, 2.5, and 3.0 ms after laser emission for two laser beam energies (10 and 200 mJ). Displacements reached an am-plitude of 0.02 µm for the 10-mJ laser beam and 2.5 µm for the 200-mJ laser beam. They propagated at a
veloc-ity of 5.5±0.5 m.s−1, which is typical for a shear wave,
2 Speckle-tracking algorithm Laser beam (532 nm) Ultrasound probe Shear waves
Displacement mapstime time
Y Z X Ultrasound images Thermoelastic regime (a) Ablative regime (b)
Figure 1. Experimental setup. A laser beam is emitted on a soft medium. This generates shear waves following (a) ther-moelastic and/or (b) ablative regimes. The medium is ob-served with an ultrasound probe. A speckle-tracking algo-rithm calculates displacements from the ultrasound images.
wave (about 1500 m.s−1 in soft tissues). Shear modulus
can then be calculated using the relationship vs=pµ/ρ.
Supposing the medium density, ρ, at 1000 kg.m−3
(wa-ter density), the propagation velocity corresponds to a shear modulus of 30±5 kPa, which is in the range of the expected value for this phantom. Shear wave frequency spectrum was centered at 500 ± 50 Hz.
Careful observation reveals several differences in the propagation patterns of the two laser beam energies. At low energy, first central displacements are directed to-wards the outside of the medium (left arrow), and three
half cycles are observed. Conversely, at high energy,
first displacements are directed towards the inside of the medium (right arrow), and only two half cycles can be observed. Position Y (m m ) Positio n Y (m m ) 1.0 ms 1.5 ms 2.0 ms 2.5 ms 3.0 ms Position Z (mm) 20 -20 0 0 20 -20 0 -.02 .02 2.5 -2.5 0 10 20 0 µm µm 10 20 0 0 10 200 10 200 10 20 (A) (B) Position Z (mm) 10 20 0 0 10 200 10 200 10 200 10 20 1.0 ms 1.5 ms 2.0 ms 2.5 ms 3.0 ms
Figure 2. Experimental displacement amplitude maps along the Z axis with a (A)-10 mJ or (B) 200-mJ laser beam, 1.0, 1.5, 2.0, 2.5 and 3.0 ms after laser emission in the tissue-mimicking phantom. In both cases, direction of the initial central displacements is indicated in the white circle.
Let’s examine now the physical phenomena involved in
these experiments. The optical intensity, I0, of the laser
beam is defined as I0= S1dEdt, where S is the beam surface
and E is the beam energy. When emitted on the surface of a medium and in the absence of reflection, the laser beam is absorbed with an exponential decay as a function
of the medium depth z: I(z) = I0exp(−γz), where γ is
the absorption coefficient of the medium. We have exper-imentally estimated γ by measuring the fraction of light transmitted through different slices of the medium (with thicknesses of 0, 30, 50, and 100 µm) with a laser beam energy-measurement device (QE50LP-S-MB-D0 energy
detector, Gentec, Qu´ebec, QC, Canada). We found
re-spective transmitted powers of 100%, 42%, 28%, and
11%, which gives γ−1 ≈ 40 µm in our sample as
indi-cated by an exponential fit.
Absorption of the laser beam by the medium subse-quently gives rise to an absorbed optical energy, γI. As-suming that all the optical energy is converted to heat, a local increase in temperature occurs. Temperature distri-bution, T , in the absence of convection and phase transi-tion, can be computed using the following heat equation:
k∇2T = ρC∂T
∂t − γI (1)
where k is the thermal conductivity, ρ is the density, C is the heat capacity and t is the time. Calculating the exact solution to this equation is beyond the scope of this article, but we can roughly approximate the first and
sec-ond terms to be kT /γ2 and ρCT /τ , respectively, during
laser emission. Given that k = 0.6 W.m−1.K−1 (water
thermal conductivity), ρ = 1000 kg.m−3(water density),
C = 4180 J.kg−1.m−3 (water heat capacity), γ−1 ≈ 40
µm and τ = 10 ns, the first term is negligible compared to the second one. Substituting low-energy experimental
parameters (E = 10 mJ, S = 20 mm2) leads to a
max-imum increase in temperature of 3 K, which produces a local dilatation of the medium. The induced displace-ments can then generate shear waves, which constitutes the thermoelastic regime.
To estimate the initial displacement amplitude in this regime, we assumed the medium as homogeneous and
isotropic. As the depth of absorption (about 40 µm)
is 100 times smaller than the beam diameter (5 mm),
we discarded any boundary effects. The stress, σzz, is
the sum of the axial strain component and the thermal
expansion component20: σzz= (λ + 2µ) ∂uz ∂z − 3(λ + 2 3µ)α E ρCSζ (2)
where λ and µ are respectively the first and second
Lam´e’s coefficients, α is the thermal dilatation
coeffi-cient, and ζ is the average depth of absorption. This equation can be simplified by the fact that in most soft media, including biological tissues, µ λ. More-over, in the absence of external constraints normal to the surface, the stress across the surface must be zero,
i.e. σzz(z = 0) = 0. This allows the equation 2
to be integrated, giving at the surface a displacement
uz = 3αE/(ρCS). Substituting the same experimental
(water linear thermal dilatation coefficient), we obtain a
displacement uz of 0.025 µm. This value is very close
to the measured experimental displacement (about 0.02 µm). Note that both the experimental and theoretical central displacements are directed towards the outside of the medium (see white circle arrow in Figures 2-(A) and 3-(A)).
To calculate the propagation of the displacements as shear waves, we must consider the transverse dilatation. Indeed, the illuminated zone is a disk of 5 mm in diam-eter with a thickness of about 40 µm (average depth of absorption along Z axis). The dilatation stress is conse-quently about two orders of magnitude stronger along the transverse direction than along the Z axis: to compute the displacements along time, we neglected the stress along the Z axis and only considered the stress in the transverse direction. We modeled thus the thermoelastic regime in 2D as two opposite forces directed along the Y axis with a depth of 40 µm and with an amplitude de-creasing linearly respectively from 2.5 to 0 mm and from -2.5 to 0 mm. The magnitude of the force along space
and time is stored in a matrix, Hythermo(y, z, t).
Displace-ments along the Z axis are then equal to the convolution
between Hthermo y (y, z, t) and Gyz1: Gyz = cos θ sin θ 4πρr ( 1 c2 p δP − 1 c2 s δS+ 3 r2 r/cs Z r/cp τ δτdτ ) (3) where δP = δ(t−cr p), δS = δ(t− r cs), δτ = δ(t−τ ), cpand
csare the compression and shear wave speed respectively,
τ is the time, and δ is a Dirac distribution. The three terms of the equation correspond respectively to the far-field compression wave, the far-far-field shear wave, and the near-field component.
Using constants ρ = 1000 kg.m−3, cp = 1500 m.s−1
and cs = 5.5 m.s−1 (similarly to experimental
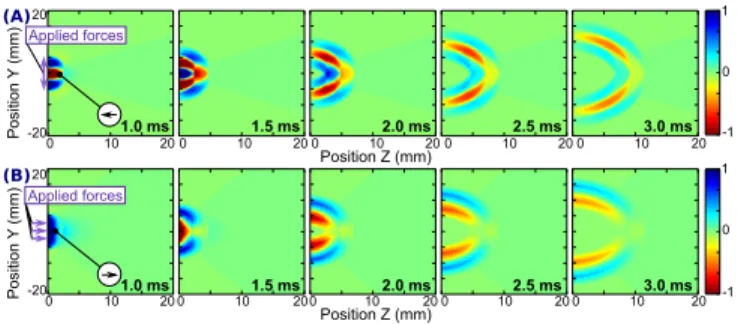
measure-ment), displacement maps along the Z axis were calcu-lated 1.0, 1.5, 2.0, 2.5, and 3.0 ms after force application, as illustrated in Figure 3-(A). The normalized displace-ment maps present many similarities to the experidisplace-mental results displayed in Figure 2-(A), with an initial central displacement directed towards the outside of the medium, and a propagation of three half cycles.
Next, we examine the physical characteristics of the other regime observed in our experiments. Solving the equation 1 with the same experimental parameters used previously, but with a laser energy of 200 mJ, we find a maximum increase in temperature of 60 K, i.e., a max-imum medium temperature of about 360 K assuming a room temperature of about 298 K. While slightly below the vaporization point of our medium, supposed close to 373 K (water vaporization temperature), its proximity to the water vaporization temperature may be sufficient to vaporize the medium. Indeed, it has been demonstrated that graphite and other small particles can act as nucle-ation sites to facilitate the vaporiznucle-ation of the medium
at temperature lower than the vaporization point2. A
Position Y (m m ) Position Y (m m ) 1.0 ms 1.5 ms 2.0 ms 2.5 ms 3.0 ms Position Z (mm) 20 -20 20 -20 0 -1 1 1 -1 0 10 20 0 0 10 200 10 200 10 200 10 20 (A) (B) Position Z (mm) 10 20 0 0 10 200 10 200 10 200 10 20 1.0 ms 1.5 ms 2.0 ms 2.5 ms 3.0 ms Applied forces Applied forces
Figure 3. Normalized displacement maps along the Z axis 1.0, 1.5, 2.0, 2.5, and 3.0 ms after laser emission as produced by simulation in a 5 mm disk diameter of (A) two opposite forces along the Y axis, and (B) a force along Z axis. Applied forces are illustrated by the violet arrows on the most left end side, and direction of the initial central displacement by the arrows in the white circles.
series of reactions then leads to displacements inside the medium, which generate shear waves; this constitutes the ablative regime.
To estimate the initial displacement amplitude in this regime, we again assume that the medium was homoge-neous and isotropic, and we discard any boundary effect.
The stress, σzz, is now defined as the sum of the axial
strain component and a term given by the second law of motion caused by the reaction of the particles ejected
out-side the medium upon reaching the vaporization point19:
σzz= (λ + 2µ) ∂uz ∂z − 1 ρ I2 (L + C(TV − T0))2 (4)
where L is the latent heat required to vaporize the solid,
and TV and T0are the vaporization and initial
tempera-tures, respectively.
By assuming µ λ and a zero stress state at the medium surface, equation 4 leads to a displacement
uz = ζI2/(ρλ(L + C(TV − T0))2). Using high-energy
experimental parameters, ζ ≈ γ−1 = 40 µm (average
depth of absorption), λ = 2 GPa (first Lam´e’s coefficient
of water), L = 2.2 MJ.kg−1 (vaporization latent heat of
water), and TV − T0 = 373-298 = 75 K, we obtain a
dis-placement uzof 2.9 µm. Again, this value is in agreement
with the experimentally obtained displacement (2.5 µm). Both theoretical and experimental displacements are di-rected towards the inside of the medium (see arrow in the white circle in Figures 2-(B) and 3-(B)).
To calculate the propagation of the displacement as a function of space and time, we modeled the ablative regime as a point force directed along the Z axis with a depth of 40 µm and a constant value from -2.5 to 2.5 mm. The magnitude of the force was stored in a matrix, Habla
4
equal to the convolution between Hzabla and Gzz1:
Gzz= cos2θ 4πρc2 pr δP+ sin2θ 4πρc2 sr δS+ 3 cos2θ − 1 4πρr3 r/cs Z r/cp τ δτ dτ (5) with the same notations as presented in equation 3.
Using the physical quantity values previously defined, displacement maps along the Z axis were calculated 1.0, 1.5, 2.0, 2.5, and 3.0 ms after force application, as illus-trated in Figure 3-(B). The displacement maps present many similarities to the experimental results of Figure 2-(B), with initial displacement directed towards the inside of the medium, and propagation of only two half cycles. Finally, the dependence of the shear wave amplitude versus laser energy was quantitatively investigated by in-creasing the laser beam energy from 10 to 200 mJ. Am-plitudes were averaged over four experiments for each energy level and successive energy levels were randomly chosen to avoid any time-related bias. In addition, im-pact location was changed after each laser emission to avoid any potential local degradation of the medium. Shear wave amplitude was measured as the mean square amplitude at t = 1 ms of the displacement estimated from ultrasound images between 0 and 10 mm of the medium surface, which was an arbitrary location where shear waves demonstrated high amplitudes. Resulting measurements are illustrated in Figure 4. Two linear de-pendencies are observed: one from 10 to 40 mJ, with a
slope of 1.05 (R2= 0.87), and one from 30 to 200 mJ, with
a slope of 2.18 (R2 = 0.97). This is in accordance with
the theory that displacement is linearly dependent on en-ergy at low energies, i.e. in the thermoelastic regime, but quadratically dependent at high energies, i.e. in the ab-lative regime. The threshold around 30-40 mJ is specific to our material characteristics, notably its absorption co-efficient.
In the context of shear wave elastography, the thermoe-lastic regime is a priori preferred over the ablative regime, because it is not destructive. Even if first shear wave elastography experiments assumed that a displacement
of a few hundred nanometers would be sufficient16,
dis-placements of the order of a few micrometers are usually required in practice for ultrasound or magnetic resonance
elastography in biological tissues17,13. This amplitude is
higher than the displacement we observed at 10 mJ (ther-moelastic regime), but along the same order of magnitude of the displacement observed at 200 mJ (ablative regime). For application in human body, the lowest fluence (500
J/m2, corresponding to a 10 mJ, 5 mm-diameter laser
beam) that was used in these experiments is incidentally 2.5 times above the maximum permissible exposure for
skin (200 J/m2) given by the Z136.1-2007 standard of
the American National Standard Institute. To overcome this issue, different strategies could be adopted, including using other types of laser, with higher maximum permis-sible exposure; emission of the laser beam onto a pro-tective absorbing layer, such as a black sheet covering
Laser beam energy (mJ)
Nor malized amplitude 10 20 50 100 200 100 10-1 10-2 slope = 1.05 slope = 2.18 0 -2.5 2.5 0 -.5 .5 0 -.06 .06 0 -.02 .02 0 10 20 0 20 -20 0 20 -20 0 20 -20 0 20 -20 (d) (c) (b) (a) (a) (b) (c) (d)
Figure 4. Experimentally measured amplitude of the shear wave versus laser beam power (log-log scale). Two linear de-pendencies are observed: one from 10 to 40 mJ (slope of 1.05), and one from 30 to 200 mJ (slope of 2.18). Four displacement maps at t = 2.0 ms are illustrated, for laser beam energies of 10, 30, 80 and 200 mJ. At low energy, a third half cycle is observed, which disappears when energy increases.
the patient’s skin10; or using a higher resolution imaging
technique able to track smaller displacements, such as high frequency (>100 MHz) ultrasound imaging or opti-cal coherence tomography - in this last case however, low penetration depth may lead to the observation of surface acoustic waves instead of shear waves. Combination with optical coherence tomography may even lead to a real-time, fully remote, small-scale laser-based technique to assess a soft solid stiffness11,22.
REFERENCES
1Aki, K. and Richards, P. G., Quantitative Seismology (Freeman
San Francisco, 1980).
2Alimpiev, S. S., Simanovskii, Y. O., Egerev, S. V., and Pashin,
A. E., Laser Chemistry 16, 63 (1995).
3Basford, A. T., Basford, J. R., Kugel, J., and Ehman, R. L.,
Magnetic Resonance Imaging 23, 647 (2005).
4Catheline, S., Wu, F., and Fink, M., The Journal of the
Acous-tical Society of America 105, 2941 (1999).
5Fromageau, J., Gennisson, J., Schmitt, C., Maurice, R.,
Mon-grain, R., and Cloutier, G., IEEE Trans Ultrason Ferroelectr
Freq Control 54, 498 (2007).
6Grasland-Mongrain, P., Miller-Jolicoeur, E., Tang, A., Catheline,
S., and Cloutier, G., Physics in Medicine and Biology 61, 2582 (2016).
7Grasland-Mongrain, P., Souchon, R., Cartellier, F., Zorgani, A.,
Chapelon, J. Y., Lafon, C., and Catheline, S., Phys. Rev. Lett. 113 (2014), 10.1103/physrevlett.113.038101.
8Hirsch, S., Klatt, D., Freimann, F., Scheel, M., Braun, J., and
Sack, I., Magnetic Resonance in Medicine 70, 671 (2012).
9Li, C., Guan, G., Huang, Z., Johnstone, M., and Wang, R. K.,
Optics Letters 37, 1625 (2012).
10Li, C., Guan, G., Zhang, F., Nabi, G., Wang, R. K., and Huang,
Z., Biomedical Optics Express 5, 1403 (2014).
11Li, C., Huang, Z., and Wang, R. K., Opt. Express 19, 10153
12Lucas, B. D. and Kanade, T., in Proceedings of Imaging Under-standing Workshop (1981) pp. 121–130.
13Manduca, A., Oliphant, T., Dresner, M., Mahowald, J., Kruse,
S., Amromin, E., Felmlee, J., Greenleaf, J., and Ehman, R.,
Medical Image Analysis 5, 237 (2001).
14Montalescot, S., Roger, B., Zorgani, A., Souchon, R.,
Grasland-Mongrain, P., Slama, R. B. H., Bera, J.-C., and Catheline, S., Appl. Phys. Lett. 108, 094105 (2016).
15Muthupillai, R., Lomas, D., Rossman, P., Greenleaf, J.,
Mand-uca, A., and Ehman, R., Science 269, 1854 (1995).
16Muthupillai, R., Lomas, D., Rossman, P., Greenleaf, J.,
Mand-uca, A., and Ehman, R., Science 269, 1854 (1995).
17Nightingale, K. R., Palmeri, M. L., Nightingale, R. W., and
Trahey, G. E., The Journal of the Acoustical Society of America 110, 625 (2001).
18Plewes, D. B., Betty, I., Urchuk, S. N., and Soutar, I., J. Magn.
Reson. Imaging 5, 733 (1995).
19Ready, J. F., Effects of High Power Laser Radiation (New York
Academic Press, 1971).
20Scruby, C. B. and Drain, L. E., Laser Ultrasonics Techniques
and Applications (CRC Press, 1990).
21Shan, Q. and Dewhurst, R. J., Appl. Phys. Lett. 62, 2649 (1993).
22Song, S., Wei, W., Hsieh, B.-Y., Pelivanov, I., Shen, T. T.,
O’Donnell, M., and Wang, R. K., Applied Physics Letters 108, 191104 (2016).
23Xu, M. and Wang, L. V., Rev. Sci. Instrum. 77, 041101 (2006).
24Zorgani, A., Souchon, R., Dinh, A.-H., Chapelon, J.-Y.,
M´enager, J.-M., Lounis, S., Rouvi`ere, O., and Catheline, S.,
Proceedings of the National Academy of Sciences 112, 12917 (2015).