HAL Id: hal-02613899
https://hal.univ-lorraine.fr/hal-02613899
Submitted on 20 May 2020
HAL is a multi-disciplinary open access
archive for the deposit and dissemination of
sci-entific research documents, whether they are
pub-lished or not. The documents may come from
teaching and research institutions in France or
abroad, or from public or private research centers.
L’archive ouverte pluridisciplinaire HAL, est
destinée au dépôt et à la diffusion de documents
scientifiques de niveau recherche, publiés ou non,
émanant des établissements d’enseignement et de
recherche français ou étrangers, des laboratoires
publics ou privés.
Data report: calcareous nannofossils and lithologic
constraints on the age model of IODP Site U1450,
Expedition 354, Bengal Fan
S.J.P. Lenard, J. Cruz, C. France-Lanord, J. Lavé, B.T. Reilly
To cite this version:
S.J.P. Lenard, J. Cruz, C. France-Lanord, J. Lavé, B.T. Reilly. Data report: calcareous nannofossils
and lithologic constraints on the age model of IODP Site U1450, Expedition 354, Bengal Fan.
Pro-ceedings of the International Ocean Discovery Program, 354, 2020, �10.14379/iodp.proc.354.203.2020�.
�hal-02613899�
Proceedings of the International Ocean Discovery Program Volume 354 publications.iodp.org
https://doi.org/10.14379/iodp.proc.354.203.2020
Data report: calcareous nannofossils and
lithologic constraints on the age model
of IODP Site U1450, Expedition 354, Bengal Fan
1Sebastien J.P. Lenard,2, 3 Jarrett Cruz,4 Christian France-Lanord,2 Jérôme Lavé,2
and Brendan T. Reilly5
Keywords: International Ocean Discovery Program, IODP, JOIDES Resolution, Expedition 354, Bengal Fan, Site U1450, age model
1 Lenard, S.J.P., Cruz, J., France-Lanord, C., Lavé, J., and Reilly, B.T., 2020. Data report: calcareous nannofossils and lithologic constraints on the age model of IODP Site U1450,
Expedi-tion 354, Bengal Fan. In France-Lanord, C., Spiess, V., Klaus, A., Schwenk, T., and the ExpediExpedi-tion 354 Scientists, Bengal Fan. Proceedings of the InternaExpedi-tional Ocean Discovery Program, 354: College Station, TX (International Ocean Discovery Program). https://doi.org/10.14379/iodp.proc.354.203.2020
2 CRPG, CNRS-Université de Lorraine, France. Correspondence author: sebastien.lenard@gmail.com 3 Now at IC2MP, HydrASA, Université de Poitiers, France.
4 Department of Earth, Ocean and Atmospheric Science, Florida State University, USA. 5 Scripps Institution of Oceanography, University of California San Diego, USA.
Contents 1 Abstract
1 Introduction
2 Material and methods
2 Results
5 Acknowledgments
5 References
Abstract
International Ocean Discovery Program (IODP) Expedition 354 Site U1450 was drilled at the center of a transect of 7 sites across the Bengal Fan at 8°N where long-term accumulation rates are highest. Site U1450 primarily consists of sandy and silty-sandy turbidites de-posited at a rate higher than 20 cm/ky. During periods when the depocenter shifted away from Site U1450, calcareous clay hemi-pelagic sediment was deposited at lower accumulation rates around 1–2 cm/ky. Dating of the lower Pleistocene and Pliocene sequences is hindered by the scarcity of microfossils in turbidites and the re-striction of paleomagnetic data to the upper 190 m. This report presents the identification of new calcareous nannofossils collected from hemipelagic and turbiditic intervals between 218 and 687 m core depth below seafloor, Method A (CSF-A). These data are con-solidated in a statistical age model that is constrained with ranges of plausible accumulation rates for the distinct lithologies. The age probability model ranges from 1.2 to 7.3 Ma for depths from 175.8 to 812.0 m CSF-A. Depending on constraints, 2σ uncertainties are around ±0.2 and 0.4 Ma.
Introduction
The Bengal Fan forms a record of past erosion of the Himalaya at the orogen scale and has been explored through a 320 km east– west transect of 7 sites cored by International Ocean Discovery Pro-gram (IODP) Expedition 354 at 8°N (France-Lanord et al., 2016a). The fan sediments dominantly consist of turbidites that derive from the northern Bay of Bengal shelf and are the product of Himalayan erosion conveyed by the Brahmaputra and Ganga Rivers. At 8°N, Neogene fan sediments are thicker than 2 km and represent an
ar-chive of past erosion and environment of the Himalayan orogen (Galy et al., 2010; Blum et al., 2018; Najman et al., 2019). While pa-rameters such as provenance, erosion rate, vegetation, and precipi-tation can be derived from the mineralogical, chemical, and isotopic compositions of turbidites, the interpretation of the record is highly dependent on determination of deposition age at each site. The ac-cumulation of turbidites in the fan is discontinuous, as the depo-center migrates from east to west and vice versa, depending on the course of the primary channel of transport (Schwenk and Spiess, 2009; France-Lanord et al., 2016a; Bergmann et al., 2020). Turbid-ites are sediments difficult to date, as microfossils are scarce and oc-casionally recycled. Therefore, age determination chiefly relies on the carbonate-rich hemipelagic horizons accumulated during peri-ods of absence of turbiditic deposition. There, paleomagnetism and cyclostratigraphy based on sediment lightness allow construction of the transect age model (Weber and Reilly, 2018). Furthermore, Reilly (2018) refined the age model of the Pleistocene transect through a statistical approach using direct age constraints com-bined with lithologic constraints on accumulation rates and seismic stratigraphy correlations. In the Miocene-Pliocene part of the re-cord, age determination is more difficult, as there is no paleo-magnetic constraint because of nonoriented coring.
Site U1450 (France-Lanord et al., 2016b) is located in the mid-dle part of the transect and has been difficult to date because it is the locus of a high accumulation of thick sandy interlevee deposits and, compared to Site U1451, it contains only limited hemipelagic intervals during the Pliocene and early Pleistocene. More than 400 m of sand-rich turbidites were deposited over a period of less than 3 My. This corresponds to an average accumulation rate of 15 cm/ky over this period (France-Lanord et al., 2016b). Based on new bio-stratigraphic data, Blum et al. (2018) reported even higher
accumu-S.J.P. Lenard et al. Data report: calcareous nannofossils and lithologic constraints on the age model
IODP Proceedings 2 Volume 354
lation rates around 38 cm/ky between 335 and 605 m CSF-A (core depth below seafloor, Method A) and between 2.9 and 3.6 Ma. However, the presence of more than 50 m of hemipelagic sediment deposited during this depth interval suggests that this interval should correspond to a longer age span. Assuming an accumulation rate on the order of 1–2 cm/ky for hemipelagic sediment implies a duration of 2–5 My, which is incompatible with the 0.7 My duration of the interval proposed by Blum et al. (2018). A refined age model for Site U1450 requires both new biostratigraphic datums and ac-counting for lithologic constraints on accumulation rates. This re-port presents (1) new calcareous nannofossil datums between 218 and 687 m CSF-A and (2) an age model taking into account available biostratigraphic data and lithostratigraphic constraints on accumu-lation rates.
Material and methods
Calcareous nannofossils
Standard smear slide techniques were used for biostratigraphic examination. To process a sample, sediment is placed into a cup with water and mixed. A drop of the sediment-water solution is then added to a coverslip. The coverslip is dried on a hot plate, then a mixture of jet dry and water is added to the coverslip. The sedi-ment is then evenly spread across the coverslip using a toothpick. The coverslip is then placed back on a hot plate to remove excess moisture. After drying, the coverslip is mounted using a labeled glass microscope slide with Norland optical adhesive (Number 61). The slide is then placed back onto the hot plate for the glue to spread evenly under the coverslip. The slide is then placed under a UV light bulb until the adhesive has cured and hardened.
Samples were examined using a Zeiss Axiostar+ light micro-scope. The microscope is equipped with oil immersion lenses with magnifications of 40×, 63×, and 100×. They are capable of viewing samples under brightfield phase contrast and cross-polarized light. They are also equipped with a trinocular head and imaging equip-ment for docuequip-mentation of marker species.
Samples were analyzed for the presence or absence of marker species. Background taxa were also recorded as present or absent using estimates of abundances. The standard nannofossil zonation of Martini (1971), Bukry (1973), and Okada and Bukry (1980) were utilized to evaluate nannofossil age datums. These zonal schemes have been correlated with the Gradstein et al. (2012) geological timescale and a published study by Denne et al. (2005), referenced under the Applied Biostratigraphix Gulf of Mexico Biostratigraphic Chart, further referred to as ABX.
Age model
The age model is constructed using a Monte-Carlo approach. Following Reilly (2018), the approach consists of predicting the best potential age models by cross-checking random age models with observed constraints. These random models are produced by mak-ing an initial assumption on the probability distribution of accumu-lation rates. In Bayesian statistics, this assumption is termed the prior distribution or “prior.” The core log is divided into intervals that are classified according to their lithology. For each interval, a random set of individual accumulation rates is drawn following re-alistic ranges of accumulation rates depending on the lithology. These constraints are “the prior” in the Monte-Carlo approach. The sets of individual accumulation rates for each interval are then as-sembled to form a set of temporal series of random accumulation rates. Then the set of random temporal paths is constructed using
an initial time constraint. The random temporal paths are subse-quently cross-checked with the available age datums, and all paths not respecting these constraints are rejected. The approach is iter-ated until a statistically sufficient number of solutions is found.
Here for Site U1450, the split intervals correspond to the litho-logic units. The intervals are classified following deposition type: turbiditic or hemipelagic units, based on the lithostratigraphic log (Tables T1, T2 and Figures F34, F35 in France-Lanord et al., 2016b). Hemipelagic units are calcareous clays and limestone. They contain high proportion of biogenic carbonates (10%–50%) and show clear evidence of bioturbation. Turbidites are graded and re-petitive sequences of clay, silt and sand, or relatively massive sand layers. Each first occurrence (FO), first common occurrence (FCO), and last occurrence (LO) dating marker of Tables T1 and T2 is asso-ciated with the closest interval above the depth of the marker. An uncertainty of ±0.01 Ma is assigned to each marker. An initial age of 1.185 Ma for the 175.9 m CSF-A depth is determined by the posi-tion of the top of the C1r.3r (middle Matuyama) polarity zone of the 2012 Geologic Timescale (France-Lanord et al., 2016b; Gradstein et al., 2012). The following “prior” is selected for accumulation rates: (1) a uniform distribution in the 10–230 cm/ky range for tur-biditic intervals or (2) a uniform distribution in the 1–5 cm/ky range for hemipelagic intervals. These ranges were selected from the average accumulation rates of all seven Expedition 354 sites computed in Reilly (2018) for the 0–1.2 Ma period. For intervals be-low 474.7 m CSF-A, core recovery was be-lower, which generates more uncertainty in the lithology. To let the model accept solutions with accumulation rates diverging from the range assigned to each litho-logy, we apply a bimodal distribution. The first mode is one of the uniform distribution previously selected, weighed by a factor of 0.7, and the second mode is a uniform distribution in the intermediate 5–35 cm/ky, range weighted by a factor of 0.3. As a consequence, it allows turbiditic intervals to present accumulation rates lower than average and hemipelagic intervals to present accumulation rates higher than average.
Numerical sampling of accumulation rates includes a compac-tion term with separate laws for turbiditic and hemipelagic intervals (Baldwin and Butler, 1985). This compaction correction is applied to the prior accumulation rates given above in function of the sam-pling depth, considering that the reference rates were defined at a mean depth of 100 m (Reilly, 2018). Numerical sampling was per-formed a million times over the 175.6–811.9 m CSF-A depth range until the 10,000 paths that respect the micropaleontological con-straints were obtained.
Results
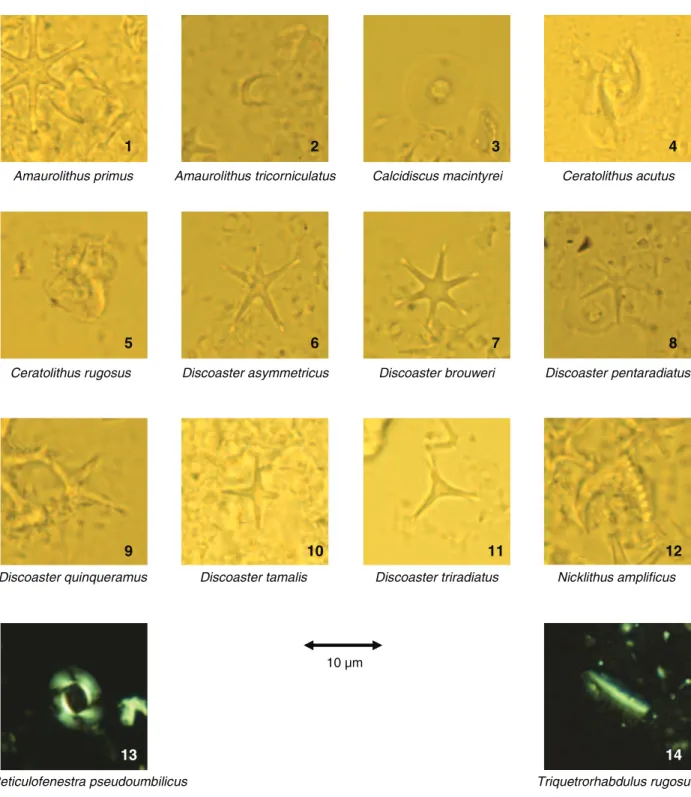
Calcareous nannofossils identifications
For this study, we prepared and observed 125 new samples (Ta-ble T3). Most samples were taken in hemipelagic intervals. Key nannofossil identifications are presented in Plate P1 and Table T1. Best observations were performed on samples from hemipelagic in-tervals. Hence, there was minimal risk of recycling previously de-posited sediments. Due to the nature of sampling at this site, the
Table T1. Biostratigraphy of samples from Hole U1450A. Download table in CSV format.
Table T2. Published age datums considered for the age model of Site U1450.
analyses of top events (LOs) are mainly utilized. Without continu-ous sampling to trace abundance shifts, it is difficult to assign FO events. Eighteen events are presented in sample depths from 218 to 687 m CSF-A. The first event Scyphosphaera pulcherrima is as-signed “within” to signify the sample is older than 1.03 Ma but
younger than 1.6 Ma, likely below the actual top of this zone. The remaining 17 events are marked with “top”; this signifies that the first observation is considered to be in situ of the marker species. Because of the nature of the study site, its significant turbidite activ-ity, and rarity of some marker species, the events likely do not sig-nify the true top. This is considered in the range of error mentioned previously. Another important factor that needs to be considered when assigning an absolute age is the diachronous characteristic of
Plate P1. Nannofossil markers in plain light (1–12) and in polarized light (13–14). 1. Amaurolithus primus. 2. Amaurolithus tricorniculatus. 3. Calcidiscus
mac-intyrei. 4. Ceratolithus acutus. 5. Ceratolithus rugosus. 6. Discoaster asymmetricus. 7. Discoaster brouweri. 8. Discoaster pentaradiatus. 9. Discoaster quinqueramus.
10. Discoaster tamalis. 11. Discoaster triradiatus. 12. Nicklithus amplificus. 13. Reticulofenestra pseudoumbilicus. 14. Triquetrorhabdulus rugosus.
Amaurolithus primus Amaurolithus tricorniculatus Calcidiscus macintyrei Ceratolithus acutus
Ceratolithus rugosus Discoaster asymmetricus Discoaster brouweri Discoaster pentaradiatus
Discoaster quinqueramus Discoaster tamalis Discoaster triradiatus Nicklithus amplificus
10 µm
Reticulofenestra pseudoumbilicus Triquetrorhabdulus rugosus
1
2
3
4
5
6
7
8
9
10
11
12
13
14
Table T3. List of observed samples, Site U1450. Download table in CSV for-mat.
S.J.P. Lenard et al. Data report: calcareous nannofossils and lithologic constraints on the age model
IODP Proceedings 4 Volume 354
nannoplankton. The ABX age values assigned are from a study of Gulf of Mexico nannofossil events; therefore, ages may differ from Indian Ocean events.
Age model
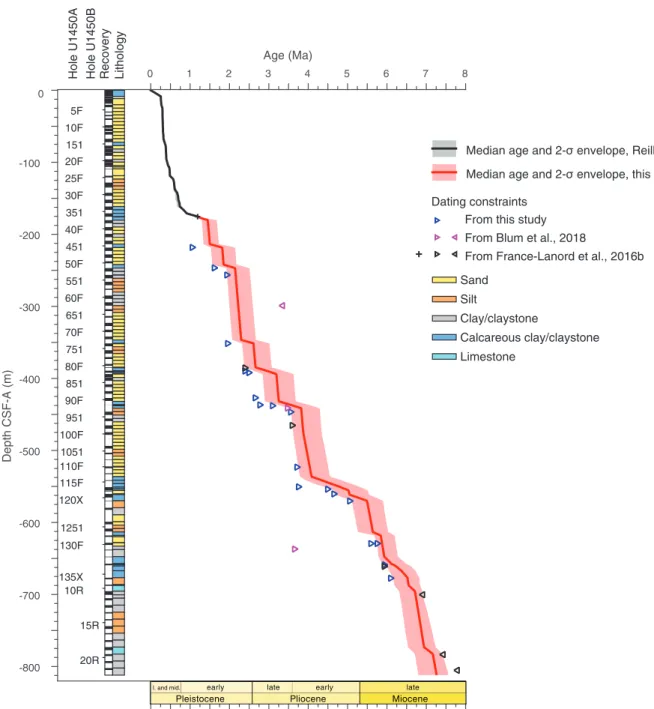
The computed age model with its uncertainties is presented in Figure F1 and Table T4. All solutions respect the constraints given by our new calcareous nannofossil datums (Table T1) and the pub-lished biostratigraphic datums (Table T2; France-Lanord et al., 2016b; Blum et al., 2018). Two-sigma uncertainties vary between
±0.2 and 0.4 Ma depending on the configuration of age and litho-logic constraints.
The younger boundary of the age envelope is constrained by 24 LO or last common occurrence (LCO) datums, and the oldest boundary is constrained by only 4 FO datums. The model is better constrained in the central interval, 390–700 m CSF-A, correspond-ing to 2.9–6.7 Ma. One pair of LO-FO datums at ~700 m CSF-A strongly controls the age model. Because of the limited number of FO datums, the prior distribution of accumulation rates exerts a control complementary to the LO datums on the age model.
Figure F1. Age model for Site U1450 constructed in this study, with the 0–175.9 m CSF-A part from Reilly (2018). For clarity, the cores of Hole U1450B that overlap cores of Hole U1450A are not indicated. The lithostratigraphic log is from France-Lanord et al. (2016b).
Depth CSF-A (m) -800 -700 -600 -500 -400 -300 -200 -100 0 5F 10F 151 20F 25F 30F 351 40F 451 50F 551 60F 651 70F 751 80F 851 90F 951 100F 1051 110F 115F 120X 1251 130F 135X 10R 15R 20R Lithology Recovery
Hole U1450A Hole U1450B
Age (Ma) 0 1 2 3 4 5 6 7 8 Sand Silt Clay/claystone Calcareous clay/claystone Limestone
Median age and 2-σ envelope, this study
From this study From Blum et al., 2018
From France-Lanord et al., 2016b Dating constraints
Median age and 2-σ envelope, Reilly, 2018
late early late y l r a e
Pleistocene Pliocene Miocene
l. and mid.
The age model displays a stepwise shape reflecting the alterna-tion of rapidly accumulated thick sand and silt turbidites with slowly accumulated thin hemipelagic episodes. The accumulation rate prior distribution that was selected for the model is compatible with the datums. As expected, the predicted turbiditic accumulation rates are fully controlled by the “prior” and therefore are only indic-ative. They do not diverge from 110 ± 100 cm/ky for the 175–475 m CSF-A interval and only occasionally diverge from 65 +135/–60 cm/ky for 475–805 m CSF-A. Contrary to turbiditic intervals, the hemipelagic intervals present predicted accumulation rates that seem independent of the “prior,” with an average of 2.0 +2.0/–1.2 cm/ky for the 175–475 m CSF-A interval. Predicted values are slightly higher for 475–630 m CSF-A, at 2.8 + 23.9/–1.8 cm/ky and higher for 657–800 m CSF-A, at 8.0 +22.0/–6.4 cm/ky. The later likely derives from poor lithologic constraints due to low recovery in this interval.
Acknowledgments
The samples were provided by the International Ocean Discov-ery Program (IODP). The staff of IODP Kochi Core Center are thanked for their assistance for sample collection in February 2019. The authors acknowledge the support of a Université de Lorraine-CRPG PhD fellowship and a Université de Poitiers Attaché Tempo-raire d'Enseignement et de Recherche (ATER) of S.L., the support of IODP France, and the support of the French Agence Nationale de la Recherche (ANR) under grant ANR-17-CE01-0018 (Himal Fan project).
References
Baldwin, B., and Butler, C.O., 1985. Compaction curves. AAPG Bulletin, 69(4):622–626.
Bergmann, F., Schwenk, T., Spiess, V., and France-Lanord, C., 2020. Middle to late Pleistocene architecture and stratigraphy of the lower Bengal Fan - integrating multichannel seismic data and IODP Expedition 354 results.
Geochemistry, Geophysics, Geosystems, 21(1):e2019GC0088702. https://doi.org/10.1029/2019GC008702
Blum, M., Rogers, K., Gleason, J., Najman, Y., Cruz, J., and Fox, L., 2018. Allo-genic and autoAllo-genic signals in the stratigraphic record of the deep-sea Bengal Fan. Scientific Reports, 8:7973. https://doi.org/10.1038/s41598-018-25819-5
Bukry, D., 1973. Low-latitude coccolith biostratigraphic zonation. In Edgar, N.T., Saunders, J.B., et al., Initial Reports of the Deep Sea Drilling Project, 15: Washington, DC (U.S. Government Printing Office), 685–703.
https://doi.org/10.2973/dsdp.proc.15.116.1973
Denne, R., Callender, A, and Nault, M. 2005. Gulf of Mexico Biostratigraphic
Chart Neogene Calcareous Nannofossils: Houston TX (Applied Biostrati -graphix).
France-Lanord, C., Spiess, V., Klaus, A., Schwenk, T., Adhikari, R.R., Adhikari, S.K., Bahk, J.-J., Baxter, A.T., Cruz, J.W., Das, S.K., Dekens, P., Duleba, W.,
Fox, L.R., Galy, A., Galy, V., Ge, J., Gleason, J.D., Gyawali, B.R., Huyghe, P., Jia, G., Lantzsch, H., Manoj, M.C., Martos Martin, Y., Meynadier, L., Najman, Y.M.R., Nakajima, A., Ponton, C., Reilly, B.T., Rogers, K.G., Sav-ian, J.F., Selkin, P.A., Weber, M.E., Williams, T., and Yoshida, K., 2016a. Expedition 354 summary. In France-Lanord, C., Spiess, V., Klaus, A., Schwenk, T., and the Expedition 354 Scientists, Bengal Fan. Proceedings of the International Ocean Discovery Program, 354: College Station, TX (International Ocean Discovery Program). https://dx.doi.org/ 10.14379/ iodp.proc.354.101.2016
France-Lanord, C., Spiess, V., Klaus, A., Adhikari, R.R., Adhikari, S.K., Bahk, J.-J., Baxter, A.T., Cruz, J.W., Das, S.K., Dekens, P., Duleba, W., Fox, L.R., Galy, A., Galy, V., Ge, J., Gleason, J.D., Gyawali, B.R., Huyghe, P., Jia, G., Lantzsch, H., Manoj, M.C., Martos Martin, Y., Meynadier, L., Najman, Y.M.R., Nakajima, A., Ponton, C., Reilly, B.T., Rogers, K.G., Savian, J.F., Schwenk, T., Selkin, P.A., Weber, M.E., Williams, T., and Yoshida, K., 2016b. Site U1450. In France-Lanord, C., Spiess, V., Klaus, A., Schwenk, T., and the Expedition 354 Scientists, Bengal Fan. Proceedings of the International Ocean Discovery Program, 354: College Station, TX (Inter-national Ocean Discovery Program).
https://doi.org/10.14379/iodp.proc.354.104.2016
Galy, V., France-Lanord, C., Peucker-Ehrenbrink, B., and Huyghe, P., 2010. Sr-Nd-Os evidence for a stable erosion regime in the Himalaya during the past 12 Myr. Earth and Planetary Science Letters, 290(3–4):474–480.
http://dx.doi.org/10.1016/j.epsl.2010.01.004
Gradstein, F.M., Ogg, J.G., Schmitz, M.D., and Ogg, G.M. (Eds.), 2012. The
Geological Time Scale 2012: Amsterdam (Elsevier). https://doi.org/10.1016/C2011-1-08249-8
Martini, E., 1971. Standard Tertiary and Quaternary calcareous nanno-plankton zonation. In Farinacci, A. (Ed.), Proceedings of the Second
Plank-tonic Conference, Roma 1970: Rome (Edizioni Tecnoscienza), 2:739–785.
Najman, Y., Mark, C., Barfod, D.N., Carter, A., Parrish, R., Chew, D., and Gemignani, L., 2019. Spatial and temporal trends in exhumation of the eastern Himalaya and syntaxis as determined from a multitechnique detrital thermochronological study of the Bengal Fan. GSA Bulletin, 131(9):1607–1622. https://doi.org/10.1130/B35031.1
Okada, H., and Bukry, D., 1980. Supplementary modification and introduc-tion of code numbers to the low-latitude coccolith biostratigraphic zona-tion (Bukry, 1973; 1975). Marine Micropaleontology, 5:321–325.
https://doi.org/10.1016/0377-8398(80)90016-X
Reilly, B.T., 2018. Deciphering Quaternary geomagnetic, glacial, and depo-sitional histories using paleomagnetism in tandem with other chrono-stratigraphic and sedimentological approaches (Ph.D. dissertation). Oregon State University, Corvallis.
Schwenk, T., and Spieß, V., 2009. Architecture and stratigraphy of the Bengal Fan as response to tectonic and climate revealed from high-resolution seismic data. In Kneller, B.C., Martinsen, O.J., and McCaffrey, B. (Eds.),
External Controls on Deep-Water Depositional Systems. Special Publica -tion - SEPM (Society of Sedimentary Geologists), 92:107–131. Weber, M.E., and Reilly, B.T., 2018. Hemipelagic and turbiditic deposits
con-strain lower Bengal Fan depositional history through Pleistocene climate, monsoon, and sea level transitions. Quaternary Science Reviews, 199:159–173. https://doi.org/10.1016/j.quascirev.2018.09.027