ACCELERATED GEOSCIENCE PROGRAM
Samarium–neodymium isotope map of
Western Australia
by
Y Lu, MTD Wingate, DC Champion1, RH Smithies, SP Johnson, DR Mole2, M Poujol3, J Zhao4, R Maas5 and RA Creaser6
Abstract
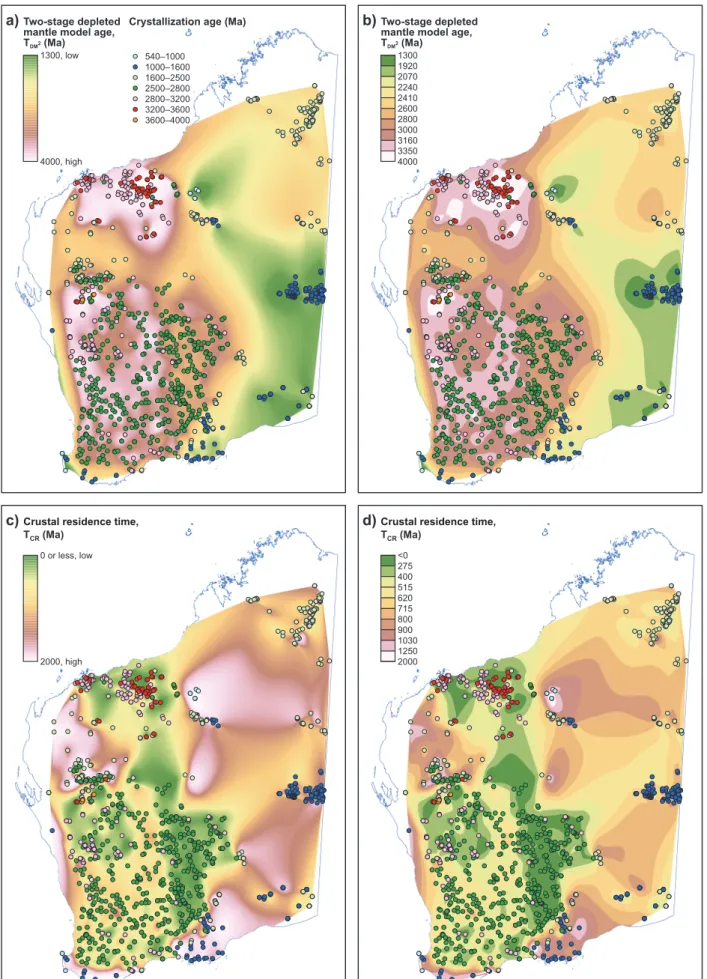
Isotope maps are used to characterize lithospheric architecture through time, to understand crustal evolution and mineral system distributions, and play an increasingly important role in exploration targeting.
These Sm–Nd isotope maps of Western Australia (Fig. 1) are based on whole-rock Sm–Nd data for felsic igneous rocks, which provide a window into the middle and lower continental crust, and are used for isotope mapping. Although mafic to intermediate igneous and sedimentary rocks were not used in constructing the contoured isotope maps, Sm–Nd data for those samples are included with those for felsic igneous rocks in the data table.
The maps show two-stage depleted mantle model ages (TDM2, proxy for the age of the crustal
source of the igneous rocks) and crustal residence time (the difference between TDM2 and magmatic crystallization age, i.e. the length of time the source of the igneous rocks has resided in the crust). The model age gradients are typically associated with major crustal structures and are potentially important for localizing mineral systems. Map colours in areas with no sample reflect interpolated values and may have little or no relationship with underlying crust.
The data layer is best accessed using GeoVIEW.WA. This online interactive mapping system allows data to be viewed and searched together with other datasets, including Geological Survey of Western Australia (GSWA) and Geoscience Australia (GA) geochronology data, geological maps and mineral exploration datasets. Data for individual sample points can be viewed by selecting the symbols. The Sm–Nd isotope map data layer is also available for download from the Data and Software Centre, as ESRI Shape files and MapInfo Tab files. These datasets are subject to ongoing updates as new data are generated and compiled.
The isotope maps were created using the Natural Neighbor interpolation tool in ArcGIS Spatial Analyst. The isotope maps are presented as both stretched (Histogram Equalize type, Fig. 1a,c) and classified (natural breaks classification, Fig. 1b,d) raster datasets. Some isotope gradients may not be as pronounced in the statewide map as they might be on more detailed maps of individual regions. It is therefore recommended that users download the isotope data and create their own contour maps for particular areas, to enhance the isotope gradients in those areas.
The Sm–Nd isotope samples and associated data were compiled as part of a collaboration between GSWA and GA. Acquisition of GSWA’s Sm–Nd isotope data involved collaboration with several university research laboratories and was funded by the Exploration Incentive Scheme.
1 1 Geoscience Australia, GPO Box 378, Canberra, ACT 2601, Australia
2 Mineral Exploration Research Centre, Harquail School of Earth Sciences, Laurentian University, Sudbury, ON P3E 2C6, Canada 3 GeOHeLiS, Géosciences Rennes, UMR 6118, Université Rennes 1, 35042 Rennes cedex, France
4 Radiogenic Isotope Facility, School of Earth Sciences, University of Queensland, Brisbane, QLD 4072, Australia 5 School of Earth Sciences, University of Melbourne, Parkville, VIC 3010, Australia
ACCELERATED GEOSCIENCE PROGRAM
2
b)Two-stage depleted mantle model age,
2 T (Ma)DM 1300 1920 2070 2240 2410 2600 2800 3000 3160 3350 4000
a) Crystallization age (Ma)
540–1000 1000–1600 1600–2500 2500–2800 2800–3200 3200–3600 3600–4000 Two-stage depleted mantle model age,
2
T (Ma)DM
1300, low
4000, high
c)Crustal residence time, T (Ma)CR 0 or less, low 2000, high d) <0 275 400 515 620 715 800 900 1030 1250 2000 YL74 26.02.21
Crustal residence time, T (Ma)CR
Figure 1. Sm–Nd isotope maps for whole-rock samples of felsic igneous rocks in Western Australia. Two-stage depleted mantle model age (TDM2) and crustal residence time (TCR) maps are presented as stretched (a and c) and classified (b and d) raster images.
Symbols show the locations of Sm–Nd samples used for isotope mapping and are colour-coded to indicate their magmatic crystallization ages
ACCELERATED GEOSCIENCE PROGRAM
Recommended reference
Lu, Y, Wingate, MTD, Champion, DC, Smithies, RH, Johnson, SP, Mole, DR, Poujol, M, Zhao, J, Maas, R and Creaser RA 2021, Samarium–neodymium isotope map of Western Australia: Geological Survey of Western Australia, digital data layer.
Disclaimer
This product uses information from various sources. The Department of Mines, Industry Regulation and Safety (DMIRS) and the State cannot guarantee the accuracy, currency or completeness of the information. Neither the department nor the State of Western Australia nor any employee or agent of the department shall be responsible or liable for any loss, damage or injury arising from the use of or reliance on any information, data or advice (including incomplete, out of date, incorrect, inaccurate or misleading information, data or advice) expressed or implied in, or coming from, this publication or incorporated into it by reference, by any person whosoever.
© State of Western Australia (Department of Mines, Industry Regulation and Safety) 2021
With the exception of the Western Australian Coat of Arms and other logos, and where otherwise noted, these data are provided under a Creative Commons Attribution 4.0 International Licence. (http://creativecommons.org/licenses/by/4.0/legalcode)