C E N T R E D' ÉT U D E S E T D E R E C H E R C H E S S U R L E D E V E L O P P E M E N T I N T E R N A T I O N A L
SÉRIE ÉTUDES ET DOCUMENTS
Impact of natural resource wealth on non-resource tax revenue
mobilization in Africa: Do institutions and economic diversification
matter?
Seydou Coulibaly
Études et Documents n° 16
April 2019To cite this document:
Coulibaly S. (2019) “Impact of natural resource wealth on non-resource tax revenue mobilization in Africa: Do institutions and economic diversification matter?”, Études et Documents, n° 16, CERDI. CERDI PÔLE TERTIAIRE 26 AVENUE LÉON BLUM F-63000 CLERMONT FERRAND TEL.+33473177400 FAX +33473177428 http://cerdi.uca.fr/
2 The author
Seydou Coulibaly
PhD Student in Economics, Université Clermont Auvergne, CNRS, IRD, CERDI, F-63000 Clermont-Ferrand, France; African Development Bank, Abidjan, Côte d’Ivoire.
Email addresses: coulsay26@yahoo.fr; s.coulibaly@afdb.org
This work was supported by the LABEX IDGM+ (ANR-10-LABX-14-01) within the program “Investissements d’Avenir” operated by the French National Research Agency (ANR).
Études et Documents are available online at: https://cerdi.uca.fr/etudes-et-documents/ Director of Publication: Grégoire Rota-Graziosi
Editor: Catherine Araujo-Bonjean Publisher: Mariannick Cornec ISSN: 2114 - 7957
Disclaimer:
Études et Documents is a working papers series. Working Papers are not refereed, they constitute
research in progress. Responsibility for the contents and opinions expressed in the working papers rests solely with the authors. Comments and suggestions are welcome and should be addressed to the authors.
3 Abstract
This paper estimates the impact of natural resources rents on non-resource tax revenue mobilization. Regressions are carried out using the Panel Smooth Transition Regression model for 29 African countries over the period 1995-2012. The empirical results indicate that while natural resource rents alone have direct negative impact on non-resource tax revenue, the quality of institutions and the level of economic diversification modulate this impact. Natural resource rents enhance non-resource tax revenue collection in more diversified economies and in economies with favorable institutional environment. These findings urge African governments to allocate natural resources revenues towards diversifying the economy and strengthening the quality of institutions for enhancing non-resource tax revenue mobilization.
Keywords
Natural resource rents, Non-resource tax revenue, Institutions, Economic diversification, Africa.
JEL Codes A13, H20, H30
4
1. Introduction
With the drop in global official development assistance and foreign direct investments flows in the aftermath of the recent global recession, domestic resource revenue mobilization became imperative for African countries. In this regard, identifying the opportunities and specific conditions for stimulating tax revenue collection is of crucial importance for policymakers in Africa. Natural resources wealth represents a real opportunity for the government to increase its tax revenue collection through the taxation of natural resources exploitation (Crivelli and Gupta, 2014; Eltony, 2002; Ossowski and Gonzales, 2012; Stotsky and WoldeMariam, 1997; Tanzi, 1989; Thomas and Trevino, 2013). While natural resources exploitation may increase resource taxes mobilization, its effect on tax collection from non-resource sectors is however unclear. Indeed, on the one hand, natural resource exploitation and the resource revenue it generates can serve as a catalyst for stimulating the activities of the non-resource sectors and therefore enabling more non-resource tax collection from these sectors. But, on the other hand, the governments that collect a large share of their budget revenue from natural resources exploitation may have incentives to lessen and relax efforts in collecting taxes from non-resource tax bases.
Against this background, an emerging literature on the topic indicates that the effect of natural resource revenue on non-resource tax revenue is non-linear and depends on the quality of institutions (Belinga et al., 2017). The studies from this literature document that natural resource rents increase resource tax revenue in countries with good institutions and decrease non-resource tax revenue mobilization in countries with weak institutions. The present paper extends this line in the literature by showing that in addition to the quality of institutions, the effect of natural resource rent on non-resource tax revenue also depends on the level of economic diversification.
In fact, economic diversification favors the broadening of the non-resource tax base by stimulating the activities of tradable sectors suggesting that natural resources may stimulate non-resource tax revenues in countries that are more diversified while they are negatively associated with non-resource tax revenues in less diversified countries. In other words, countries which allocate an important share of their resource revenue to promote the economic diversification may experience better non-resource tax revenue than those which do not act in this direction. Within this context, this study puts forward that in addition to the quality of institutions, the level of economic diversification also matter in the relationship between natural
5
resource revenue and tax effort. More specifically, this paper estimates the direct impact of natural resource rents on non-resource tax revenue and the conditional effect of natural resources rents on non-resource tax revenue depending on the level of economic diversification and the quality of institutions for African economies. The contribution of our study to the existing literature on the topic is threefold.
First, for analyzing the effect of natural resource wealth on non-resource tax collection, instead of focusing only on hydrocarbons as Belinga et al (2017) and Bornhorst et al. (2009), we consider all the natural resources (hydrocarbons, minerals, fisheries and forests) to take into account the diversity of natural resources endowment in Africa1.
Second, in contrast to most of previous studies on the subject which have considered as dependent variable total tax revenue (Botlhole et al, 2012), we rather consider non-resource tax revenue to come up with policy-oriented recommendations for facing current tax mobilization challenges in Africa. The rationale behind focusing on non-resource tax revenue instead total tax revenue is mainly is motivated by the strategic substitution role that non-resource tax system could play in mobilizing revenue for African countries in a context of downwards trends in natural resources international prices. Indeed, the recent downwards trend and instabilities in oil and gas prices suggest the redefinition of the strategy of domestic revenue mobilization towards an efficient tax system focused on non-resource taxes. This will help reducing the reliance on natural resources as government’s major source of revenue in order to reduce the macroeconomic vulnerabilities of African countries to external shocks related to the volatility of natural resources’ global prices2. Moreover, given that some natural resource rents are
generated from non-renewable resources that will eventually be depleted, an efficient tax system focused on non-resource taxes will be crucial for sustainable domestic revenues mobilization after resource depletion (Fjeldstad et al., 2015). Furthermore, focusing on non-resource tax revenue mobilization is also relevant in a global context of transition toward low carbon economy which might ultimately decrease the importance of hydrocarbons as energy sources and thereby negatively affect resource revenue for hydrocarbons exporting countries.
1In fact, around 30% of the global minerals resources are located in Africa and the continent’s proven oil reserves represent 8% of the global stock of oil reserves. Africa also hosts 7% of the world’s stock of natural gas (ANRC, 2016). Africa's forests and woodlands of Africa are estimated to cover 650 million ha, or 21.8 percent of the continent’s land area (FAO, 2003).
2Morrissey et al. (2016) provide details discussions on tax revenue performances’ vulnerability to external
6
Finally, to our knowledge this is the first study that on the one hand develops theoretical arguments to show that economic diversification and institutional quality modulate the impact of non-resource tax revenue on non-resource tax revenue and on the other hand, this is the first paper that empirically tests the conditional effect of natural resource rents on non-resource tax revenue depending on the level of economic diversification for African economies.
Furthermore, another contribution of this paper is based on the methodological approach. Indeed, to our knowledge, this is the first study that uses panel smooth transition regression (PSTR) model to estimate the conditional impact of natural resource revenue on tax revenue. In fact, in contrast to previous studies which generally draw upon on linear models with interaction term between natural resource rents and institutions which suggests a linear interaction between resource revenue and institutions in generating non-resource tax revenue to estimate the conditional effect of natural resource on non-resource tax revenue, the present study relies on non-linear model (PSTR) to estimate the conditional effect of natural resources on non-resource tax revenue depending on economic diversification and institutions3. The PSTR model has the advantage to take into account heterogeneities in the relationship between natural resources rents and non-resource tax revenue since given the heterogeneities in natural resources endowments and the dependence on natural resource across African countries; one cannot guaranty the homogeneity of the relationship between natural resource revenue and non-resource tax revenue in Africa. Moreover, the economic diversification and improvement in the quality of institutions are not abrupt but rather progressive processes because it takes time to observe significant changes in the level of economic diversification and the quality of institutions for a given country. The PSTR takes into account these considerations since this model assumes smoothness in the conditional effect.
The remainder of the chapter is organized as follows: In section 2, we discuss the mechanisms through which natural resources could affect non-resource tax collection. Section 3 analyses the theoretical impact of resource revenue on non-resource tax revenue depending on institutions and economic diversification. Section 4 reviews the empirical literature on the relationship between natural resources revenue and non-resource tax revenue in developing countries. Then, section 5 motivates and describes in greater details the econometric model, the specification tests and the estimation method utilized to test the impact of natural resources wealth and non-resource tax revenue. Section 6 is dedicated to the presentation of data. Section
3However, we run linear regressions with interaction term between natural resource rents and the institutional
7
7 presents and analyses the estimation results and comes up with policy recommendations that could be drawn from the study, while the section 8 concludes the study.
2. How do natural resources revenues affect non-resource tax revenue mobilization? Government could use natural resources revenue to finance basic infrastructure for stimulating the whole economic activity, increasing productivity and therefore enhancing tax collection from non-resource sectors. Moreover, a country engaged in natural resources projects could invest in capacity building programs for the relevant tax administrations officials in order to harness a fair value of its natural resources. For instance, the African Natural Resources Center (ECNR) of the African Development Bank and OpenOil are supporting capacity building in financial modeling for the extractive sector in some African countries for strengthening domestic resource mobilization. Financial modeling realizes projections of what should have been paid by companies to the government under the existing tax regime and compares it to what have been really paid to the government for detecting potential discrepancies around natural resources tax revenue collection. In such circumstances, there could therefore be a positive spillover effect from building capacity for improving resource taxes collection to stimulating non-resource tax revenue mobilization performance.
In the same vein, some African countries are developing strategies to increase domestic linkages of natural resources sector. For example, Guinea has recently requested the assistance of the ECNR to undertake a study that should put light on efficient strategies for linking mining exploitation to agriculture and energy sectors such that mining sector activities stimulate agriculture and energy sectors. In 2017, Zambia in collaboration with the ECNR has undertaken and validated a study on local content policies aiming at stimulating local activities through mining exploitation. The goal of these strategies is to reinforce the link between natural resources activities to the rest of the economy so that natural resources sector act as an engine for the others sectors in the economy. In such a context, growth in natural resources activities implicitly suggesting an increase in natural resources revenue will boost non-resource sector activities and thus more non-resource tax revenue for the government.
For countries which are experiencing an increase in the level of natural resource revenue, it is possible that the demand for transfers and redistribution from the citizens also increase4. Thus,
4Burkina Faso is in phase to face this situation. In fact, in 2008 it produced just 5.5 tons of gold from two large-scale projects. Five years after, in 2013, the country has multiplied by 6 its gold production to 33 tones. During
8
if the raise of the demand for transfers is more proportional than the increase in resource revenue, the government could turn towards the possibility to increase non-resource tax revenue effort in order to satisfy the surplus demand of transfers. From this perspective, natural resources revenues act as a catalyst for non-resource tax revenue mobilization.
However, there is evidence that natural resource wealth can crowd out non-resource tax revenue effort. This seems to be the case for African countries where Ndikumana and Abderrahim (2010) reveal that these countries have been unable to take advantage of their natural resources endowment for raising government revenue collection. Indeed, as stressed by Brun et al, (2015), governments that collect a large share of tax revenue from natural resources have less incentive to increase efforts in mobilizing tax revenues from non-resource tax bases (crowding out effect of resource revenues on non-resource revenue). Furthermore, in order to minimize demand for accountability and demand for public goods and services from the citizens and the taxpayers, governments with large natural resource revenue may lower the tax burden on their taxpayers. The situation of Dutch disease5 that may occur in natural abundance countries is detrimental to non-resource tax mobilization as there is a shift of economic activities from non-resource sectors to the natural resource sector. Furthermore, the macroeconomic challenges that follow natural resources exploitation may significantly threaten the growth of the non-resource economy. In fact, an increase in natural resource activities can provoke the appreciation of the real exchange rate, thereby disturbing the competitiveness and the productivity growth of the non-resource sectors (Arezki et al, 2012) and negatively affect tax revenues collected from these sectors. The appreciation of the national currency due to significant revenues from natural resources exports can exacerbate inflation and therefore impedes non-resource tax collection as suggested by the Oliveira-Tanzi effect (negative effect of inflation on tax revenue).
2018, Burkina Faso expects to produce 55 tons of gold, a two-thirds increase on five years ago (2013). But at the same time, the government is facing growing pressure for increasing salaries and transfers. In Côte d’Ivoire, the tax revenues generated by the mining companies totaled FCFA 56, 4 billion in 2017, an increase of 39.8% between the year 2016 and 2017. During the same period, the public sector workers unions have successfully put pressure on the government to pay back unpaid premiums and raise wages in some cases.
5 Natural resources exports lead to foreign currency inflows in the exporting country which increases the demand
for national currency and the price of non tradable goods. This leads to an appreciation of the exchange rate of the national currency with respect to foreign currencies and thereby reducing the country’s' price competitiveness of other products on the international market.
9
3. The conditional effect of resource revenue on non-resource tax revenue depending on institutions and economic diversification.
In this section, we analyze how natural resource revenue can affect non-resource tax revenue depending on the quality of institutions and the level of economic diversification. Governments in countries with good institutions have more capacity and are more likely to use resource rent for investing in establishing an efficient non-resource taxation system that could support and allow government revenue mobilization during bad conjuncture on commodities markets and when the resource will deplete. Furthermore, resource rich countries with good institutions are more capable to apply resource rents towards productive public investments for supporting production and economic activities in the non-resource sectors and thereby more revenue collection from these sectors.
Basically, citizens expect the government to use resource revenue for improving their living standards (building basic infrastructure, schools and hospitals). Thus, when citizens and taxpayers feel that the government is poorly managing natural resources revenue because of weaknesses in institutions, they will be incited to reject taxes. In fact, taxpayers could anticipate that similarly to resource revenue, the taxes they pay to the government will not serve for financing the public needs but rather the ones of the ruling elites and politicians. Clearly, as resource revenues increase, non-resource tax revenue compliance will tend to decrease if institutions are not functioning well. Accordingly, countries with strong institutions may exhibit greater non-resource tax revenue mobilization performance than their peers with relatively weak institutions. Furthermore, in countries with weak checks and balances, the ruling government could easily use natural resource rents for unproductive purposes rather than strengthening the development of non-resource sectors. This will result in less non-resource tax revenue collection.
Economic diversification refers to the actions undertaken for the structural transformation of the economy by investing in education, health, basic infrastructure and all other productive investments and therefore reduces the higher dependence of the country to one sector, especially the extractives sector. Typically, economic diversification suggests diversification of exports and output away from greater dependence on commodities and change towards broadly based exports and output (Gylfason, 2017), the economic diversification favors the broadening of the non-resource tax base by stimulating the activities of tradable sectors. Accordingly, countries
10
which use natural resource revenues to support economic diversification are likely to collect more non-resource tax revenues.
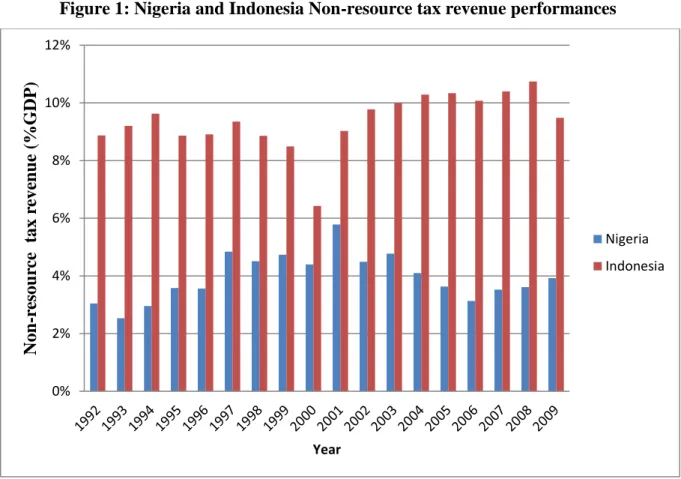
We illustrate this point by comparing the experiences of Nigeria and Indonesia in diversifying their economies in a context of oil exploitation. A study undertaken by the AfDB in collaboration with Bill and Melinda Gates foundation in 2015 reported that Nigeria and Indonesia have experienced oil booms at almost the same period (in the year 1970s). While Indonesia managed to diversify its economy by using oil revenue to accelerate investments in basic infrastructure (schools, roads, and irrigation) and to subsidize fertilizers for boosting agricultural productivity and jobs creation, Nigeria has been affected by the Dutch disease (AfDB and Bill and Melinda Gates, 2015). This has putted down the competitiveness of the agriculture sector and its contribution to the national income. The loss of competitiveness of the agriculture sector has increased the dependency of the government revenue to oil and gas exploitation6 and slowed down the country’s economic diversification (Anyaehie and Areji,
2015). We examine the non-resource tax performance in proportion of GDP for Nigeria and Indonesia over the years where data are jointly available for the two countries. Figure 1 below shows that Indonesia collected much more non-resource tax revenue in proportion of GDP than Nigeria over the period 1992-2009. Nonetheless, the satisfactory point for Nigeria is that it has experienced an increase in non-resource tax revenue from 1993 to 2001. This trend could be traced to efforts made by the Nigerian government for diversifying the economy over this period. However, from the year 2001 to 2009, there is an overall downward trend in Nigeria’s non-resource tax revenue. The non-resource tax revenue decreases probably because the government might have relaxed its efforts in collecting non-resource tax revenue following the increasing oil prices after the year 2000. This trend could also be attributed to potential inefficiencies and challenges encountered by government policies in diversifying the economy. These challenges including poor policies, weaknesses in economic institutions and governance and corruption contributed to lead the diversification index for the country to fall from 0.4 to 0.3 from the period 1991-2000 to the period 2001-2009 (Anyaehie and Areji, 2015).
11
Figure 1: Nigeria and Indonesia Non-resource tax revenue performances
Source: Author’s construction using ICTD/UNU-WIDER GRD (2017).
Within this background, we speculate that natural resources stimulate non-resource tax revenues in countries that are more diversified while they are negatively associated with non-resource tax revenues in less diversified countries. Similarly, we expect natural non-resources boost non-resource tax revenue in countries with good institutions while they are negatively associated with non-resource tax performance in countries with institutional weaknesses. 4. Literature review
The impact of natural resources revenues on tax revenue mobilization tends to be ambiguous in the tax effort literature (Botlhole et al. 2012; Gupta, 2007). For 46 sub-Saharan Africa (SSA) Stotsky and WoldeMariam (1997) find a negative impact of mining to GDP on tax revenues countries over the period 1990-1995. Drummond et al. (2012) confirm the result of Stotsky and WoldeMariam (1997). They find negative association between mining and tax revenues for 28 SSA countries over the period 1990-2010. In the same region, Thomas and Trevino (2013) find that resource revenues have negative impact on non-resource revenue. Based on a sample of 30 oil-producing countries over the period 1992-2005, Bornhorst et al. (2009) find that revenue from hydrocarbon exploitation negatively affects non-resource government revenue. Using
0% 2% 4% 6% 8% 10% 12% Non -r esou rc e tax r eve n u e (% G DP ) Year Nigeria Indonesia
12
panel data for 35 resource-rich countries including 16 African countries over the period 1992-2009, Crivelli and Gupta (2014) find that resource revenues negatively influence non-resource revenue. Ossowski and Gonzales (2012) confirm the eviction effect of resource revenue on non-resource revenue for 15 Latin American countries over the period 1994-2010. Using data for 31 resources depending developing countries, Brun and Diakité (2016) run ordinary least squares regressions and find that while natural resource rents positively affect total tax revenues; they are negatively associated with non-resource tax revenues.
The studies that found negative impact of natural resource revenue on tax revenues explained this result by the fact that the situation of Dutch disease caused by a greater dependence of the economy to the mining and petroleum sector to the detriment of other sectors does not contribute to broaden the non-resource tax base (Brun et al, 2015). In addition, resource-rich countries have strong incentives to relax efforts in mobilizing revenues from non-resource tax bases leading to a lower tax collection effort. Furthermore, for minimizing demand for accountability regarding the management of resource revenue and demand for transfers from the population, governments which collect large natural resource revenue may lower the non-resource tax burden on its taxpayers (McGuirk, 2013; Ross, 2001)
Since natural resources are after all an important source of revenues for the government they may substantially contribute to increase tax revenue. For SSA, Tanzi (1989) finds that the mineral exports in proportion of GDP have a positive impact on tax revenue. Again in SSA, Ghura (1998) also finds a positive impact of mining shares in % of GDP on tax ratio. Keen and Mansour (2010) find that in SSA, over the period 1980-2005, resource-rich countries have performed well than non-resource rich countries in terms of revenue mobilization.
More recently, for 22 oil producing countries around the world, Knebelmann (2017) finds that during the 2000s oil price boom, oil revenue did not crowd out non-oil taxes except for two countries (Equatorial Guinea and Timor-Leste),where there are signs of an eviction effect between oil revenue and non-oil sector.
However, few studies have attempted to find out the factor behind the heterogeneous effect of natural resource revenues on non-resource tax collection. Why do some resource rich countries collect more non-resource tax revenue than others? Botlhole et al. (2012) bring preliminary insights on that particular point. For 45 Sub-Saharan African countries over the period 1990-2007, these authors find that the impact of natural resources rents on non-resource tax revenue is driven by the quality of institutions. More precisely, they find that natural resource rents increase tax revenue in countries with good institutions and decrease tax revenue mobilization
13
in countries with weak institutions. Botlhole et al. (2012) document that countries with good institutions are more likely to set strong apparatus for tax revenue collection through further investment in education, health and public infrastructures. While in countries with bad institutions, natural resources generate rent-seeking behaviors from policy makers and raise the probability of the country to suffer from resource curve situation which is detrimental to tax revenue mobilization.
Belinga et al (2017) extend this line of empirical research. Using 30 resource rich countries over the period 1992-2012, they find that hydrocarbon revenues are likely to have an eviction effect on non-resource revenues. Nonetheless, in line with the findings of Botlhole et al. (2012), these authors underline that the crowding out effect of natural resource revenue on non-resource revenue could be mitigated or reversed with an improvement in the quality of institutions.
5. Econometric methodology
This section develops the empirical model used to estimate the impact of natural resource wealth on non-resource tax revenue and presents in greater details the specification tests as well as the control variables.
5.1 Empirical specification
Because of heterogeneity in natural resources endowment between African countries, the impact of natural resource wealth may not be homogeneous across countries. Moreover, the efficiency in improving the quality of institutions, diversifying the economy away from natural resource sectors and managing natural resources may change gradually over time within each country. Accordingly, the impact of natural resource rents on non-resource tax collection depending on the level of economic diversification and the quality of institutions may change over time within each economy. The Panel Smooth Transition Regression (hereafter PSTR) model developed by Gonzales et al (2005) and Fok et al (2005) is well suited to account for heterogeneity and time variability in the relationship between natural resources revenue and non-resource tax revenues depending on institutions. With the PSTR model, the impact of natural resource revenue on non-resource tax revenues takes different values across countries depending on the state of economic diversification and institutions (regimes). The PSTR assumes that the transition from one regime to another regime is smooth. This is particularly interesting in a context of African countries where most of the time, transition or changes in institutional quality take time. Clearly, economic diversification in Africa appears as a progressive process rather than brutal. In fact, Ghana which is sometimes cited as a good student
14
in terms of governance and institutional quality in Africa has taken time to stabilize, stop the series of coup d’états and improve the quality of institutions. On the other hand, Cote d’Ivoire which was relatively stable since its independence in 1960 has seen her stability and institutions deteriorate over time after the death of the first president from the independence in 1993 with the eruption of a rebellion in 2002 and a post electoral conflict in 2011. To summarize, changes in the quality of institutions and the level of economic diversification takes time, they are not systematic.
The PSTR model allows countries to change gradually over time between the group of “bad institutions” (more diversified) countries and “good institutions” (less diversified) countries depending on the level of institutional quality (economic diversification). The PSTR model is therefore viewed as a regime-switching model allowing for few extreme regimes. It is a generalization of the Panel Threshold Regression (PTR hereafter) of Hansen (1999) in which coefficients of some explanatory variables take different values depending on the value of another variable called the transition variable. The PTR model assumes a sharp shift from a regime to another while the PSTR model allows the coefficients to change smoothly.
Taking 𝑑𝑖𝑡, an economic diversification index as the transition variable, the PSTR model is
given as follows:
𝑵𝑹𝑻𝒊𝒕 = 𝝁𝒊+ 𝜷𝟎𝑵𝑹𝑹𝒊𝒕+ 𝜷𝟏𝑵𝑹𝑹𝒊𝒕 𝒈(𝒅𝒊𝒕, 𝜸, 𝒄) + 𝜶𝑿𝒊𝒕+ 𝜺𝒊𝒕 (1)
where 𝑁𝑅𝑇𝑖𝑡 is non-resource tax revenues and 𝑁𝑅𝑅𝑖𝑡is natural resource rents in country i at time t, for i = 1,..., N, and t = 1,. . . ,T.
The non-resource tax revenue (excluding social contribution) encompasses all the taxes collected from non-resource sectors using tax instruments available in the economy. Data on non-resource tax revenue in proportion of GDP are collected from the International Center for Taxation and Development (ICTD) Government revenue data base (Prichard et al, 2014). Natural resource rent represents the revenue from the export of natural resource (oil, natural gas, coal, mineral and forest) netted from costs generated during its production process. Total natural resources rents are the sum of oil rents, natural gas rents, coal rents, mineral rents, and forest rents as indicated in the statistical notes from the World Development Indicators database of the World Bank.
15
In equation (1), 𝜇𝑖 represents an individual fixed effect and 𝜀𝑖𝑡 the usual independent and identically distributed error term. 𝑋𝑖𝑡 represents the vector of traditional determinants of tax
revenue. 𝑔(𝑑𝑖𝑡, 𝛾, 𝑐) is the transition function. It is a continuous function of the transition variable 𝑑𝑖𝑡, and bounded between 0 and 1, defining the two extreme regimes. When 𝑑𝑖𝑡 equals 0, the impact of natural resources rents (NRR) on non-resource tax revenues (NRT) is 𝛽0 and
when it equals 1, the impact of NRR on NRT is 𝛽0+ 𝛽1.
Following Granger and Teräsvirta (1993) and González et al. (2005) the transition function is specified as the following logistic function: 𝑔(𝑑𝑖𝑡, 𝛾, 𝑐) = [1 + exp (−𝛾 ∏𝑚𝑗=1(𝑑𝑖𝑡− 𝑐𝑗))]
−1
(2) with γ the slope of the transition function (smoothness parameter) and c = (c1; c2,…; cm ) an
m-dimensional vector of threshold /location parameters. For m = 1 (the case we will focus on here in this study) there is one threshold of economic diversification/institutional quality around which the impact of NRR on NRT is non-linear. This non-linear impact is represented by a continuum of parameters between the two extreme regimes early mentioned (𝑔(𝑑𝑖𝑡, 𝛾, 𝑐) =0 and 𝑔(𝑑𝑖𝑡, 𝛾, 𝑐) =1). The first extreme regime which is associated with low values of the
transition variable 𝑑𝑖𝑡 corresponds to the case where the transition function is null
(𝑔(𝑑𝑖𝑡, 𝛾, 𝑐) =0) while the second extreme regime corresponds to the case where the transition function takes the value 1. This latter regime is associated with high values of the transition variable 𝑑𝑖𝑡. Between these extreme regimes, the marginal effect of NRR on NRT is given as follows:
𝜕𝑁𝑅𝑇𝑖𝑡
𝜕𝑁𝑅𝑅𝑖𝑡= 𝛽0+ 𝛽1𝑔(𝑑𝑖𝑡, 𝛾, 𝑐) (3).
The relation (3) suggests that the effect of NRR on NRT is country and time specific as the transition variable 𝑑𝑖𝑡 varies over countries and time. It is worth noting that when the smoothness parameter γ tends toward zero ( , the PSTR model reduces to a simple linear 0) panel fixed effects model. As γ tends to infinity ( the PSTR model reduces to a threshold ) model with two regimes7
5.2 Control variables
Following the literature on tax effort, we include GDP per capita, trade openness, inflation, and agricultural value added as control variables (Crivelli and Gupta, 2014; Eltony, 2002; Ossowski
16
and Gonzales, 2012; Stotsky and WoldeMariam, 1997; Tanzi, 1989; Thomas and Trevino, 2013).
Agriculture value added
Agriculture value added as proportion of GDP is used as a proxy of the sectoral composition of the economy. In Africa, the Agriculture sector in developing sector is dominated by a large number of small farmers who produce for self-consumption or sell their output in informal markets8 or exchange theirs output for other goods9. In addition, most farmers in African countries do not keep modern accountings for the management of their farms. All these aforementioned factors contribute to the complexity of the agricultural sector’s taxation in Africa (Fox and Gurley, 2005; Stotsky and WoldeMariam, 1997; Gupta, 2007). We therefore expected negative impact of agriculture value added on non-resource tax revenues in our estimations.
GDP per capita
GDP per capita measures the level of development. High level of development tends to be correlated with a higher capacity to pay and collect taxes. Moreover, high level of development goes together with high demand for public goods and services (Wagner’s law). The impact of GDP per capita is therefore expected to be positive.
Trade openness
Trade openness expressed as the sum of exports and imports as a percentage of GDP is expected to increase non-resource tax mobilization as trade openness stimulates trade volume and therefore trade taxes. However, in Africa, trade liberalization policies have been implementing by cuts in tariffs. These measures have resulted in losses in tax revenues for some countries (Baunsgaard and Keen10 , 2010) while others have compensated losses in tariffs by domestic taxes (Bird and Gendron, 2007; Cnossen, 2015) rending thereby difficult the prediction of the impact of trade openness on non-resource tax revenue.
8 Agriculture is often used as a proxy of the informal sector (see Mahdavi, 2008) 9 It is typically subsistence agriculture (Drummond et al, 2012).
10 These authors reveal that low income countries have recovered at most 30 cents per dollar lost in tariffs
17
Inflation
Inflation is proxied by the percentage change in average consumer prices. Its effect on non-resource tax-to-GDP ratio, the so called "Oliveira-Tanzi effect" is assumed to be negative because of lags in tax collection. Indeed, with high inflation rate, the real value of taxes is likely to decrease between the date of implementation and the effective date when tax is collected. However, because of climb in sales in nominal terms due to inflation, the turnover of firms might exceed the threshold of value added tax (VAT) liability making these firms now liable to VAT and then lead to increase VAT revenue if there is no explicit VAT threshold adjustment (ATAF11, 2017). This latter consideration complicates the prediction of the effect of inflation on non-resource tax revenue.
5.3 Specification tests and Estimation method
Before estimating equation (1), we need to perform some specifications tests. The first batch of tests is the linearity test. It tests the homogeneity of the coefficient for the relationship between natural resource rents and non-resource tax revenue conditional to the transition variable. In other words, the linearity test indicates whether the PSTR model is preferable than a linear model to estimate the impact of natural resource rents on non resources tax revenues. The rejection of the null hypothesis (H0: Linear fixed effects panel) against the alternative (H1: PSTR with m regimes) suggests that the PSTR model is suited to estimate equation (1).
The homogeneity test in the PSTR model is performing by testing: H0: γ = 0
or H0: β1 = 0 against the alternative H1: γ≠ 0 or β1 ≠0. However, these tests are nonstandard since the PSTR model contains unidentified nuisance parameters under the null hypothesis (Hansen, 1996, Gonzales et al, 2005). This identification problem is solved by replacing the transition function g(𝑑𝑖𝑡; γ; c) by its first-order Taylor expansion around γ = 0 and to test with an equivalent hypothesis based on the following auxiliary regression:
𝑁𝑅𝑇𝑖𝑡 = 𝜇𝑖 + 𝛽0∗𝑁𝑅𝑅
𝑖𝑡 + 𝛽1∗𝑁𝑅𝑅𝑖𝑡𝑑𝑖𝑡 + 𝛼∗𝑋𝑖𝑡+ ⋯ + 𝛽𝑚∗𝑁𝑅𝑅𝑖𝑡𝑞𝑖𝑡𝑚𝜀𝑖𝑡+ 𝜀𝑖𝑡∗ (4)
where 𝛽0∗ , 𝛽1∗ and 𝛽𝑚∗ are multiple of γ and 𝜀
𝑖𝑡∗ is the usual error term plus the remainder of the
Taylor development 𝜀𝑖𝑡∗ = 𝜀𝑖𝑡+ 𝑅(d_it; γ; c). Accordingly, testing linearity against the PSTR model becomes testing H0: 𝛽0∗ = 𝛽1∗ = 𝛽𝑚∗=0 in the auxiliary equation which is linear.
18
Following Colletaz and Hurlin (2006), the test decision relies on the LM, F-version LM, and pseudo-LR tests and their statistics are given as follows:
LM = TN (SSR0−SSR1)/SSR0 ((follows Chi2 (mk))
LMF = [(SSR0−SSR1) /mK] / [SSR0/ (TN−N−m(K + 1))] ∼ F(mk; TN –N-m(k+ 1))
LR = −2 [log(SSR1)− log(SSR0) ]. LR follows Chi2 with mk degree of freedom, LR∼Chi2 (mk).
where SSR0 is the panel sum of squared residuals under H0 (linear panel model with individual effects), SSR1 the panel sum of squared residuals under H1 (PSTR model with two regimes), and K the number of explanatory variables.
After the linearity/homogeneity test, the second specification test is the number of regimes test. This test seeks to determine the appropriate number of transition functions (m), implicitly the number of regimes (r+1) in the PSTR model.
The null hypothesis of the test of number of regimes is H0: the PSTR model has one transition function (m = 1) while the alternative hypothesis is H1: the PSTR model has at least two transition functions (m = 2). The decision of the test is based on the statistics of LMw and LMf. If the coefficients are statistically significant at the 5%, the null hypothesis is rejected suggesting that there are at least two transition functions for the PSTR model. In this case, a two-regime PSTR model is then estimated. If the two regime model is also rejected, a three regime model is estimated. The testing procedure continues like that until the non-rejection of the null hypothesis of no remaining heterogeneity.
The non-rejection of H0 suggests that the model has one transition function, two regimes. The estimation method of the PSTR consists of eliminating the individual fixed effects μi by
removing country specific means and then applying non-linear least squares to the transformed model (Gonzalez et al, 2005).
6. Data
Regressions are carried out using a sample of 29 African countries12 over the period 1995-2012.
We extract natural resource rents data from the World Development Indicator (WDI), the World
12 The list of countries is given in appendix.
19
Bank database. Natural resource rents is the revenue from the export of natural resources (oil, natural gas, coal, mineral and forest) netted from their production costs.
We measure institutional quality by the government stability index13 from international Country Risk Guide (ICRG). The higher the index, the better institutions. Government stability is crucial for converting natural resources revenue towards non-resource sectors development. In fact, when the members of the ruling government feel that the uncertainties are increasing about the future of their stay in power, they may be motivated to adopt rent seeking behaviors before the possible end of their regime. Practically, they will ignore the implementation of broaden based policies that promote the development of non-resource sectors activities while grabbing resource revenue to finance their supporters and buying opponents for organizing resistance. They could also lessen the tax burden on groups of taxpayers for getting their support in order to resist and stay in power.
The dependent variable, non-resource tax revenue is directly extracted from the Government Revenue Database (GRD) of the International Centre for Tax and Development (Prichard et al, 2014). Non-resource tax revenue encompasses all the taxes collected from tax base other than natural resources. The control variables including trade openness, inflation, agriculture value added and GDP per capita are taken from the World Development Indicators database, the World Bank.
We measure economic diversification by the share of manufactures exports in the total exports of merchandise. This indicator provides an interesting picture about the structure of exports and could therefore reflect an acceptable measure of economic diversification. Data on manufactures exports in percent of merchandise exports are extracted from WDI, the World Bank database. As indicated in the statistical notes of the WDI database, manufactures include chemicals, basic manufactures, machinery and transport equipment, and miscellaneous manufactured goods, and exclude non-ferrous metals. The three linearity tests validate the preference for the PSTR model with manufactures as transition variable comparatively to the linear model
Given that large countries with relatively vast internal market may not export much to the rest of the world, exports diversification index may show partial picture of the state of
13The government stability index from ICRG indicates the ability of the government to stay in office and to
implement its program. Government unity, legislative strength and popular support are the three components used to construct the government stability indicator (see ICRG methodology).
20
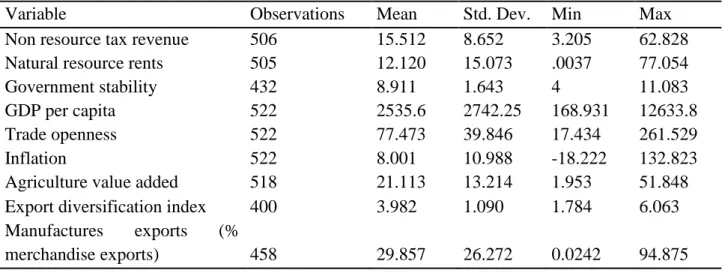
diversification. However, since African countries tend to be more outward oriented because of the relatively small size of their internal markets, we think that an exports based diversification index is suitable and acceptable as an economic diversification index for African economies (Alsharif et al, 2017). Descriptive statistics on all these variables are provided in table 1 below. For our sample, on average the non-resource tax revenue is 15.5% of GDP while natural resource rents account for 12% of GDP (table 1). On average, manufactures exports account for 30% of total merchandise exports for the countries under investigation in this study (table 1).
Table 1: Descriptive statistics
Variable Observations Mean Std. Dev. Min Max
Non resource tax revenue 506 15.512 8.652 3.205 62.828
Natural resource rents 505 12.120 15.073 .0037 77.054
Government stability 432 8.911 1.643 4 11.083
GDP per capita 522 2535.6 2742.25 168.931 12633.8
Trade openness 522 77.473 39.846 17.434 261.529
Inflation 522 8.001 10.988 -18.222 132.823
Agriculture value added 518 21.113 13.214 1.953 51.848
Export diversification index 400 3.982 1.090 1.784 6.063
Manufactures exports (%
merchandise exports) 458 29.857 26.272 0.0242 94.875
Source: Author’s calculations from ICTD-GRD (Prichard et al, 2014); WDI, ICRG and IMF (2017).
7. Impact of natural resource rents on non-resource tax revenue: specification tests and Estimation results
This section first presents results from specification tests and those obtained from the estimation of the impact of natural resources rents on non-resource tax revenue depending on institutions and diversification. Then, results from various robustness analyses are presented and finally, the section comes up with policy implications which could be drawn from the study.
7.1 Linearity and unit root tests
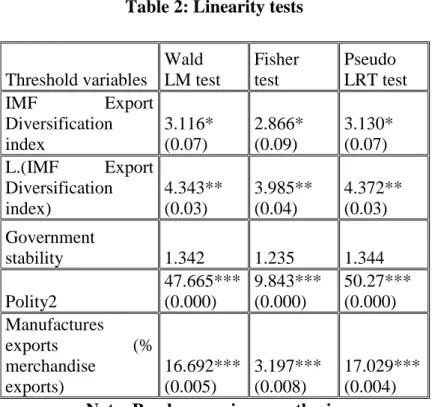
The linearity tests results are reported in table 2 below. The three linearity tests reject the null hypothesis of linearity of the relationship between natural resource rents and non-resource tax revenue conditional to the level of economic diversification suggesting that the impact of
21
natural resources rents on non-resource tax revenue depends on the country’s economic diversification. The PSTR model is therefore appropriate for our case.
Table 2: Linearity tests
Threshold variables Wald LM test Fisher test Pseudo LRT test IMF Export Diversification index 3.116* (0.07) 2.866* (0.09) 3.130* (0.07) L.(IMF Export Diversification index) 4.343** (0.03) 3.985** (0.04) 4.372** (0.03) Government stability 1.342 1.235 1.344 Polity2 47.665*** (0.000) 9.843*** (0.000) 50.27*** (0.000) Manufactures exports (% merchandise exports) 16.692*** (0.005) 3.197*** (0.008) 17.029*** (0.004) Note: P-values are in parenthesis.
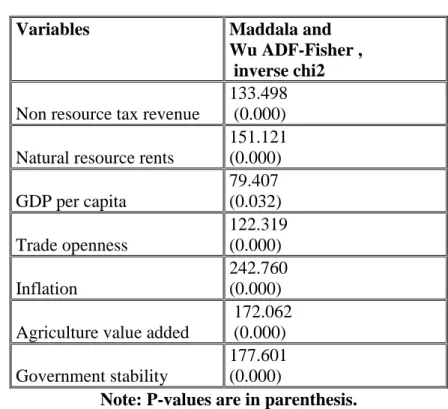
Before carrying out regressions, we run panel unit root test to see whether the variables under consideration are stationary as the time dimension of our panel is relatively long. We apply Maddala and Wu (1999) (Fisher type test) to take into account the heterogeneity of our panel data (in terms of natural resources rents, non-resource tax collection and economic diversification) and the fact that the panel data is unbalanced. Results from Fisher test reported in Table 3 below indicates that for all the variables the null hypothesis of non-stationarity is rejected.
22
Table 3: Fisher type unit root test
Variables Maddala and
Wu ADF-Fisher , inverse chi2 Non resource tax revenue
133.498 (0.000) Natural resource rents
151.121 (0.000) GDP per capita 79.407 (0.032) Trade openness 122.319 (0.000) Inflation 242.760 (0.000) Agriculture value added
172.062 (0.000) Government stability
177.601 (0.000)
Note: P-values are in parenthesis.
7.2 PSTR estimation of the impact of resource rents on non-resource tax revenue depending on diversification
This subsection analyses and discusses the main results obtained from the estimation of the empirical model.
7.2.1 Main results
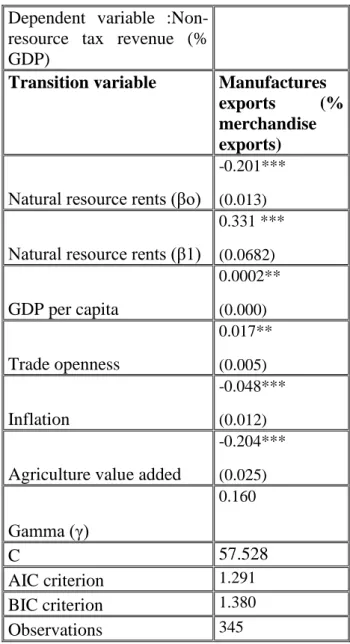
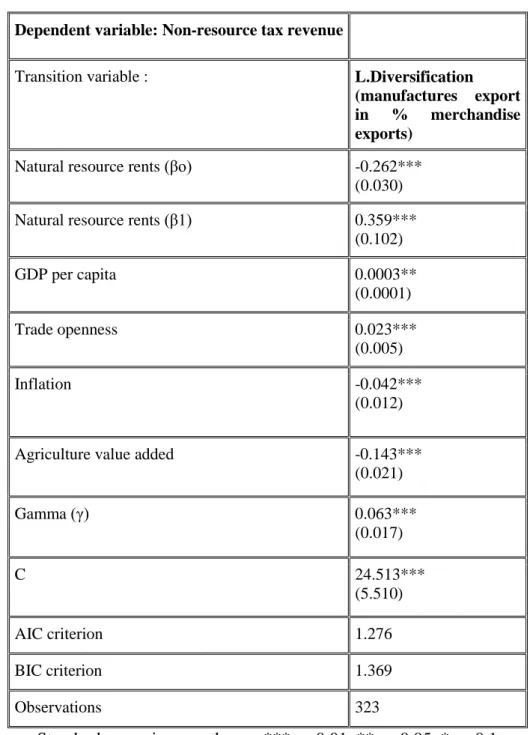
Table 4 displays the results obtained from the estimation of the PSTR model. The direct impact of natural resources rent on non-resource tax revenue (measured by βo) is negative and statistically significant at 5% (table 4). This result is in line with those found in previous work indicating that natural resources revenue undermine the governments’ effort to properly tax non-resource sector (Brun et al, 2015, Crivelli and Gupta, 2014). While the direct effect of natural resources rents on non-resource tax revenue is negative, the effect of its interaction with economic diversification (nonlinear effect) is positive. In other words, this result reveals that natural resource rents contribute to non-resource tax revenue mobilization in more diversified economies while they slow down non-resource tax collection only in less diversified economies.
The location parameter for this regression C=32.990 is higher than the average manufacturing exports (the threshold variable) equals to is 29.857, suggesting that countries with
23
manufacturing exports level below the threshold value 29.857 need additional efforts towards improving economic diversification to reverse the crowding out effect of natural resource rents on non-resource tax revenue collection.
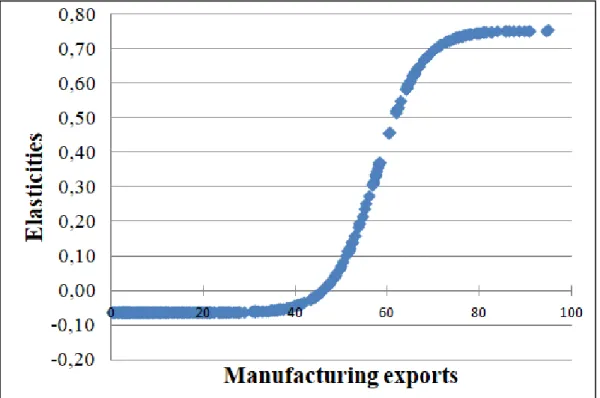
We plotted in figure 2 the elasticity of non-resource tax revenue with respect to resource rents, depending on the values of manufacturing exports. From the lower to higher regimes, the elasticity of resource rents with respect to non-resource tax revenues smoothly increases as manufacturing exports (the threshold variable) increase. Accordingly, any improvement in diversifying the economy (higher manufacturing exports) will result in a gradual increase in the non-resource tax revenue effect of resource rents (from -0.063 to 0.754).
Figure 2: Elasticities of non-resource tax revenue with respect to resource rents conditional on manufacturing exports.
24
Table 4: Impact of Natural resources rents on Non-resource tax revenue depending on economic diversification
Dependent variable :Non-resource tax revenue (% GDP)
Transition variable Manufactures
exports (%
merchandise exports) Natural resource rents (βo)
-0.201*** (0.013)
Natural resource rents (β1)
0.331 *** (0.0682) GDP per capita 0.0002** (0.000) Trade openness 0.017** (0.005) Inflation -0.048*** (0.012)
Agriculture value added
-0.204*** (0.025) Gamma (γ) 0.160 C 57.528 AIC criterion 1.291 BIC criterion 1.380 Observations 345
Notes: Standard errors are in parentheses. *** p<0.01, ** p<0.05, * p<0.1.
7.2.2 Further analysis: overview on country-specific cases.
For few number of countries, the economic diversification indicator over the period 1995-2012 have been generally above or below the threshold value identified in the estimation. More precisely, countries such as Botswana, Lesotho, Morocco, Mauritius, Swaziland, Tunisia and South Africa have always had the maximum impact of resource rents on non-resource tax revenue (higher regime) as their manufactures exports in percentage of total merchandise exports were most of time above the threshold. This result suggests that these countries have been efficient in using resource rents towards stimulating non-resource tax revenue mobilisation through diversification. In other words, these countries did not experience any
25
crowding out effect of resource rents on non-resource tax collection because of their relatively advanced level of economic diversification.
The presence of Botswana among the group of countries where resource rents do not crowd out non-resource tax revenue collection is not surprising. In fact, Botswana has received praise and has gained a worldwide reputation for its management of extractive resources wealth. The success of Botswana, among other factors is related to the fact that the country has placed a attention to the development of non-mining sector.
Indeed, from the beginning of mining exploitation in the country (1970s), the authorities have always kept in mind that the role of extractives in the economy will eventually decline. Accordingly, the government used revenue from extractives resources as a platform to boost the diversification of the economy. In fact, the policy in Botswana aimed at utilising revenues collected from minerals to finance investments in other sectors in order to create a strong basis for revenue generation that can eventually replace mineral revenue. Accordingly, almost the entire mineral wealth was used to finance investments in education, healthcare and physical capital. For instance, during the period 1983-1984 to 2014-2015, the total mineral revenues amounted to BWP406bn (US$39bn, €33bn) at 2012 prices, and these revenues were almost entirely invested in physical and human capital (ANRC, 2016b). This policy has spurred the development of the private sector and has reduced the importance of the mining sector in the economy. In fact, from 2004 to 2014, the non-mining private sector grew by 128 percent, while the mining sector collapsed by 13 percent (ANRC, 2016b). The ANRC (2016b) argues that these developments (faster growth of the non-mining sector compared to the mining sector) provide an indication that economic diversification policies in Botswana have to some extent succeeded. The tendency towards diversifying the economy away from mining sector has fostered the development of non-mining sectors and has therefore sustained greater tax revenue collection from these sectors. As early mentioned, in addition to Botswana, we also find positive impact of resource rents on non-resource tax revenue collection for some countries like Swaziland, Morocco and Tunisia. In spite of the potential institutional deficiencies in these countries, resource rents favour the mobilisation of non-resource tax revenue because of the relatively more advanced state of economic diversification in these countries compared with their peers. This result suggests that beyond institutions, economic diversification could reverse the crowding-out effect of resource revenue on non-resource tax collection.
26
In contrast, for countries like Algeria, Cameroon, Nigeria, Sudan, Republic of Congo, Gabon Mali, Burkina Faso, Malawi, Côte d’Ivoire, Ghana and Tanzania, resource rents have experienced a crowding out effect of resource rents on non-resource tax revenue mobilisation because of weak economic diversification level, such that higher resource rents, not only relax government efforts in collecting taxes from non-resource sectors, but also in some extent, shrink the development of these sectors.
Nonetheless, for some countries like Togo, there is change in the impact of resource rents on non-resource tax revenue. For this country, the impact of resource rents on non-resource tax revenue shifted from negative values (low regime: -0.063) to positive value (high regime: 0.61). Togo achieved in 2003 the critical threshold of manufactures exports in percent of total merchandise exports for which the crowding out effect of resource rent on non-resource tax revenue is reversed. In fact, over the last two decades, in Togo, efforts have been made to diversify the economy away from phosphate and cotton in order to develop the industrial sector and to attract foreign direct investments, especially with the creation of a free trade zone for exports processing and the construction of roads infrastructures. The country has also strengthened and has modernized the equipment and the capacities of the port of Lomé in order to revitalize the country's transit function in the West African Economic and monetary Union (WAEMU) region, mainly for the landlocked countries (Mali, Burkina and Niger). As a result, based on the IMF Theil diversification index, in its 2017 report on international trade, the Central Bank of West African Countries remarked that Togo is one the WAEMU countries which has recorded the highest performance in improving the economic diversification over the period 2006-2017.
Adversely for countries such as Senegal, the degradation of the business environment since the year 2000s which has slowed down economic diversification has ultimately (ceteris paribus) negatively affected the elasticity of non-resource tax revenue to resource rents (transition from high non-resource tax revenue regime to low regime). Indeed, as explained in Jude and Levieuge (2016), Senegal has implemented a package of policy reforms aiming at improving the country's business climate. These reforms contribute to the emergence and the development of indigenous enterprises. However, during the 2000s, frequent government change with its corollary of concentration of executive power, and sometimes high state interference in the economy. This has reduced the activities of foreign investors in the country and finally slowed down the diversification of the economy and thereby negatively affect non-resource tax collection. This result could serve as a lesson for Senegal which is expected to start oil
27
production in 2021. The country may consider paying attention to factors that sustain economic diversification such that the country does not suffer from the crowding out effect of oil exploitation on non-resource tax collection.
Finally, we find that the elasticity of non-resource tax revenue to resource rents has been volatile for a certain number of countries where the economic diversification indicators fluctuate. Namibia and Madagascar are among these countries.
Although Namibia has achieved significant development outcome (the country’s GDP per capita was USD 5 227,18 in 2017, WDI) thanks to mining exploitation, the country's level of economic diversification is still relatively low mainly because of weak backward and forward linkages between mining sector and non-mining sectors. Nonetheless, over the past two decades efforts have been made towards the diversification of the economy. The manufacturing sector’s contribution to GDP increased from 5.3 percent in 1990 to 11.3 percent in 2012, mainly due to the quick development of fish and meat processing and some mineral beneficiation. As a result, over the periods 2000-2002 and 2004-2006, the country even exhibits positive elasticity of non-resource tax revenue with respect to non-resource rents. However, from 2010 to 2012 the country’s elasticity of non-resource tax revenue to resource rents was negative while it was positive for the year 2009.
Basically, one of the real challenges with Namibian economic diversification is the fact that the manufacturing sector is concentrated on mineral processing activities, such that the manufacturing exports and therefore economic diversification is vulnerable to fluctuations of mineral prices. Consequently, the country could not enjoy better non-resource tax collection both in periods of mining booms (because of relaxing effort in collecting taxes from other non-mining sectors) and non-mining busts (because of weak tax potential from non-non-mining sectors due to a potential slowdown in the mineral processing manufacturing activities). The country therefore could consider scaling up its diversification level by strengthening the productivity of the agro-industry
7.3 Estimation results of non-resource tax revenue elasticity to resource rents depending on institutions
We now turn to the estimation of the effect of natural resources rents on non-resource tax revenue depending on the quality of institutions. Government stability is used as measure of institutional quality and therefore as the transition variable in the PSTR model. However, the
28
three linearity tests carried out using government stability as the transition variable fail to reject the linearity hypothesis (table 2 in appendix) suggesting that the PSTR model is not suitable to test for the non-linear effect of natural resource rents on non-resource tax revenue depending on government stability14. Accordingly, as Botlhole et al (2012), we estimate a simple panel data model by including the interaction term between natural resource rents and government stability as an explanatory variable to test for the non-linear effect of natural resources rents on non-resource tax revenue depending on the institutions. The estimation results from the fixed effects panel data model are reported in table 5. In column (1) of table 5, we both introduce natural resource rents and government stability as explanatory variables, but we do not include their interaction term as control variable. Column (2) reports results obtained from panel fixed effects estimator with Driscoll Kray (DK-FE) autocorrelation and heteroskedasticity standard errors correction. The results show that natural resource rents negatively affect non-resource tax revenue while government stability fosters non-resource tax collection. In column (2) of table 5, we introduce the interaction term of natural resource rents and government stability. The interaction term is positive and statistically significant at the 5% level suggesting that as the quality of institutions improves, natural resources revenue becomes an important engine of non-resource tax revenue. Natural resource rents still negatively affect non-resource tax revenue and government stability is always positively associated with better non-resource tax mobilization. In summary, our estimation results show that natural resource rents slow down non-resource tax revenue in countries with weak institutions while they stimulate non-resource tax ratio in countries with better institutions.
14 Similar results were found when we use an alternative indicator of institutional quality, namely political
29
Table 5: Non-linear effect of natural resource rents on non-resource tax revenue: fixed effects model with interaction term.
Non-resource tax revenue (1)
FE-DK
(2) FE-DK Natural resource rents (Rents) -0.044** -0.046* (0.019) (0.025) Government Stability 0.161*** 0.157** (0.047) (0.059) Rents*Government Stability 0.0002** (0.002) GDP per capita 0.002*** 0.002*** (0.000) (0.000) Trade openness 0.039*** 0.039*** (0.011) (0.011) Inflation -0.01 -0.01 (0.00845) (0.00827) Agriculture value added -0.033*** -0.033***
(0.010) (0.008) Constant 7.091*** 7.116***
(1.454) (1.395)
Observations 398 398 Number of countries 24 24
Standard errors in parentheses; *** p<0.01, ** p<0.05, * p<0.1 7.4 Robustness analysis
In this subsection, we analyze whether the main results obtained from the estimation of the baseline equation (equation 1) remain unchanged under some circumstances.
7.4.1 Alternative indicators of economic diversification and the quality of institutions. Alternative indicator of institutions
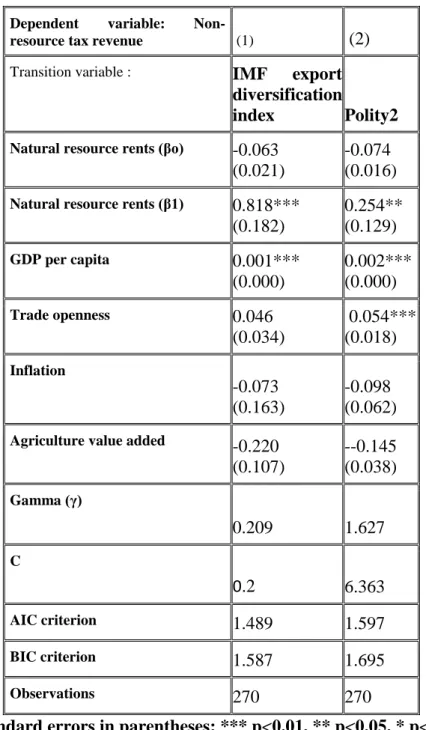
We test whether our results resist to a change in the indicator of institutional quality. Since institutions are likely to work better in democratic regimes than autocratic ones, we use as institutional variable the indicator Polity from polity IV database (Marshall et al, 2014). In addition to the fact that it covers many countries over long period, Acemoglu et al (2003) argue that this indicator “is conceptually attractive since it measures institutional and other constraints that are placed on presidents and dictators (or monarchies)” (p.52). The indicator polity ranges from -10 (autocratic) to +10 (democratic) regimes. The linearity tests validate the PSTR model with polity as the transition variable (table 2). The PSTR estimation results using polity as threshold variable are reported in table 6. The main findings of the chapter remain
30
qualitatively unchanged. Natural resources rents are negatively associated to non-resource tax revenue. However, with better institutions, natural resources rents foster non-resource tax collection in Sub-Saharan Africa (table 6, column 2) suggesting that the baseline results of this study are robust to the use of alternative indicator of institutions.
The threshold variable C=6.116 while the average polity index for the countries under consideration is equal to 1.4 suggesting that African countries should significant increase effort to improve institutions such that natural resource rents contribute to enhance non-resource tax revenue. Indeed, countries such as Botswana, Namibia, South Africa and Mauritius well known for their relative political stability and for their relatively well functioning institutions have always had the maximum elasticity of non-resource tax revenue with respect to resource rents depending on the quality of institutions.
More interestingly, countries such as Ghana, Kenya and Lesotho shift from negative elasticity of non-resource tax revenue with respect to resource rents conditional on the institutions to positive elasticities. The critical threshold of the indicator of institutions quality (polity2) has been achieved in Ghana in 2001. For Ghana, it was the period of government instability with the series of coups d’etats from 1966 (ten years after its independence) to 2000 which has led to a negative effect of resource rents on non-resource tax revenue. In fact, since 2000, efforts made by Ghana in moving away from political instability and establishing democratic institutions have contributed, all things being equal, to reverse the crowding out effect of resource revenue on non-resource tax revenue mobilization. Indeed, in 2000, under the provision of the fourth republic, Jerry Rawlings, the ruling president was prohibited by term limits provision for running for a third presidential mandate. The opposition party's candidate, John Kufour won the presidential elections that year. This orderly transition between parties was an important signal of the political stability of Ghana. The president John Kufour focused his actions in developing Ghana's economy and enhancing the country’s' international reputation. As a result, he was reelected in 2004. However, in 2008, after two mandates, Kufour cannot run for a third presidential mandate. Thus, in 2008, John Atta Mills, Rawlings' former Vice-President who had lost to Kufour in the 2000 elections, won the election and therefore replaced Kufour. In 2012, the president John Atta Mills passed away in office and his Vice-President, John Dramani Mahama, temporarily replaced him. After this peaceful and smooth transition of power to Dramani Mahama, in 2012, subsequent presidential elections were organised in the same year as provided by the constitution. John Dramani Mahama won that election. In 2016, Nana Akufo Addo defeated Mahama in a single round during general
31
elections. This was the first time that a ruling president failed to win a second presidential term in Ghana. Despite that, the transition of power from Dramani Mahama to Akufo Addo was on overall peaceful.
Alternative indicator of diversification
While manufactures exports in percent of merchandise exports measures the structure of exports across products categories, this measure however does not capture the number of exported products, which, yet reflects the diversity of exported products. The economic diversification indicator (export diversification index) developed by the International Monetary Fund15 (IMF) takes into account this consideration. Indeed, this index considers both extensive export diversification (reflecting change in the number of export products) and intensive export diversification (reflecting change in the shares of export volumes across export products such that a country is considered less diversified when only a few sectors are driving export revenue, even if the country is exporting many different goods). Higher values of the index indicate lower exports diversification. For robustness check, we alternatively use the IMF export diversification index as the economic diversification indicator. To facilitate the interpretation of results, we inverse the diversification index in our regressions so that higher values of this index reflects higher economic diversification of in the country’s under investigation.