HAL Id: hal-02059517
https://hal.archives-ouvertes.fr/hal-02059517
Preprint submitted on 6 Mar 2019
HAL is a multi-disciplinary open access archive for the deposit and dissemination of sci-entific research documents, whether they are pub-lished or not. The documents may come from teaching and research institutions in France or abroad, or from public or private research centers.
L’archive ouverte pluridisciplinaire HAL, est destinée au dépôt et à la diffusion de documents scientifiques de niveau recherche, publiés ou non, émanant des établissements d’enseignement et de recherche français ou étrangers, des laboratoires publics ou privés.
Export competitiveness - Fuel Price nexus in Developing
Countries: Real or False Concern?
Kangni Kpodar, Kodjovi Eklou, Stefania Fabrizio
To cite this version:
Kangni Kpodar, Kodjovi Eklou, Stefania Fabrizio. Export competitiveness - Fuel Price nexus in Developing Countries: Real or False Concern?. 2019. �hal-02059517�
fondation pour les études et recherches sur le développement international
LA FERDI EST UNE FOND
A TION REC ONNUE D ’UTILITÉ PUBLIQUE . ELLE ME T EN ŒUVRE A VEC L ’IDDRI L ’INITIA TIVE POUR LE DÉ VEL OPPEMENT E
T LA GOUVERNANCE MONDIALE (IDGM).
ELLE C
OORDONNE LE LABEX IDGM+ QUI L
’ASSOCIE A U CERDI E T À L ’IDDRI. CE T TE PUBLIC A TION A BÉNÉFICIÉ D ’UNE AIDE DE L ’É TA T FR ANÇ AIS GÉRÉE P AR L ’ANR A U TITRE DU PROGR A MME «INVESTISSEMENT S D ’A VENIR» POR
TANT LA RÉFÉRENCE «ANR-10-LABX
-14-01».
Export competitiveness - Fuel
Price nexus in Developing
Countries: Real or False
Concern?*
Kangni Kpodar, Stefania Fabrizio and Kodjovi Eklou
Kangni Kpodar, Deputy Division Chief, International Monetary Fund (IMF)
and Senior Fellow at FERDI. Email : [email protected]
Stefania Fabrizio, Deputy Chief, International Monetary Fund (IMF).
Email : [email protected]
Kodjovi Eklou, Economist at International Monetary Fund (IMF).
Email : [email protected]
Abstract
This paper investigates the impact of domestic fuel price increases on export growth
in a sample of 77 developing countries over the period 2000-2014. Using a fixed-effect
estimator and the local projection approach, we find that an increase in domestic
gasoline or diesel price adversely affects real non-fuel export growth, but only in the
short run as the impact phases out within two years after the shock. The results also
suggest that the negative effect of fuel price increase on exports is mainly noticeable
in countries with a high-energy dependency ratio and countries where access to
an alternative source of energy, such as electricity, is constrained, thus preventing
producers from altering energy consumption mix in response to fuel price changes.
Keywords: Retail fuel prices, Fuel Subsidies, Export growth, Developing countries. JEL Classification: F10, O13, Q43.
* This research is part of a Macroeconomic Research in Low-Income Countries project (Project id: 60925) supported by the UK Department for International Development (DFID). The views expressed in this paper are those of the authors and do not necessarily represent the views of the International Monetary Fund (IMF), its Executive Board, IMF management, or DFID. We thank Christian Bogmans, Reda Cherif, John Hooley, Yanki Kalfa, David Laborde, Sandra
Dev
elopment Po
lic
ie
s
Wo
rkin
249
g Paper
February 2019“Sur quoi la fondera-t-il l’économie du monde qu’il veut gouverner?
Sera-ce sur le caprice de chaque particulier? Quelle confusion! Sera-ce
sur la justice? Il l’ignore.”
Contents Page
1. Introduction ... 3
2. Channels of transmission and related literature ... 4
3. Empirical strategy and results ... 8
3.1. Data and model specification ... 8
3.2. Some stylized facts ... 11
3.3. The effect of domestic fuel price changes on external competitiveness: fixed-effect estimations ... 12
3.4. Testing for conditioning factors: energy dependency and access to alternative source of energy ... 18
3.5. Disentangling short-term from long-term effects: the local projection approach... 19
3.6. Robustness tests ... 27
4. Conclusion and policy implications ... 29
References ... 30
Figures 1. The distribution of Fuel Prices in the Sample ... 11
2. Movements in Fuel Prices and Real Non-Fuel Export Growth ... 12
3. Energy Dependency and Correlation Between Fuel Price Changes and Real Non-Fuel Export Growth ... 12
4. Marginal Effect Conditioning on Energy Dependency ... 24
6. Local projection - Baseline estimates ... 26
7. Conditional effect - Energy dependency ... 27
8. Conditional effect - Access to Electricity ... 28
Tables 1. Real Export Growth and Fuel Price changes: Baseline with Gasoline Price ... 14
2. Real Export Growth and Fuel Price changes: Baseline with Diesel Price ... 15
3. Real Export Growth and Fuel Price Changes: Testing for Non-Linearity ... 17
4. Conditioning Factor: Energy Dependency ... 20
5. Conditioning Factor: Access to Electricity ... 22
Appendix tables 1. Variable Definition and Sources ... 33
2. Summary Statistics... 34
3. Baseline with Gasoline Price: Controlling for Oil Rents. ... 35
1. Introduction
Despite progress, many developing countries still have a tight control on domestic fuel prices. This translates into a freeze in fuel pump prices for a relatively long period, or at best a low pass-through of changes in international oil prices to domestic fuel prices. This has resulted in large fuel subsidies, the pitfalls of which regarding fiscal cost, inequity, and environmental damages, cannot be overstated (see Coady et al., 2010; Clements et al., 2013 for more discussions). In countries that have considered reforming subsidies, a central concern of policy makers is the potential adverse impact of higher domestic fuel prices on competitiveness, notably for export-oriented sectors. Despite the current favorable environment of relatively low international oil price, fuel subsidies are still prevalent, and the competitiveness-fuel prices nexus remains a relevant policy question, more so as international oil prices are gradually recovering. Yet, there is a relatively limited empirical literature on the issue, especially using macroeconomic level data in developing countries.
The potential impact of fuel price increases on competitiveness is not straightforward.1 On the one
hand, higher fuel prices may hamper competitiveness by directly increasing input costs (Rentschler et al., 2017) for fuel, but also for other inputs whose production requires fuel. On the other hand, to the extent that an increase in domestic fuel prices result in a reduction in fuel subsidies, this could free up fiscal space for growth-enhancing public spending that may boost competitiveness. In addition, higher fuel prices may also shift resources away from less productive and energy-intensive activities, thereby improving resources allocation and minimizing market distortions which can positively affect competitiveness (Saunders and Schneider, 2000; Ellis, 2010; Whitley and van der Burg, 2015). Given that the direction of the impact is not clear cut, the competitiveness-fuel prices nexus is therefore an empirical question.
In this paper, we provide an empirical investigation of the effect of fuel price changes on external competitiveness in a sample of 77 developing countries over the period 2000 – 2014, taking advantage of an original fuel price database compiled by Kpodar and Abdallah (2017). Specifically, the paper tackles the following questions: (i) Does an increase in domestic fuel prices hamper a country’s external competitiveness as reflected in export performance? (ii) Does energy dependency or access to other energy sources play a role as a conditioning factor? (iii) Do these effects depend on the temporal horizon (short versus medium-long run)? The rationale of focusing on external competitiveness is twofold. First, since the paper is looking at competitiveness at the
1 In this paper, the term competitiveness refers to export performance and fuel prices refer to domestic prices, unless
macro level and domestic firms are typically subject to the same fuel prices, a natural approach is to assess how a country fares in the international trade market following an increase in fuel prices. Second, policy makers are more concerned about export-oriented sectors because developing countries are often price-takers in world markets, and producers may not be able to pass on the cost increase to final consumers without the risk of losing market shares.2
The results from fixed-effect estimations show that domestic gasoline or diesel price increases do have a negative effect on real non-fuel export growth, confirming previous findings using industry level data (e.g. Sato and Dechezleprêtre, 2015; Aldy and Pizer, 2015). Nevertheless, while this negative impact is mild or non-significant for countries with a low energy dependency ratio, it becomes significant and sizeable for countries with high energy dependency ratios, arguably where energy inefficiencies are more pronounced. Furthermore, the adverse effect of fuel price increases on exports declines with better access to electricity. Finally, to disentangle the short run dynamics from medium-long run ones, the local projection approach is used to estimate how shocks to fuel prices affect export growth in a dynamic setting and how persistent are these shocks over time. The findings support the adverse effect of fuel price shocks on export growth, but the impact is short-lived as it is mostly concentrated within the first two years after the shock and becomes weaker and non-significant thereafter.
The paper is structured as follows. Section II discusses the theoretical channels and related literature. Section III is focused on data analysis and some stylized facts. Section IV lays out the empirical approach and discuss the results. Finally, Section V concludes and draws some policy implications.
2. Channels of transmission and related literature
How changes in fuel prices may affect competitiveness?
Similar to households, energy price increases affect firms through two channels: the direct and the indirect channel. The direct channel refers to the increase in energy input costs. This is the first-round impact that is instantaneous unless energy input prices are hedged (Rentschler et al., 2017). The degree of firms’ exposure will depend on the amount of energy needed to produce one unit of output. The indirect channel refers to the increase in the production cost of intermediate inputs as energy price increases feed through the supply chains and lead to the increase in the price of other goods and services. For instance, higher fuel prices will increase transportation costs, both related to the production of inputs but also to bringing the firm’s output to the market. Here again, the
2 In many of these countries, export-oriented sectors drive growth, bring in foreign exchanges and are potential large
importance of the indirect channel for a given firm hinges on the energy intensity of its intermediate production inputs.
In discussing the impact of fuel subsidy reforms on firms, Rentschler et al. (2017) underscore that the net impact on competitiveness depends on how firms respond to the price shocks. The authors emphasize four main response measures which includes absorption, substitution, resource efficiency and pass-on. First, the absorption occurs when margins are high and firms can afford a temporary reduction in profit to absorb the additional production cost from fuel price increases. Second, firms can also substitute other sources of energy to fuels, but this may require a change in production technology and be conditioned upon a reliable access to those alternative energy sources. As in the case of the 2015 fossil fuel subsidy reform in Kenya, improving access to alternative energy sources, through large scale investments in rural electrification, has been explicitly part of the mitigating measures the authorities put in place (IMF, 2013a and 2013b). Third, firms can also increase their energy efficiency by reducing overall energy consumption while maintaining pre-subsidy removal production levels (Rentschler et al., 2017), but this would require updating the production process or technology. Finally, firms can also pass-on the price shock stemming from the reform to end-users depending on the price elasticity of demand.
The export sector in developing countries typically has a limited room to pass though the cost increase to foreign consumers either because they are price takers or competing firms on the world market are not subject to the same price shock. Further, since substitution and resource efficiency are more structural in nature and require time and investment (Rentschler et al., 2017), the only option left in the short-term is absorption. This suggests that the export sector would be quite vulnerable to energy price shocks, in particular when it is dominated by small and medium enterprises (SMEs) with little margin buffers to cope with shocks which could possibly lead to bankruptcy or exit from the market.3
Another channel of transmission relates to the credibility of monetary policy and its ability to shape inflation expectations. Higher energy prices would lead to an increase in consumer prices, reflecting the direct and indirect effects discussed above. However, if inflation expectations are not well-anchored and indexation mechanisms are prevalent, higher energy prices can trigger a second-round impact on wages as workers will ask for higher wages to offset increased living costs, thus pushing production costs further up, with adverse consequences on firms’ competitiveness. `
Fiscal policy can also play an important role in mitigating the adverse impact of fuel price increases on competitiveness. It is well established that deficient public infrastructure and weak human capital undermine economy-wide competitiveness. To the extent that an increase in domestic fuel prices leads to a reduction in fuel subsidies, this can potentially free up fiscal space for
growth-3 Rather than absorbing the cost increase through lower margins, firms may opt for cutting back investments which would
enhancing public spending, that could partially offset the negative impact of fuel price increases on firms’ competitiveness, albeit with a lag as investment in physical and human capital takes time to bear fruits. On the other hand, if the additional fiscal space is used for expanding current expenditure, this could fuel inflationary pressures and turned out to be detrimental for competitiveness.
Finally, an increase in fuel prices may be beneficial for medium and long run competitiveness through improved economic efficiency in situations where fuel prices are initially below their cost-recovery levels. Indeed, higher fuel prices would shift resources away from less productive and energy-intensive activities, as well as reduce distortions in price signals. The improved allocation of factors will enhance total factor productivity, and ultimately competitiveness (Saunders and Schneider, 2000; Ellis, 2010; Whitley and van der Burg, 2015). In addition, energy price increases may spur technological change and provide incentives to invest in more energy efficient technology. However, the ability of firms to improve their energy efficiency hinge on the availability and affordability of modern technology, the availability of financing and support in implementing efficiency measures (Rentschler and Bazilian, 2017, Rentschler et al, 2017).
A review of the empirical literature
Our paper is related to the growing literature on energy prices and competitiveness which has gained interest with the heightened debate on climate change issues. Studies, however, focus largely on developed countries, mainly in Europe, in light of the long-standing issue of high energy prices relatively to the US.4 The few papers that focus on developing countries typically examine
energy prices in the context of subsidy reforms triggered by concerns about fiscal sustainability of
4 Gonseth et al. (2015) looks at the effect of diesel tax changes on competitiveness using a panel data of 11 manufacturing
sector across six European countries over 1990-2003, and find that the marginal effect of an increase in fuel taxes (hence an increase in the after-tax consumer price) lower total factor productivity and net trade of (measured by the logarithm of the ratio of exports to imports) of affected firms. This is consistent with the findings of Chan et al. (2017) who show a detrimental effect of energy price increases on EU exports. Similarly, Aldy and Pizer (2015) find that energy-intensive US manufacturing industries are more likely to experience loss of competitiveness (measured as net imports) following an increase in energy prices, although by a small magnitude. Nevertheless, Gonseth et al. (2015) stress that industries with high adaptive capacity (measured by their relative level of labor compensation) are able to mitigate (or more than offset in some cases) the adverse effects of energy tax rises, therefore underscoring the importance of the role of human capital in adaptation to higher energy costs and climate policy. On the other end of the spectrum, Costantini and Mazzanti (2012) use export data for manufacturing sectors in Europe during the period 1996-2007 and a gravity model to show that energy taxes are either neutral or even positively associated with exports, with energy taxes acting as levers of higher competitiveness through the activation of potential efficiency improvements at production level. Rammera et al. (2017) reach similar conclusion when they assess the impact of energy policies, including energy taxation, on export performance of firms in Germany, Switzerland, and Austria, and find no effect on international competitiveness (see also Arlinghaus, 2015). Further, Sato and Dechezleprêtre (2015) use industry level data to measure the response of bilateral trade flows to differences in industrial energy prices across a sample of 62 manufacturing sectors in 42 developed and emerging countries over the period 1996-2011. They find that energy prices explain only a marginal part (0.01%) of the variation in trade flows. For instance, a 30 percent increase in energy prices across Europe would lead to only up to a 0.5 percent decline in exports, suggesting that competitiveness would remain relatively unaffected.
energy subsidies and their distributional implications.5 Coverage of energy products varies among
studies (fuel, electricity, coal, and gas), so are the measures of competitiveness which include output level, profit margins, exports and total factor productivity.
Overall, the findings of the literature are mixed as some studies finds a negative impact of energy price increases on competitiveness, whereas other studies find no effect or a small positive one depending on the ability of firms to adapt to the new normal of higher energy prices. Nevertheless, studies consistently find any adverse impact of higher energy price on competitiveness is only pronounced in the short-term and tend to phase out or reverse to a positive impact in the long run.
Studies on developing countries that find a negative impact of energy price increases on competitiveness include for instance O‘Ryan et al. (2003) who investigate the economic and environmental effects of removing fuel subsidies in Chile using a Static CGE model. The simulation of a 12 percent increase in fuel prices to bring domestic prices to import-parity prices (assuming there were no price stabilization fund) would lead in the short-run to an output loss of 0.3 percent, and a decline in exports by 0.8 percent. But the distributional impact is progressive, while there will be clear environmental benefits from this policy.
In a recent paper, Rentschler and Kornejew (2017) exploit variations in energy prices (electricity and fuels) for Indonesian firms to assess their impact on profit margins, a proxy of competitiveness. The results suggest that energy prices have a small and statistically significant adverse long-run effect on competitiveness, with the marginal impact of diesel and LPG price increases being larger than for electricity and kerosene. The marginal impact also varies across industry, whereas firms’ ability to adapt to higher energy prices, through energy substitution, increased energy efficiency or higher prices for consumers, mitigates the adverse effect of higher energy prices, without eliminating it, however. Similarly, using a CGE model calibrated for Indonesia, Clement et al. (2007) find that a reduction in fuel subsidies will result in a small contraction in output, reflecting higher production cost and falling incomes. However, the reduction in the fiscal deficit will boost private investment, which will ultimately offset the initial decline in output.
Also, Jiang and Tan (2013) find using input-output tables and simulations, that subsidy reforms in China would have significant effects on price levels especially on the producer price index. In the same vain, Lin and Li (2012), using a simulation approach and a multi-world-region general equilibrium model, find that subsidy removal in China would result in a loss of competitiveness through the trade channel. The authors advocate for export subsidy and capital tax reduction to dampen the negative effect on competitiveness. For Malaysia, Solaymani and Kari (2012) also find that the elimination of fuel subsidies will result in a contraction of manufacturing output and
5 From the perspective of this paper, the motivations behind the increase in fuel prices do not matter, rather how it affects
exports. Nevertheless, total output and investment will rise as the subsidy removal provides a boost to oil production, which more than offset the output decline in the non-oil sector.
On the other hand, Hope and Singh (1995) study the effects of fuel subsidy reforms in the 1980s in six countries (Malaysia, Indonesia, Ghana, Zimbabwe, Columbia and Turkey). They highlight that the impact of energy price increase at the industrial level depends on the energy intensity, the ability to substitute energy by other inputs and the ability to pass-on the increase in the energy cost to consumers. They find at the industrial level that output grew at a higher rate during and following the price increase in some countries while in other countries there was a slow growth followed by a recovery. The output growth rates in the manufacturing was higher than its pre-reform level (except in Turkey where there was no significant difference between pre-and post-reform periods). Finally, they find that energy price increases by reducing distortions in prices of other inputs, have contributed to economic growth in these countries.6 For Hang and Tu (2007), the deregulation of
energy prices in China between 1985 and 2004 has led to lower energy intensity and thus higher energy efficiency, with potential favorable implications for medium and long-run competitiveness.
While the existing literature has contributed to better understand the interplay between energy prices and competitiveness, evidence from developing countries is still sparse. Yet, fuel price control is more pervasive in these countries, and shedding light on the link between energy prices and competitiveness could contribute to ease one of the main bottlenecks to fuel price reforms. Moreover, the existing studies on developing countries are country-specific, which is a limiting factor when it comes to draw broad policy conclusions that are relevant to a large group of countries. Since these studies rely on firm-level data, they are unable to control for macroeconomic variables that also matter for competitiveness. In addition, although policy makers would likely find valuable insights on how energy price increases affect various industries, they would also be interested in the external competitiveness of the economy as a whole. The reason being that if some industries are negatively impacted, but economy-wide, there is a gain from allowing energy price to increase, then there is a rationale to implement the reform while devising appropriate mitigating measures to get the buy-in of the potential losers. This paper attempts to complement the existing studies by addressing these gaps in the literature using a large panel dataset.
3. Empirical strategy and results
3.1. Data and model specification
To investigate empirically linkages between fuel price changes and external competitiveness, we compile annual data for a panel of 77 developing countries during 2000-2014. The size of the sample
6 However, as these reforms took place during the structural adjustment period, the authors point to the potential role of
and period of study have been guided by data availability. The baseline model explains export growth by the change in fuel prices, controlling for a set of variables that are traditionally thought to matter for country’s competitiveness. The specification of the model is as follows:
∆ln , ∑ ∆ln , , , (1)
where is the logarithm of real non-fuel export of country c in year t; denotes the logarithm of domestic fuel prices, the variable of interest, and X is the set of control variables including the change in international fuel prices, the real effective exchange rate, an index of product diversification, the ratio of foreign direct investment to GDP, the inflation rate, and an indicator of external demand measured by the average economic growth in the rest of the World; is a country-specific fixed effect intended to control for time-invariant unobserved heterogeneities such as structural differences in export potential or institutions; and , is the residual term. All explanatory variables, except external demand, are lagged to minimize bias due to potential feedback effects.7 Further, since the pass-through of fuel prices throughout the supply
chain can take time, up to three lags of the change in domestic fuel prices are included in the model.
Below, we discuss the variables of the model, their measurement and data sources, as well as the expected sign.8
Export growth
As underlined above, the main interest is on external competitiveness which is measured by export growth. This indicator has the advantage of being simple, meaningful and more palatable to policy makers, firms and the civil society.9 An added advantage is that export data are widely available for
many developing countries over a long period. 10 For obvious reasons,11 we follow a recent literature
(e.g. Freund and Pierola, 2012, Eichengreen and Gupta, 2013) and use the non-fuel real export
7 We also run unit root tests (Phillips-Perron and Dickey-Fuller tests) and failed to reject the stationarity of all the variables
included in the model (the results are not shown to save space).
8 Appendix Table 1 presents a summary of the variables and their sources.
9 The shortcoming, however, is that export growth is a weak indicator of competitiveness given that it does not necessarily
imply a gain in market share.
10 Multidimensional indicators of competitiveness (also called structural competitiveness) exist. Examples include the
Global Competitiveness Index (GCI) of the World Economic Forum and the World Competitiveness Yearbook (WCY) from the International Institute for Management Development. However, these indicators are either not available for many developing countries or cover a short time span. More importantly, these indexes by their multidimensional nature, incorporate survey-based qualitative aspects of competitiveness, and therefore they do not seem to be appropriate for our empirical analysis.
11 The notion of competitiveness typically refers to non-oil sectors, and by excluding oil exports, data for oil producers are
more comparable to other countries. Also, oil exports are often volatile driven by factors most likely not related to competitiveness (e.g. new discoveries).
growth (obtained as the first difference in the logarithm of real non-fuel exports using data from the World Development Indicators—WDI).
Fuel prices
Domestic fuel prices are the prevailing retail prices per liter of gasoline and diesel converted in US dollars to ensure comparability across the sample. Should a rise in fuel prices be detrimental to competitiveness, the coefficient on fuel price change will be negative and significant. On the other hand, a non-significant coefficient (or a positive one) will lend support to the idea that energy prices are not harmful to competitiveness (or enhance it). Data on fuel prices originate from a comprehensive monthly retail fuel price database (Kpodar and Abdallah, 2017). We then average the data to obtain yearly average fuel price, providing a more accurate picture of fuel price dynamics as opposed to using end-of-year prices.
Control variables
The model controls for the real effective exchange rate (REER) as an appreciation makes a country’s export relatively more expensive than that of its competitors, and as a result, it is expected to be negatively correlated with export growth. The data on real effective exchange rate are taken from the World Economic Outlook (WEO). Further, as diversified countries are more likely to tap into the opportunities offered by international trade, the model incorporates a product diversity index (compiled by the United Nation Conference on Trade and Development—UNCTAD) which is expected to be positively correlated with export growth. Similarly, countries that attract more foreign direct investments (FDI) are likely to expand their export base, and for this reason, we include the net FDI ratio to GDP in the model. The data are provided by the WDI. Including the changes in international fuel (refined gasoline or diesel) prices12 in the model would allow to test
whether shocks associated with movements in international prices affect export growth beyond their impact through domestic fuel prices. While the model already controls for the REER, and hence indirectly for inflation, adding the CPI inflation rate to the model (using data from the WDI) would isolate the impact of domestic price shocks from the change in the REER. It will also enable to test one of the channel of transmission from fuel prices to exports. Indeed, an increase in fuel prices could lead to inflation if domestically-oriented firms pass on the increase in their production cost to domestic consumers. Finally, to account for external demand cycles, a key driver of a country’s export growth, we include in the model for each country, the average real GDP growth rate of the rest of the world.
3.2. Some stylized facts
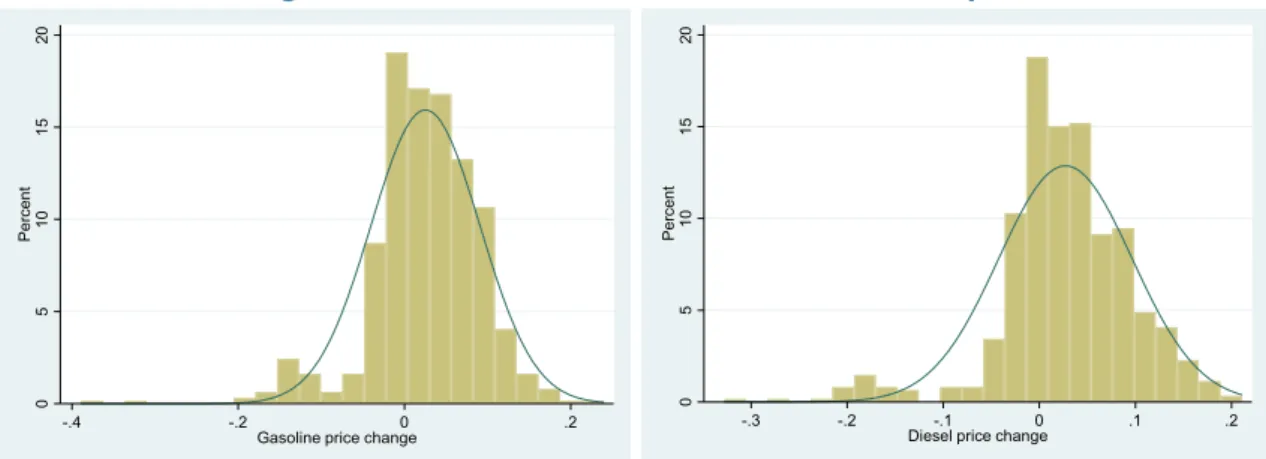
Figure 1 shows that the distribution of fuel price changes in the sample for both gasoline and diesel follows the same pattern. The right-skewed distribution indicates that positive price changes are more frequent. However, about 18 percent of the sample observations are zero, revealing the prevalence of fuel price controls in developing countries. With regard to episodes of fuel price declines, they are scanter and coincide in most cases with the slump in international oil prices in the second half of 2008.13
Turning to the correlation between fuel price changes and export growth, we observe in Figure 2 a negative slope, suggesting that fuel price hikes may be a source of a competitiveness loss. In Figure 3, the sample is split in two sub-samples dependency on the country’s energy dependency. As discussed in the literature section, the exposure of a country’s competitiveness to fuel price shocks may hinge on the degree of energy dependency of the economy. Measuring energy dependency by the energy use (kilogram of oil equivalent) per capita,14 Figure 3 shows that negative correlation
observed in the overall sample dies out in the sub-sample of countries with energy dependency below the sample average, whereas the negative correlation persists in the sub-sample of countries with energy dependency above the sample average. This picture is consistent for both gasoline and diesel.
Figure 1. The distribution of Fuel Prices in the Sample
Source: Kpodar and Abdallah (2017)
13 Appendix Table 2 provides the summary statistics on the dependent and explanatory variables. 14 We did not employ energy use as share of GDP because of the obvious endogeneity issue.
0 5 10 15 20 Pe rc en t -.4 -.2 0 .2
Gasoline price change
0 5 10 15 20 Perc ent -.3 -.2 -.1 0 .1 .2
Figure 2. Movements in Fuel Prices and Real Non-Fuel Export Growth
Sources: Kpodar and Abdallah (2017), World Development Indicators, and authors’ calculations.
3.3. The effect of domestic fuel price changes on external competitiveness: fixed-effect estimations
Table 1 present the results with gasoline prices. The coefficient on the first lag of the changes in gasoline prices is negative and significant, suggesting that higher gasoline prices contribute to a slowdown in exports. The marginal impact is not as small as thought. For instance, taking the specification in column 3, a one percentage point change in gasoline price would reduce export growth by a 0.6 percentage point. Interestingly, the longer the lag, the smaller and less significant is the coefficient, implying that the negative impact phases out over time. In column 8, the lagged level of exports is included in the baseline model to account for initial conditions as exports may increase faster from an initial low base, even if competitiveness does not improve that much. This dynamic specification does not alter the main findings. Similarly, the results remain broadly unchanged when re-estimating the dynamic specification with the System GMM estimator to control (column 9) for the presence of the lagged dependent variables and properly deal with the potential endogeneity of the explanatory variables. Further, using changes in diesel prices confirms the results with gasoline prices (Table 2).
-2 -1 0 1 2 Rea l non -f ue l ex po rt grow th -.6 -.4 -.2 0 .2 .4 .6
Gasoline price change
-2 -1 0 1 2 Rea l non -f ue l ex po rt grow th -.6 -.4 -.2 0 .2 .4 .6
Figure 3. Energy Dependency and Correlation Between Fuel Price Changes and Real Non-Fuel Export Growth
Sources: Kpodar and Abdallah (2017), World Development Indicators, and authors’ calculations.
Looking at the control variables, the results are in line with expectations (Table 1 and 2). REER appreciation inhibits export growth, with the coefficient being negative and significant in most regressions. On the other hand, product diversification and favorable external demand are found to be supportive of export growth. Surprisingly, FDI does not seem to be strongly associated with better export performance. It also emerges that high inflation hampers export growth (column 4 in Table 1 and 2). As a result, fuel price increases, if accompanied by inflationary pressures, can worsen export outcomes. The coefficient on the REER remains negative and significant, probably picking up the adverse impact of nominal exchange rate appreciation on exports.15
15 This is because for most developing countries, average inflation of their trading partners (mostly advanced economies)
tend to be relatively stable. Thus, the main sources of variation in REER are domestic inflation and exchange rate.
-2 -1 0 1 2 R eal no n-f uel ex p ort grow th -.6 -.4 -.2 0 .2 .4 .6
Gasoline price change Below average energy dependency
-2 -1 0 1 2 R eal no n-f uel ex p ort grow th -.6 -.4 -.2 0 .2 .4 .6
Gasoline price change Above average energy dependency
-2 -1 0 1 2 R eal no n-f uel ex p ort grow th -.6 -.4 -.2 0 .2 .4 .6
Diesel price change
Below average energy dependency
-2 -1 0 1 2 R eal no n-f uel ex p ort grow th -.6 -.4 -.2 0 .2 .4 .6
Diesel price change
Table 1. Real Export Growth and Fuel Price changes: Baseline with Gasoline Price
FE FE FE FE FE FE FE FE Sys-GMM
(1) (2) (3) (4) (5) (6) (7) (8) (9)
Change in gasoline pump price (t-1) -0.623 -0.616 -0.624 -0.523 -0.612 -0.475 -0.636 -0.537
[0.179]*** [0.183]*** [0.192]*** [0.183]*** [0.374] [0.178]*** [0.167]*** [0.172]***
Change in gasoline pump price (t-2) -0.372 -0.333 -0.341 -0.265 -0.343 -0.323 -0.501 -0.563
[0.125]*** [0.126]** [0.137]** [0.136]* [0.127]*** [0.118]*** [0.117]*** [0.144]***
Change in gasoline pump price (t-3) -0.005 0.019 0.019 0.031 0.016 0.128 -0.116 0.012
[0.109] [0.111] [0.112] [0.112] [0.100] [0.100] [0.109] [0.111]
Log REER (t-1) -0.242 -0.257 -0.236 -0.360 -0.239 -0.307 -0.056 0.151 0.142
[0.101]** [0.104]** [0.094]** [0.089]*** [0.099]** [0.090]*** [0.096] [0.104] [0.214]
Log Diversification index (t-1) 1.689 1.667 1.502 1.673 1.958 0.941 -0.122 -0.923
[0.662]** [0.659]** [0.640]** [0.636]** [0.636]*** [0.612] [0.491] [0.869] Log FDI (t-1) 0.002 0.001 0.002 0.001 0.003 0.004 0.003 [0.003] [0.003] [0.003] [0.003] [0.003] [0.002]* [0.003] Inflation (t-1) -1.132 -0.357 0.291 [0.195]*** [0.183]* [0.418] World growth 0.044 0.016 0.045 [0.004]*** [0.008]* [0.006]*** Change in international gasoline price
(t-1)
-0.006 -0.136
[0.106] [0.033]***
Log non-oil real exports (t-1) -0.304 -0.092
[0.075]*** [0.066]*** Constant 1.215 0.401 0.309 6.244 0.317 0.468 -0.332 8.005 0.485 [0.466]** [0.410] [0.410] [1.021]*** [0.451] [0.386] [0.395] [1.989]*** [2.287] Number of observations 485 485 485 485 485 485 485 485 485 Number of countries 76 76 76 76 76 76 76 76 76 R-squared 0.07 0.09 0.09 0.13 0.09 0.06 0.20 0.36
Hansen test p-values 0.83
AR(2) test (p-values) 0.31
Notes: The dependent variable is the non-fuel real export growth. All estimates include country-fixed effects. FE stands for fixed-effect estimator and Sys-GMM denotes System GMM estimator. Clustered standard errors at country level in parentheses. * p < 0.10, ** p < 0.05, *** p < 0.01.
Table 2. Real Export Growth and Fuel Price changes: Baseline with Diesel Price
FE FE FE FE FE FE FE FE Sys-GMM
(1) (2) (3) (4) (5) (6) (7) (8) (9)
Change in diesel pump price (t-1) -0.558 -0.553 -0.563 -0.440 -0.320 -0.364 -0.544 -0.576
[0.126]*** [0.132]*** [0.141]*** [0.146]*** [0.228] [0.127]*** [0.114]*** [0.144]***
Change in diesel pump price (t-2) -0.343 -0.308 -0.313 -0.255 -0.373 -0.277 -0.440 -0.482
[0.160]** [0.159]* [0.168]* [0.157] [0.156]** [0.149]* [0.139]*** [0.150]***
Change in diesel pump price (t-3) 0.082 0.106 0.108 0.121 0.066 0.207 -0.015 0.108
[0.085] [0.088] [0.087] [0.085] [0.087] [0.075]*** [0.073] [0.085]
Log REER (t-1) -0.318 -0.338 -0.319 -0.409 -0.356 -0.373 -0.136 0.125 0.039
[0.088]*** [0.088]*** [0.080]*** [0.086]*** [0.080]*** [0.084]*** [0.086] [0.101] [0.178]
Log Diversification index (t-1) 1.784 1.766 1.477 1.850 2.002 1.040 -0.059 -0.284
[0.646]*** [0.645]*** [0.629]** [0.635]*** [0.633]*** [0.600]* [0.506] [0.674] Log FDI (t-1) 0.002 0.001 0.001 0.001 0.003 0.004 0.003 [0.003] [0.003] [0.003] [0.003] [0.003] [0.002]* [0.003] Inflation (t-1) -1.051 -0.322 0.764 [0.296]*** [0.280] [0.489] World growth 0.043 0.016 0.046 [0.004]*** [0.008]** [0.006]***
Change in international diesel price (t-1) -0.097 -0.130
[0.052]* [0.026]***
Log non-oil real exports (t-1) -0.291 -0.064
[0.072]*** [0.051]*** Constant 1.559 0.710 0.626 6.093 0.761 0.746 -0.022 7.611 -2.245 [0.406]*** [0.355]** [0.355]* [1.463]*** [0.369]** [0.361]** [0.362] [2.445]*** [2.607] Number of observations 486 486 486 486 486 486 486 486 486 Number of countries 77 77 77 77 77 77 77 77 77 R-squared 0.08 0.10 0.10 0.13 0.11 0.08 0.20 0.34
Hansen test p-values 0.83
AR(2) test (p-values) 0.37
Notes: The dependent variable is the non-fuel real export growth. All estimates include country-fixed effects. FE stands for fixed-effect estimator and Sys-GMM denotes System GMM estimator. Clustered standard errors at country level in parentheses. * p < 0.10, ** p < 0.05, *** p < 0.01.
The coefficients on international gasoline and diesel prices are negative but only statistically significant for diesel prices (column 5 in Table 1 and 2). However, dropping domestic fuel prices from the model increases the size and significance of the coefficient on international fuel prices (column 6 in Table 1 and 2), which is expected as changes in international oil price mainly affect the domestic economy through pump prices.16
One could argue that for fuel exporting countries, higher international oil prices can generate a windfall gain for public finances leading to an increase in public spending, for instance to support the export sector as domestic fuel prices are being adjusted. If this is the case, the elasticity of non-fuel export to domestic non-fuel prices derived from Table 1 and 2 would be biased downward. To ensure that the results are not significantly affected, the regressions are re-run, while controlling for the ratio of net oil export to GDP. The results reported in Appendix Table 3 and Appendix Table 4 are comparable to that of Table 1 and 2, and suggest that oil exports crowd out non-oil exports, consistent with the Dutch disease theory.
We turned now to investigate whether large domestic fuel price increases are more detrimental to competitiveness than small price increases. Addressing this question is relevant considering the debate in the literature on fuel subsidy reform opposing gradualism to shock therapy (Clements et al., 2013; Verme, 2016).17 If multiple small price increases that add up to the same magnitude of a
single price increase have a smaller effect on export growth, it means that gradualism is superior to shock therapy as far as the impact of fuel price shock on export growth is concerned. This is also related to the standard argument that producers may adjust more easily to small shocks, with no major consequences for competitiveness loss. We test this non-linearity by introducing in the baseline model: (i) the square term of the change in fuel prices or (ii) an interaction between a dummy for large shocks and the change in fuel prices (large price shocks are defined as fuel price changes that deviate from the country-specific average by one standard deviation). The results presented in Table 3 for both gasoline and diesel do not provide evidence of a nonlinear effect as
16 How a shock in international oil prices would affect a country’s exports is not straightforward as this depends on several
factors, including the external demand, the response of competitor countries and the country’s own fuel price policy. An increase in international oil prices that translates into a weakening of global demand would adversely affect exports for all countries. But, assuming that global demand does not change, and both the country and its competitors fully adjust their domestic prices, relative production costs would not change and hence an increase in international oil prices would not affect exports. If a country decides to subsidize fuel prices, relative production costs will shift in favor of domestic producers enabling them to export more. But this may not materialize because: (i) someone has to bear the cost of the subsidies, typically the government thus diverting resources away from more productive public spending (the model in this paper has a narrow focus on exports, and hence it is not designed to capture the general equilibrium effects of higher subsidies); (ii) firms in competitor countries might adapt quicker to the new prices, allowing them to maintain their market shares.
17 Proponents of gradualism argue that it allows enough time for consensus building thus minimizing the resistance of
opposition groups; helps households and firms to adjust smoothly; and facilitates adjustment when macroeconomic conditions are not favorable or social safety nets are not well targeted to effectively protect the poor. On the other hand, the advocates of shock therapy underscore that gradualism can reduces the budgetary savings of a reform and increase the risk of stalled reform momentum due to reform fatigue, buildup of opposition to reform and narrow political window of reform.
the marginal impact does not depend on the size of the shock. Consequently, the results do not lend support to either the gradualism or the shock therapy approach.
Table 3. Real Export Growth and Fuel Price Changes: Testing for Non-Linearity
FE FE FE FE
(1) (2) (3) (4)
Change in gasoline pump price (t-1) -0.438 -0.372 [0.206]** [0.113]*** Change in gasoline pump price (t-2) -0.325 -0.321
[0.120]*** [0.122]** Change in gasoline pump price (t-3) 0.123 0.134
[0.142] [0.113] Change in gasoline pump price squared (t-1) -0.547
[1.871] Change in gasoline pump price (t-1)*Large shock dummy
-0.313 [0.608]
Change in diesel pump price (t-1) -0.317 -0.436
[0.128]** [0.178]**
Change in diesel pump price (t-2) -0.319 -0.329
[0.163]* [0.178]*
Change in diesel pump price (t-3) 0.216 0.195
[0.078]*** [0.078]**
Change in diesel pump price squared (t-1) 1.223
[0.766] Change in diesel pump price (t-1)*Large shock
dummy
0.468 [0.350]
Log REER (t-1) -0.050 -0.062 -0.133 -0.099
[0.094] [0.097] [0.091] [0.102]
Log Diversification index (t-1) 0.904 0.860 1.012 1.009
[0.599] [0.599] [0.595]* [0.595]* Log FDI (t-1) 0.003 0.003 0.003 0.003 [0.002] [0.003] [0.003] [0.003] World growth 0.044 0.044 0.045 0.046 [0.005]*** [0.004]*** [0.004]*** [0.004]*** Constant -0.336 -0.263 -0.038 -0.191 [0.390] [0.404] [0.395] [0.460] Number of observations 482 482 483 483 Number of countries 76 76 77 77 R-squared 0.19 0.19 0.20 0.20
Notes: The dependent variable is the non-fuel real export growth. All estimates include country-fixed effects. FE stands for fixed-effect estimator and Sys-GMM denotes System GMM estimator. In column 2 and 4, large fuel price shocks are those that deviate from the country specific average by one standard deviation. Clustered standard errors at country level in parentheses. * p < 0.10, ** p < 0.05, *** p < 0.01.
3.4. Testing for conditioning factors: energy dependency and access to alternative source of energy
This section investigates the role of conditioning factors by assessing how energy dependency and access to alternative source of energy shape the relationship between fuel price increase and export growth. As discussed in the previous sections, higher energy dependency would magnify the negative impact of fuel price increases on export growth as production cost would rise more with higher fuel content. On the other hand, access to other sources of energy would allow firms to alter energy consumption mix, thus substituting away from more expensive fuels.
In this paper, we consider access to electricity. The literature provides ample evidence of inter-fuel substitution at the macro-level as well as sectoral level (see Rentschler and Kornejew, 2017; Steinbuks and Narayanan, 2015; Serletis et al., 2019 and 2011; Wesseh and Lin, 2018). For electricity and fuel, studies typically find cross price elasticities to be positive, although not large but increasing over time. In many developing countries, a lack of access to the electricity grid or frequent power outage forces firms to rely on expensive fuel-powered generators to produce their own electricity and minimize production disruptions. More generally, those firms are also likely to invest in fuel-using capital stock. Better access to electricity will ease this constraint and allows firms to change their energy mix in response to changes in relative energy prices.18
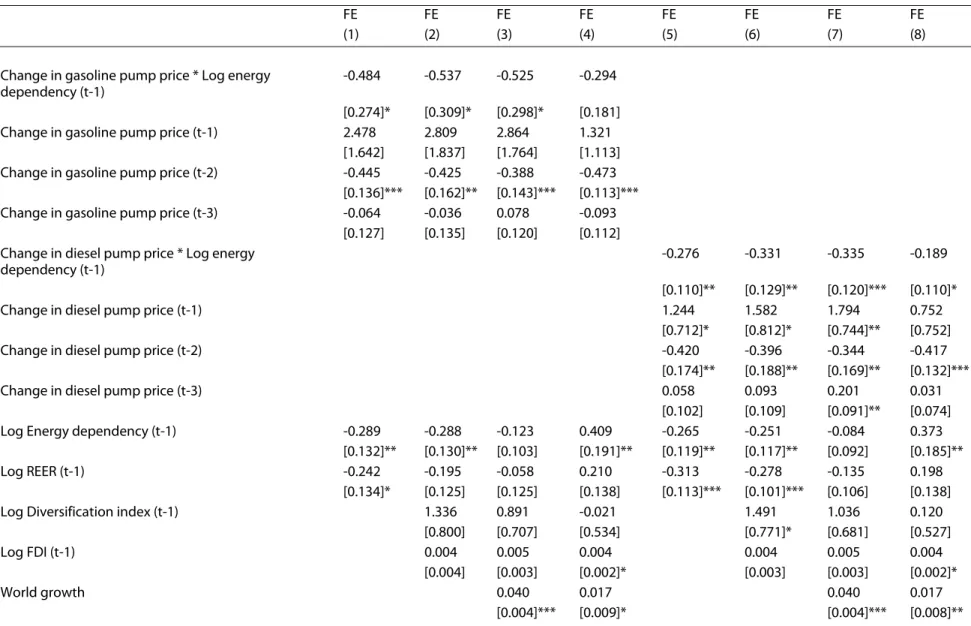
Table 4 shows the results of the model with energy dependency ratio (measured by the energy use in kilogram of oil equivalent divided by total population) as a standalone variable but also as an interaction with fuel price changes. The coefficient on the interaction term is negative and significant in most specifications—and for both gasoline and diesel—, confirming that for countries where energy dependency is high (and potentially so are energy inefficiencies), export growth suffers more from a given increase in fuel prices. Figure 4 is quite illustrative in that regard, as for a low energy dependency ratio, fuel price increases appear not to have a statistically significant impact on export growth. But, as energy dependency increases, the marginal impact becomes larger and significant. This also suggests that the detrimental impact of an increase in fuel prices on export growth could be partially offset when higher fuel prices promote energy efficiency through adoption of energy saving technologies.
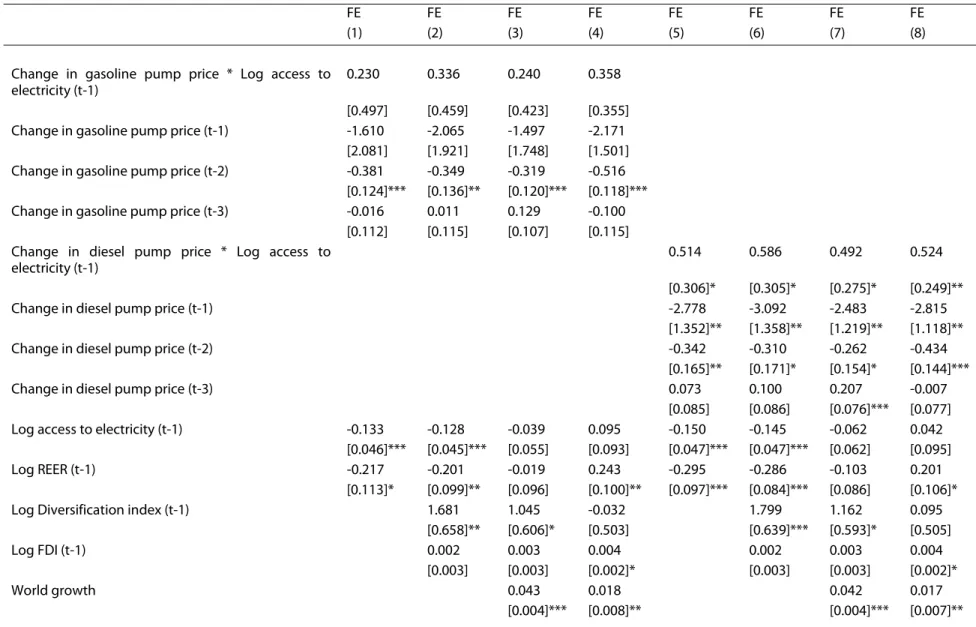
We proceed analogously for access to electricity using as a proxy the percentage of urban population with access to electricity. The results in table 5 show a positive coefficient on the interaction term between access to electricity and fuel price changes, although it is only significant
18 To the extent that electricity is produced from fuel, an increase in fuel prices would also lead to an increase in electricity
prices. But, the impact on firms’ production cost would be much less because electricity is typically generated from a mix of primary energy sources such as fuel, coal, hydropower, and natural gas among the major ones. Moreover, the unit cost of a kilowatt hour of the grid’s electricity is much lower than that of self-generation due to economies of scale.
for diesel. Figure 5 illustrates the distribution of the marginal impact according the level of access to electricity and shows that countries with high access to electricity tend to suffer less from competitiveness loss following fuel price increases. 19
3.5. Disentangling short-term from long-term effects: the local projection approach
The previous fixed-effect estimations help establish that fuel price increases are negatively associated with export growth, but to gauge the persistence of the impact, more refined econometric approaches exist. The question of the persistence of the impact has policy relevance as assessing whether the impact is temporary or permanent provides critical information on the design of mitigating measures or compensatory policies.
We adopted the local projection approach developed by Jorda (2005) to tackle this question. The methodology has the advantage of being robust to misspecification because the impulse responses can be defined without knowing the data generating process and even when its Wold decomposition does not exist (see for instance Koop et al., 1996; Potter, 2000 and Jordá, 2005). The approach is also relatively straightforward to implement as they can be estimated using simple OLS. Many recent studies have used the local projection approach to estimate impulse responses (e.g. Auerback and Gorodnichenko, 2013; Owyang, Ramey and Zubairy, 2013; Jordá and Taylor, 2016; Kpodar and Abdallah, 2017). To reduce potential bias, we implement the correction suggested by Teulings and Zubanov (2014) to control for innovations in the regressors between periods t and t+h when estimating the impulse response at horizon h. The model specification is as follows:
, , ∑ ∆ln , ∆ ln , X , Eq(2)
Where the dependent variable , , is the change in the logarithm of non-oil real exports at horizon h and are the coefficients of interest for each horizon h=0, 1, 2, 3. The definition of the other variables and parameters are the same as in equation 1 above. This specification is similar to the one in column 7 of table 1 and 2, considered as the baseline. The idea is to capture the impact of an increase in domestic fuel prices on export regardless of the sources of the price shocks, whether it is idiosyncratic or driven by changes in international oil prices.
19 We also undertake regressions where we control for the share of nonrenewable electricity production and the results
Table 4. Conditioning Factor: Energy Dependency
FE FE FE FE FE FE FE FE
(1) (2) (3) (4) (5) (6) (7) (8)
Change in gasoline pump price * Log energy dependency (t-1)
-0.484 -0.537 -0.525 -0.294
[0.274]* [0.309]* [0.298]* [0.181]
Change in gasoline pump price (t-1) 2.478 2.809 2.864 1.321
[1.642] [1.837] [1.764] [1.113]
Change in gasoline pump price (t-2) -0.445 -0.425 -0.388 -0.473
[0.136]*** [0.162]** [0.143]*** [0.113]***
Change in gasoline pump price (t-3) -0.064 -0.036 0.078 -0.093
[0.127] [0.135] [0.120] [0.112]
Change in diesel pump price * Log energy dependency (t-1)
-0.276 -0.331 -0.335 -0.189
[0.110]** [0.129]** [0.120]*** [0.110]*
Change in diesel pump price (t-1) 1.244 1.582 1.794 0.752
[0.712]* [0.812]* [0.744]** [0.752]
Change in diesel pump price (t-2) -0.420 -0.396 -0.344 -0.417
[0.174]** [0.188]** [0.169]** [0.132]***
Change in diesel pump price (t-3) 0.058 0.093 0.201 0.031
[0.102] [0.109] [0.091]** [0.074]
Log Energy dependency (t-1) -0.289 -0.288 -0.123 0.409 -0.265 -0.251 -0.084 0.373
[0.132]** [0.130]** [0.103] [0.191]** [0.119]** [0.117]** [0.092] [0.185]**
Log REER (t-1) -0.242 -0.195 -0.058 0.210 -0.313 -0.278 -0.135 0.198
[0.134]* [0.125] [0.125] [0.138] [0.113]*** [0.101]*** [0.106] [0.138]
Log Diversification index (t-1) 1.336 0.891 -0.021 1.491 1.036 0.120
[0.800] [0.707] [0.534] [0.771]* [0.681] [0.527]
Log FDI (t-1) 0.004 0.005 0.004 0.004 0.005 0.004
[0.004] [0.003] [0.002]* [0.003] [0.003] [0.002]*
World growth 0.040 0.017 0.040 0.017
Log non-oil real exports (t-1) -0.387 -0.361 [0.099]*** [0.100]*** Constant 3.122 2.195 0.530 5.363 3.275 2.237 0.542 4.955 [0.591]*** [0.911]** [0.746] [1.432]*** [0.569]*** [0.864]** [0.701] [1.381]*** Number of observations 404 404 404 404 407 407 407 407 Number of countries 61 61 61 61 61 61 61 61 R-squared 0.10 0.12 0.21 0.38 0.10 0.12 0.21 0.36
Notes: The dependent variable is the non-fuel real export growth. All estimates include country-fixed effects. Energy dependency is measured as the energy use per capita. Clustered standard errors at country level in parentheses. * p < 0.10, ** p < 0.05, *** p < 0.01.
Table 5. Conditioning Factor: Access to Electricity
FE FE FE FE FE FE FE FE
(1) (2) (3) (4) (5) (6) (7) (8)
Change in gasoline pump price * Log access to electricity (t-1)
0.230 0.336 0.240 0.358
[0.497] [0.459] [0.423] [0.355]
Change in gasoline pump price (t-1) -1.610 -2.065 -1.497 -2.171
[2.081] [1.921] [1.748] [1.501]
Change in gasoline pump price (t-2) -0.381 -0.349 -0.319 -0.516
[0.124]*** [0.136]** [0.120]*** [0.118]***
Change in gasoline pump price (t-3) -0.016 0.011 0.129 -0.100
[0.112] [0.115] [0.107] [0.115] Change in diesel pump price * Log access to
electricity (t-1)
0.514 0.586 0.492 0.524
[0.306]* [0.305]* [0.275]* [0.249]**
Change in diesel pump price (t-1) -2.778 -3.092 -2.483 -2.815
[1.352]** [1.358]** [1.219]** [1.118]**
Change in diesel pump price (t-2) -0.342 -0.310 -0.262 -0.434
[0.165]** [0.171]* [0.154]* [0.144]***
Change in diesel pump price (t-3) 0.073 0.100 0.207 -0.007
[0.085] [0.086] [0.076]*** [0.077]
Log access to electricity (t-1) -0.133 -0.128 -0.039 0.095 -0.150 -0.145 -0.062 0.042
[0.046]*** [0.045]*** [0.055] [0.093] [0.047]*** [0.047]*** [0.062] [0.095]
Log REER (t-1) -0.217 -0.201 -0.019 0.243 -0.295 -0.286 -0.103 0.201
[0.113]* [0.099]** [0.096] [0.100]** [0.097]*** [0.084]*** [0.086] [0.106]*
Log Diversification index (t-1) 1.681 1.045 -0.032 1.799 1.162 0.095
[0.658]** [0.606]* [0.503] [0.639]*** [0.593]* [0.505]
Log FDI (t-1) 0.002 0.003 0.004 0.002 0.003 0.004
[0.003] [0.003] [0.002]* [0.003] [0.003] [0.002]*
World growth 0.043 0.018 0.042 0.017
Log non-oil real exports (t-1) -0.320 -0.300 [0.078]*** [0.075]*** Constant 1.684 0.696 -0.387 5.781 2.105 1.087 0.034 5.676 [0.518]*** [0.496] [0.463] [1.531]*** [0.456]*** [0.444]** [0.461] [1.448]*** Number of observations 472 472 472 472 473 473 473 473 Number of countries 75 75 75 75 76 76 76 76 R-squared 0.07 0.09 0.19 0.35 0.09 0.11 0.20 0.34
Notes: The dependent variable is the non-fuel real export growth. All estimates include country-fixed effects. Access to electricity is measured as the percentage of urban population connected to the grid. Clustered standard errors at country level in parentheses * p < 0.10, ** p < 0.05, *** p < 0.01.
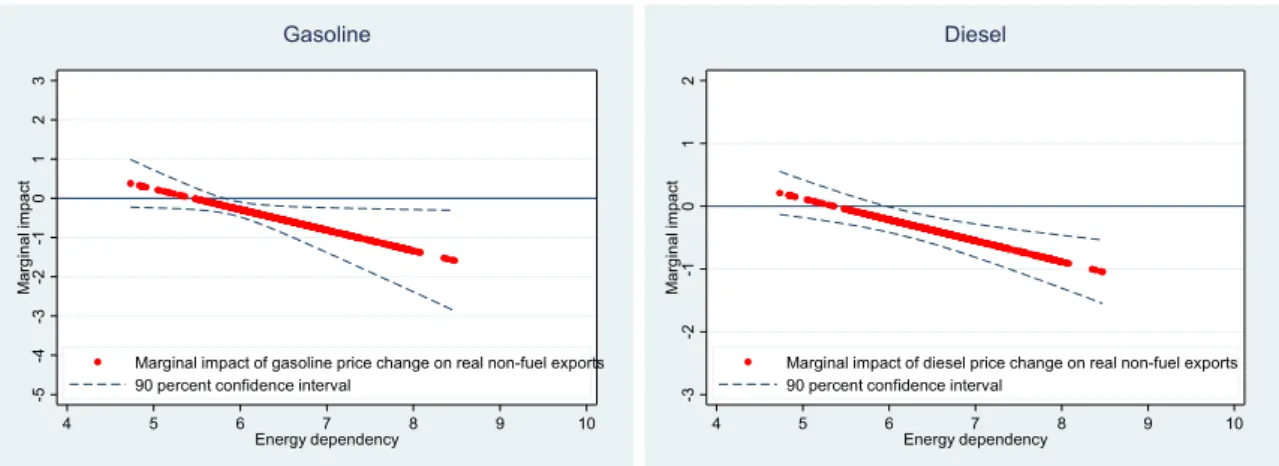
Figure 4. Marginal Effect Conditioning on Energy Dependency
Source: Authors’ calculations.
Notes: This Figure shows the marginal effect of gasoline (diesel) price increase on export growth, conditioning on the level of energy dependency using the estimates in column (3) of Table 4 (column 7 for diesel).
Figure 5. Marginal Effect Conditioning on Access to Electricity
Source: Authors’ calculations.
Notes: This Figure shows the marginal effect of gasoline (diesel) price increases on export growth, conditioning on the level access to electricity. It plots the estimates in column (3) and column (7) of Table 5 for gasoline and diesel, respectively.
Figure 6 (top panel) shows the impulse response functions (IRFs) for the baseline specification. It confirms that fuel price increases are negatively correlated with export growth, with a magnitude comparable to the fixed-effect estimate. However, the impact of the shock is short-lived as it becomes statistically non-significant within two years after the shock. Figure 6 (bottom panel) also
-5 -4 -3 -2 -1 0 1 2 3 Ma rg in al im pa ct 4 5 6 7 8 9 10 Energy dependency
Marginal impact of gasoline price change on real non-fuel exports 90 percent confidence interval
Gasoline -3 -2 -1 0 1 2 Ma rg in al im pa ct 4 5 6 7 8 9 10 Energy dependency
Marginal impact of diesel price change on real non-fuel exports 90 percent confidence interval
Diesel -4 -3 -2 -1 0 1 Ma rg in al im pa ct 3 3.5 4 4.5 5 Access to electricity
Marginal impact of gasoline price change on real non-fuel exports 90 percent confidence interval
Gasoline -4 -3 -2 -1 0 1 Ma rg in al im pa ct 3 3.5 4 4.5 5 Access to electricity
Marginal impact of diesel price change on real non-fuel exports 90 percent confidence interval
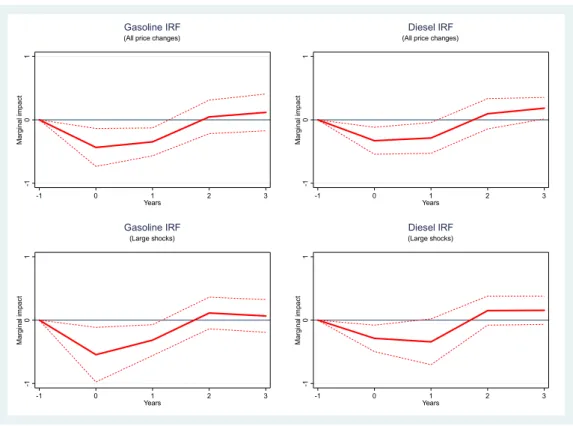
reveals that for large shocks,20 the IRFs are very close to the that for all shocks, thus supporting the
previous findings that large fuel price shocks do not necessarily translate into disproportionately large contractions in exports. Although this result does not argue in favor of either a gradualism or a shock therapy in fuel subsidy reforms, it tends to indicate that there is some merit to gradual reforms to soften the short-term impact of the reform allowing firms to adjust to higher fuel prices. This result is also consistent with the findings that demand for fuel products is typically price-inelastic in the short-term, but in the medium to long-run, demand for fuel products tends to react more strongly to price movements (see for instance, Dahl and Sterner, 1991; Havranekab, Irsova, and Janda, 2012).
Figure 7 and 8 plots the IRFs for countries below and above the average energy dependency and access to electricity, respectively. Consistent with our previous results, fuel price increases do not have any statistically significant effect in the sub-sample of countries with a level of energy use per capita below the sample average. However, for the sub-sample of countries above that average, there is evidence of a negative and statistically significant effect of fuel price increases on non-fuel real exports, which dies out within two years after the shock (Figure 7).21 Likewise, in countries with
high access to electricity, we do not find a meaningful impact of fuel price changes on export growth, in sharp contrast with countries where access to electricity is low. Again, this result is consistent with the role of access to alternative energy sources as a mitigating factor. Further, the contraction in exports appears temporary rather than permanent.
20 In this specification, and as in the fixed effect regressions, large price shocks are those where fuel price changes deviate
from the country-specific average by one standard deviation. For other values, we assign zeros.
21 We have also used another specification with an interaction between fuel prices changes and the dummy for high
Figure 6. Local projection - Baseline estimates
Source: Authors’ calculations.
Notes: These figures show the impulse response functions. The dependent variable is the deviation in the log of non-fuel real export. Regressions include the full list of control variables as well as country fixed effects. Large price shocks are defined as fuel price changes that deviate from the country-specific average by one standard deviation. Year 0 is the year of the shock. We corrected the Local Projection method following Teulings and Zubanov (2014). 90% confidence interval level in dashed lines.
-1 0 1 M ar ginal im pact -1 0 1 2 3 Years (All price changes)
Gasoline IRF -1 0 1 M ar ginal im pact -1 0 1 2 3 Years (All price changes)
Diesel IRF -1 0 1 Ma rg in al im pa ct -1 0 1 2 3 Years (Large shocks) Gasoline IRF -1 0 1 Ma rg in al im pa ct -1 0 1 2 3 Years (Large shocks) Diesel IRF
Figure 7. Conditional effect - Energy dependency
Source: Authors’ calculations.
Notes: These figures show the impulse response functions. The dependent variable is the deviation in the log of non-fuel real export. Regressions include the full list of control variables, as well as country fixed effects. Year 0 is the year of the shock. We corrected the Local Projection method following Teulings and Zubanov (2014). 90% confidence interval level in dashed lines.
3.6. Robustness tests22
A series of robustness tests are carried out to ensure that the findings of the baseline model hold when adding additional variables to the model. Taking the specification in column 6 of table I, we control for additional factors that might affect export growth such as private investment ratio, human capital proxied by secondary education enrollment rate, legal and regulatory environment (as measured by the rule of law index compiled by the World Bank, the Trade Freedom index of the Heritage Foundation, or the share of export tax revenue in total government tax revenue), quality of infrastructure (measured by the World Economic Forum (WEF) index), and flexibility of wage
22 Results not shown in the paper, but available upon request.
-2 -1 0 1 2 M ar ginal im pact -1 0 1 2 3 Years (energy depency below average value)
Gasoline IRF -2 -1 0 1 2 M ar ginal im pact -1 0 1 2 3 Years (energy depency above average value)
Gasoline IRF -2 -1 0 1 2 Ma rg in al im pa ct -1 0 1 2 3 Years (energy depency below average value)
Diesel IRF -2 -1 0 1 2 Ma rg in al im pa ct -1 0 1 2 3 Years (energy depency above average value)
determination (an index compiled by the WEF). In most cases, these variables do not come out statistically significant; our previous findings also remain unaltered.
The results are also robust to potential outliers. Looking at the distribution of export growth, observations that deviates from the sample average by more than two standard deviations (in absolute terms) are excluded from the sample, but the previous findings hold.23 This is also the case
when export growth that deviates from the sample average by half standard deviation (leading to about a 50 percent drop in the sample size) are removed from the sample.
Figure 8. Conditional effect - Access to Electricity
Source: Authors’ calculations.
Notes: These figures show the impulse response functions. The dependent variable is the deviation in the log of non-fuel real export. Regressions include the full list of control variables, as well as country fixed effects. Year 0 is the year of the shock. We corrected the Local Projection method following Teulings and Zubanov (2014). 90% confidence interval level in dashed lines
23 The specification in column 6 of table I was used for this test.
-2 -1 0 1 2 M ar ginal im pact -1 0 1 2 3 Years
(acces to electricity below average value)
Gasoline IRF -2 -1 0 1 2 M ar ginal im pact -1 0 1 2 3 Years
(acces to electricity above average value)
Gasoline IRF -2 -1 0 1 2 Ma rg in al im pa ct -1 0 1 2 3 Years
(access to electricity below average value)
Diesel IRF -2 -1 0 1 2 Ma rg in al im pa ct -1 0 1 2 3 Years
(access to electricity above average value)
4. Conclusion and policy implications
This paper investigates the effect of fuel price increases on export competitiveness in a sample of 77 developing countries over the period 2000-2014. Further, it explores the importance of two conditioning factors (energy dependency and access to alternative energy source) and investigate the persistence in the shock to export growth. Our findings can be summarized as follows. First, fuel price increases tend to lead to a non-negligible decline in real non-fuel export growth, but mostly in countries with high energy dependency and low access to electricity. Second, where fuel price hikes reduce export growth, they do only in the short run (within the first two years after the shock), with no permanent effect on external competitiveness. The results are robust across specifications with a fixed-effect estimator and the local projection approach.
The resulting policy implication is that countries seeking to increase domestic fuel prices (whether it is in the context of a subsidy removal plan or it is driven by higher international oil prices) should not be overly concerned about the impact on export competitiveness. Moreover, mitigating measures and structural reforms that focus on reducing energy inefficiencies and enhancing access to other sources of energy should help a long way in minimizing any potential adverse consequences of higher fuel prices for exports. Further, consideration should be given to gradual price increases to ease the short-term impact on exports, and enable firms in the sector to adjust to higher fuel prices.
References
Aldy, J. E., & Pizer, W. A. (2015). “The Competitiveness Impacts of Climate Change Mitigation Policies,” Journal of the Association of Environmental and Resource Economists, 2(4), 565-595.
Arlinghaus, J. (2015). “Impacts of Carbon Prices on Indicators of Competitiveness: A Review of Empirical Findings”, OECD Environment Working Papers, 87, OECD Publishing, Paris.
Auerbach, A. J., & Gorodnichenko, Y. (2013). “Corrigendum: measuring the output responses to fiscal
policy,” American Economic Journal: Economic Policy, 5(3), 320-22.
Chan, H. R., Manderson, E., & Zhang, F. (2017). “Energy Prices and International Trade: Incorporating Input-Output Linkages.” Policy Research Working Paper. The World Bank, Washington, DC.
Clements, B., Coady, D., Fabrizio, S., Gupta, S., Alleyne, T., & Sdralevich, C., eds. (2013). Energy Subsidy Reform: Lessons and Implications. International Monetary Fund, Washington, DC.
Clements, B., Jung, H. S., & Gupta, S. (2007). “Real and Distributive Effects of Petroleum Price Liberalization: The Case of Indonesia,” Developing Economies, 45(2), 220-237.
Coady, D., del Granado, M. J. A., Eyraud, L., & Tuladhar, M. A. (2013). Automatic fuel pricing mechanisms with price
smoothing: Design, implementation, and fiscal implications. International Monetary Fund, Washington, DC.
Coady, D., Gillingham, R., Ossowski, R., Piotrowski, J., Tareq, S., & Tyson, J. (2010). “Petroleum Product Subsidies: Costly, Inequitable, and Rising,” IMF Staff Position
Note 10/05. International Monetary Fund, Washington, DC.
Costantini, V., Mazzanti, M. (2012). On the Green and Innovative Side of Trade Competitiveness? The Impact of
Environmental Policies and Innovation on EU Exports. Research Policy, 41, 132-153.
Dahl, C., & Sterner, T. (1991). “Analysing Gasoline Demand Elasticities: A
Survey”, Energy Economics, 13 (3), 203-210.
del Granado, F.J.A., Coady, D., & Gillingham, R. (2012). “The unequal benefits of fuel subsidies: A review of evidence for developing countries,” World Development, 40(11), 2234-2248.
Ellis, J. (2010). The Effects of Fossil-Fuel Subsidy Reform: A review of modelling and empirical studies. The Global Subsidies Initiative (GSI) of the International Institute for Sustainable Development (IISD), Geneva.
Fattouh, B., Sen, A., & Moerenhout, T. (2016). “Striking the Right Balance? GCC Energy Pricing Reforms in a Low-Price Environment,” Oxford Institute for Energy Studies.
Gonseth, C., Cadot, O., Mathys, N. A., & Thalmann, P. (2015). “Energy-tax changes and competitiveness: The role of adaptive capacity,” Energy Economics, 48, 127-135.
Hang, L., & Tu, M. (2007). “The Impacts of Energy Prices on Energy Intensity: Evidence from China,” Energy policy, 35(5), 2978-2988.
Havranek, T., Irsova, Z., & Janda, K. (2012). “Demand for Gasoline Is More Price-Inelastic than Commonly
Thought,” Energy Economics, 34(1), 201-207