HAL Id: hal-03023350
https://hal.archives-ouvertes.fr/hal-03023350
Preprint submitted on 25 Nov 2020
HAL is a multi-disciplinary open access
archive for the deposit and dissemination of
sci-entific research documents, whether they are
pub-lished or not. The documents may come from
teaching and research institutions in France or
abroad, or from public or private research centers.
L’archive ouverte pluridisciplinaire HAL, est
destinée au dépôt et à la diffusion de documents
scientifiques de niveau recherche, publiés ou non,
émanant des établissements d’enseignement et de
recherche français ou étrangers, des laboratoires
publics ou privés.
To cite this version:
Anna Albright, Benjamin Fildier, Ludovic Touzé-Peiffer, Robert Pincus, Jessica Vial, et al..
Atmo-spheric radiative profiles during EUREC 4 A. In press. �hal-03023350�
Atmospheric radiative profiles during EUREC
4
A
Anna Lea Albright
1,*, Benjamin Fildier
2,*, Ludovic Touzé-Peiffer
1,*, Robert Pincus
3,4, Jessica Vial
1, and
Caroline Muller
21Laboratoire de Météorologie Dynamique, Sorbonne University, Paris, France. 2Laboratoire de Météorologie Dynamique, Ecole Normale Supérieure, Paris, France
3Cooperative Institute for Research in Environmental Sciences, University of Colorado, Boulder, CO, USA 4NOAA Physical Sciences Lab, Boulder, CO, USA
*These authors contributed equally to this work.
Correspondence: Anna Lea Albright ([email protected])
Abstract.
The couplings among clouds, convection, and circulation in trade-wind regimes remain a fundamental puzzle that limits our ability to constrain future climate change. Radiative heating plays an important role in these couplings. Here we calcu-late the clear-sky radiative profiles from 2001 in situ soundings (978 dropsondes and 1023 radiosondes) collected during the EUREC4A field campaign, which took place south and east of Barbados in January-February 2020. We describe the method
5
used to calculate these radiative profiles and present preliminary results sampling variability at multiple scales, from the vari-ability across all soundings to groupings by diurnal cycle and mesoscale organization state, as well as individual soundings associated with elevated moisture layers. This clear-sky radiative profiles data set can provide important missing detail to what can be learned from calculations based on passive remote sensing and help in investigating the role of radiation in dynamic and thermodynamic variability in trade-wind regimes. All data are archived and freely available for public access on AERIS 10
(Albright et al. (2020), https://doi.org/10.25326/78).
1 Introduction
The EUREC4A field campaign, which took place in January and February 2020 in the trade-wind environment east of
Bar-bados, was designed to elucidate the couplings among clouds, convection, and circulation in trade-wind regimes and under-15
stand the role of this interplay in climate change (Bony et al., 2017). Shallow trade-wind clouds cover large parts of tropical oceans (Wood, 2012), yet their response to warming remains largely unknown, and uncertainty in shallow convective processes are the cause for large uncertainties in climate projections (Bony and Dufresne, 2005; Vial et al., 2013; Sherwood et al., 2014). Among all physical processes involved in shallow convection, atmospheric radiative cooling emerges as key to the coupling between low-level circulations and convection. Understanding the dynamics driven by variations in radiative heating rates, and 20
potential relationship to the mesoscale organization of clear and cloudy regions, was one motivation for the campaign (Bony et al., 2017).
A characteristic feature of the trade-wind vertical moisture profile is a sharp humidity gradient at the top of the cloud layer. Elevated moisture layers are also common. The rich fine-scale vertical moisture structure has important implications for radiative cooling profiles (Stevens et al., 2017), but it is difficult to observe with satellite remote sensing. Indeed, moisture 25
profile features are smaller than typical weighting functions of even hyperspectral instruments (e.g. Maddy and Barnet, 2008; Schmit et al., 2009; Menzel et al., 2018), especially in the lowest three kilometers, corresponding to the weakest absorption lines (Chazette et al., 2014). The lack of informative observations means that the vertical profile of water vapor in large-scale atmospheric analyses is also far simpler than what is indicated by soundings (Pincus et al., 2017). Errors in the vertical moisture structure estimated from remote sensing produce corresponding errors in radiative cooling profiles computed from retrievals 30
and/or analyses, making in situ soundings especially valuable.
Here we calculate radiative profiles from 2001 soundings (978 from dropsondes and 1023 from radiosondes) collected dur-ing EUREC4A, whose network of observations provided extensive sampling of the tropical trade-wind environment. Similar
studies have been conducted over continents as part of the Atmospheric Radiation Measurement program (Kato et al., 1997; Mlawer et al., 1998), over oceans as part of the Coupled Ocean Atmosphere Response Experiment (Guichard et al., 2000), 35
and exploring the radiative effect of transported Saharan dust layers over the tropical Atlantic (Gutleben et al., 2019). These profiles have the potential to complement and further what can be learned from calculations based on passive remote sensing. In addition, this data set may help the understanding of feedbacks acting on the mesoscale spatial organization of shallow convection, a question at the core of EUREC4A (Bony et al., 2020; Stevens et al., 2020).
40
In section 2, we describe the data, the radiative transfer code, and the procedure underlying the calculation of radiative profiles. Section 3 presents initial results to open the discussion on questions that could be explored with these radiative profiles.
2 Data and methods
2.1 Radiosonde and dropsonde data 45
From January 8 to February 19, over 2000 atmospheric soundings were conducted using dropsondes and radiosondes over the tropical Atlantic ocean south and east of Barbados. As the sondes fall or ascend, their simple autonomous sensors, equipped with a GPS receiver, measure the vertical profiles of pressure, temperature, humidity, and instantaneous horizontal wind. To calculate radiative profiles, we employ level-3 data, which have been interpolated into a common altitude grid with 10 meter spacing (Stephan et al., 2020; George, 2020). We select dropsondes and radiosondes that have at least one measurement below 50
200 meters and above 3000 meters, and measurements at a minimum of ten atmospheric levels in total. This simple filter suffices to remove failed soundings and results in an input data set consisting of 978 atmospheric profiles from dropsondes and 1023 profiles from radiosondes.
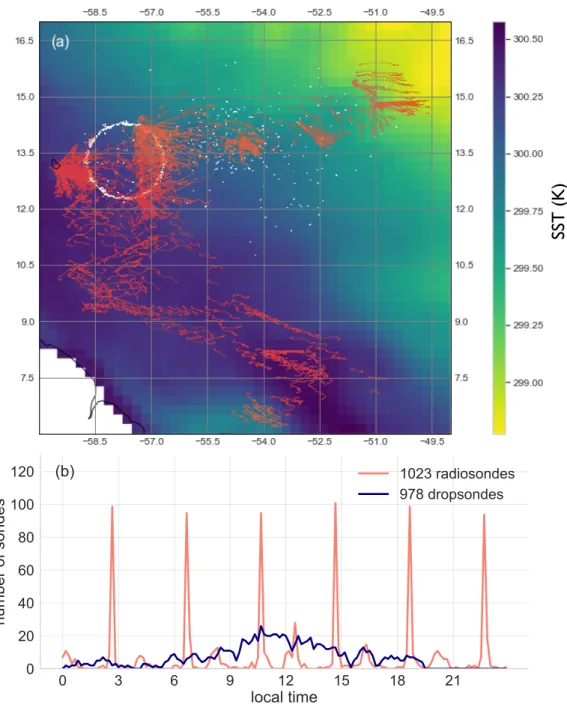
Figure 1a shows the geographic and temporal distributions of the 1023 radiosondes (coral) and 978 dropsondes (white) used to calculate the radiative profiles. Radiosondes were launched from a network of one land station and four research vessels, 55
within a region ranging from 51–60◦W to 6–16◦N. On land, radiosondes were launched from the Barbados Cloud Observatory
(BCO), located on a promontory on the easternmost point of Barbados called Deebles Point (13.16◦N, 59.43◦W), where it is
exposed to relatively undisturbed easterly trade-winds. The fleet of four research vessels includes the French research vessel L’Atalante, two German research vessels Maria S. Merian (MS-Merian) and Meteor, and the American research vessel from the National Oceanic and Atmospheric Administration (NOAA) Ronald H. Brown (RH-Brown). Dropsondes were launched 60
from both the German High Altitude and Long Range Research Aircraft (HALO) and the United States Lockheed WP-3D Orion from NOAA (WP-3D). HALO typically flew at an altitude of 30,000 ft (approximately 9 km), following a circular flight pattern with 90 km radius centered at 13.3◦N, 57.7◦W. When launching sondes, the WP-3D flew at 24,000 ft (approximately
7 km), releasing sondes along both linear and circular patterns in the region covered by HALO, as well as further to the east close to the nominal position of the RH-Brown.
65
Radiosondes were launched every four hours, daily from January 8–February 19, 2020, approximately synchronously from each platform. Given that the time-lag between ascending and descending radiosondes is on the order of hours, and that there is substantial horizontal drift between the ascent and descent, we chose to compute separate radiative profiles for ascending and descending radiosondes. For dropsondes, HALO flight takeoffs were staggered at 5, 8, and 11 am local time, with flights lasting approximately nine hours, yielding roughly 72 sondes per flight. The WP-3D undertook three night flights, which allows for a 70
better characterization of the diurnal cycle, together with the radiosondes launched during the night (Figure 1b).
We refer the reader to Stephan et al. (2020) and George (2020) for a complete description of the radiosonde and dropsonde data sets, and Bony et al. (2017) and Stevens (2020) for an overview of the campaign strategy.
2.2 Radiative transfer calculation
The radiative transfer code used here, RRTMGP (Rapid Radiative Transfer Model for GCMs, Parallel) (Pincus et al., 2019), is 75
a plane-parallel correlated-k two-stream model based on state-of-the-art spectroscopic data for gas and condensate optics. It is based on line parameters from Atmospheric and Environmental Research and the MT_CKD water vapor continuum absorption model (Mlawer et al., 2012). The calculation of radiative profiles from radiosonde and dropsonde data then proceeds in the following way:
1. vertical soundings of temperature, pressure, and water vapor specific humidity at 10 meter resolution are interpolated 80
onto a 1 hPa vertical grid from the lowest to the highest level measured, and then merged with temperature and specific humidity from ERA5 reanalyses. The ERA5 profiles at hourly and 0.25◦resolution (European Centre for Medium-Range
Weather Forecasts, 2017) are linearly interpolated to the location of the sounding. These ERA5 profiles are then used to extend the observed soundings vertically to 0.1hPa and account for the effect of high-altitude thermodynamic variability on the radiative cooling profiles below. To obtain the lower boundary condition, we linearly interpolate the ERA5 sea 85
surface temperature, also at hourly and 0.25◦resolution (European Centre for Medium-Range Weather Forecasts, 2017),
to the location of each sounding;
2. CO2concentrations are set to the present day value of 414 ppm while secondary greenhouse gas concentrations are taken
from the standard tropical atmosphere profile of Garand et al. (2001) for CH4, O3and N2O;
3. the set of resulting profiles is then used as input to RRTMGP to derive upwelling and downwelling clear-sky radiative 90
fluxes in the shortwave and longwave ranges of the spectrum. The calculation uses a spectrally-uniform surface albedo of 0.07 and a spectrally-uniform surface emissivity of 0.98, typical values for tropical oceans (Pincus et al., 2019). Dropsondes and radiosondes drift horizontally as they rise and/or fall (Figure 1a), which could lead to slight errors due to aliasing of horizontal variability in moisture content into vertical variability. This potential source error is less pronounced for dropsondes than for radiosondes due to their faster speed of travel through the troposphere.
95
We also assumed clear-sky conditions for all sondes. Cloud cover in trade-wind regimes is relatively low, between 10% (Nui-jens et al., 2015) and 20% (Medeiros and Nui(Nui-jens, 2016) for active clouds, so clear-sky profiles are representative by construc-tion, and there is evidence that variability in clear-sky radiative heating drives circulations (Seifert et al., 2015; L’Ecuyer et al., 2008; Stephens et al., 2012). Taking into account the influence of clouds on radiative profiles could also be achieved (see for instance Guichard et al., 2000) but would require a number of ad hoc assumptions about the microphysical and optical 100
properties of clouds.
3 Preliminary results and discussion
This section includes a first exploration of the data set to encourage research on the interaction between radiative heating, convection, and circulations. We examine radiative variability at different scales – across all soundings, at the diurnal timescale, and according to different patterns of organization – as well as in individual profiles showing the influence of fine-scale, vertical 105
moisture gradients on radiative heating rates. 3.1 Variability across soundings
A distribution of longwave, shortwave, and net heating rates, as well as large-scale thermodynamic quantities, are shown in Fig. 2. Local extrema in the median shortwave, longwave, and net heating rates occur near 2 km (Fig. 2d,e,f), associated with the rapid decrease in specific and relative humidity at this level (Fig. 2b,c). The top of the planetary boundary layer, or interface 110
between the moist convective layer and dry free troposphere above, is expected to occur around 2km in the trades (Malkus, 1958; Cao et al., 2007; Stevens et al., 2017). The spread in specific and relative humidity is greater than that in temperature, suggesting a strong role for moisture variability on the variability in radiative heating rates. On average, longwave cooling is stronger than shortwave heating, such that net heating rates are largely negative from the surface up to 10 km, with a median value around -1 K/day. Additional local minima in longwave heating are observed around 3 and 5 km between the 5% and 115
25% quantiles, which could correspond to the radiative effect of moisture reaching these higher levels, albeit less frequently (Stevens et al., 2017; Wood et al., 2018a, b; O et al., 2018; Gutleben et al., 2019).
The variability in the distribution of radiative cooling from all soundings, as shown in Fig. 2, can next be investigated in greater detail by partitioning the sources of spread between the variability in time (e.g. diurnal cycle, day-to-day variability) and the spatial characteristics of the convection field (e.g. the spatial distribution of clear and cloudy regions).
120
3.2 Diurnal cycle and day-to-day variability
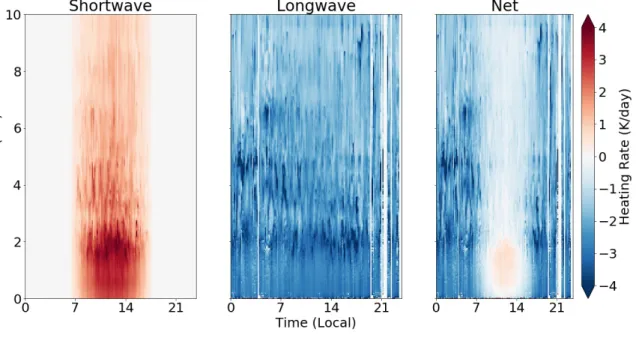
Figure 3 gives an overview of the diurnal variability of radiative heating, which has been implicated in the diurnal cycle of convection and cloudiness (e.g., Gray and Jacobson Jr, 1977; Randall and Tjemkes, 1991; Ruppert and Johnson, 2016; Vial et al., 2019). Shortwave radiative heating follows the solar cycle. Longwave heating rates show less diurnal variability and have approximately the same amplitude (with an opposite sign) as shortwave heating rates during daytime. This compensation 125
between longwave cooling and shortwave heating results in a net heating rate that is slightly negative, but close to zero, during the daytime, whereas during the night, longwave cooling dominates. The maximum nighttime longwave cooling occurs around 2 km, with secondary local minima appearing higher in the atmosphere around 4 and 6km. We note that some variability seen in Fig. 3, such as in the nighttime longwave radiative cooling variability, could be noise, or sampling bias resulting from different numbers of sondes sampled per 10-minute time bin (Fig. 1b).
130
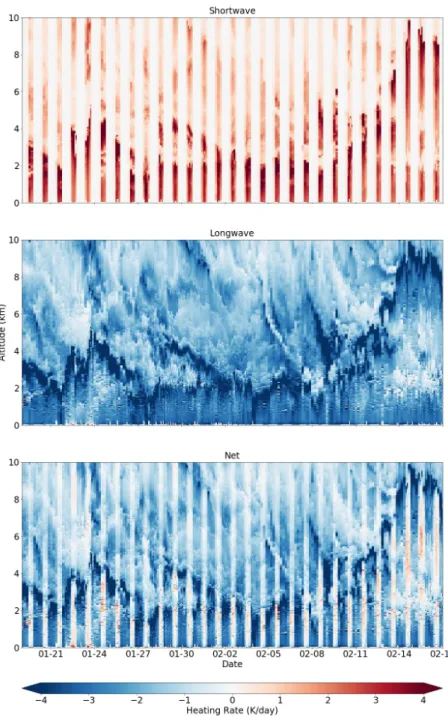
Fig. 4 shows the day-to-day evolution of the shortwave (top), longwave (middle) and net (bottom) heating rates derived from radiosondes launched at BCO. In the shortwave and net heating rates, the daily stripes are due to zero shortwave heating during the night. In the longwave component alone, the amplitude of the diurnal cycle is less evident. Regarding the day-to-day variability, both in the shortwave and the longwave components, trends in radiative heating rates appear to persist over several days. This persistence could potentially be tied to larger-scale synoptic activity or to the development of different types of 135
mesoscale organization. For instance, towards the end of the campaign, the rise in the peak of longwave cooling appears to correspond to the rising location of the interface between the moist, convecting layer below and dry free troposphere above (not shown).
3.3 Spatial organization
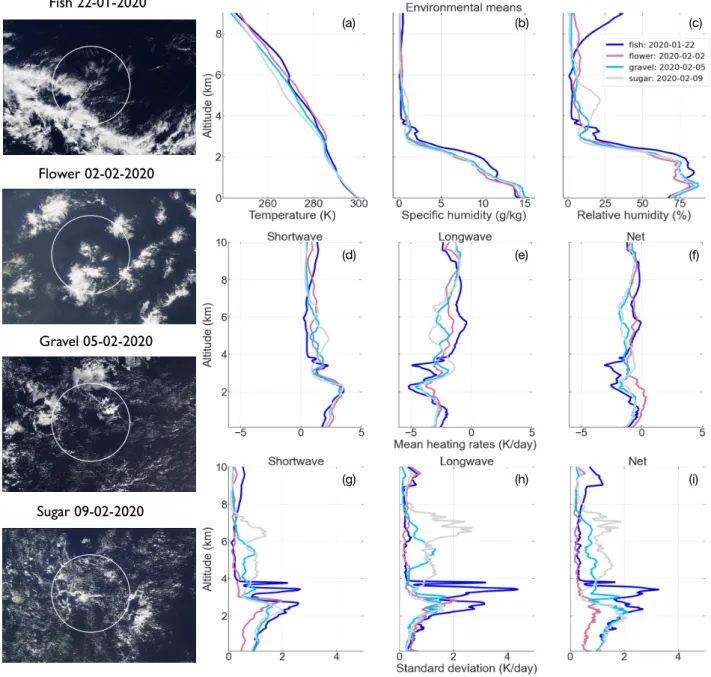
We next aggregate radiative heating rates spatially. Fig. 5 illustrates four representative cases of the Fish-Gravel-Flower-Sugar 140
classification established previously for mesoscale organization patterns of clear and cloudy regions (Bony et al., 2020; Stevens et al., 2020). We choose these four days as a heuristic example given the pattern observable in the GOES-16 satellite images in the HALO flight path shown by the white circle. We plot daily-mean profiles for temperature, specific humidity, and relative humidity (Fig. 5a,b,c), as well as shortwave, longwave, and net radiative heating rates (Fig. 5d,e,f). These profiles were calcu-lated from approximately 70 HALO dropsondes launched during the nine-hour flight on each day. We also plot the standard 145
deviation of radiative heating for each flight (Fig. 5g,h,i). Given an autocorrelation timescale of trade-wind air masses between four and eight hours (Bony and Stevens, 2019), it appears reasonable to assume that on the timescale of one flight, spatial
variability is larger than temporal variability. This reasoning makes the standard deviation of daily radiative heating profiles a sufficient first proxy to examine spatial variability in radiative heating rates.
Spatial variability in radiative heating has been shown to drive shallow circulations(e.g. Naumann et al., 2019) and affect 150
convective organization (e.g. Bretherton et al., 2005; Muller and Held, 2012). In this illustrative example, the differences in the mean and standard deviation of the radiative heating rates hint at a role for differences in radiative cooling rates in the onset or maintenance of mesoscale patterns of organization. For instance, the ‘Fish’ pattern on January 22, 2020 is associated with a moister lower troposphere between 1 and 3km and slightly drier free troposphere above 4km. This vertical moisture distribution may give rise to the observed vertical variability in radiative heating rates, with larger peaks in the mean profile 155
(Fig. 5e) and standard deviation (Fig. 5h) in radiative heating observable between 2 and 4km, likely corresponding to strong humidity gradients at these levels.
Other processes than the moisture-radiation coupling had been proposed from model simulations to explain convective organization, such as interactions between colliding cold pools (Feingold et al., 2010; Haerter, 2019), gravity wave dynam-ics (Stephan, 2020), and moisture-convection interactions (Bretherton and Blossey, 2017). These radiative profiles could help 160
in answering questions including: is there a direct role of radiative feedbacks in the spatial organization of shallow clouds? Can it modulate other contributing processes, for example through an effect on the lifetime or expansion speed of cold pools?
3.4 Individual profiles
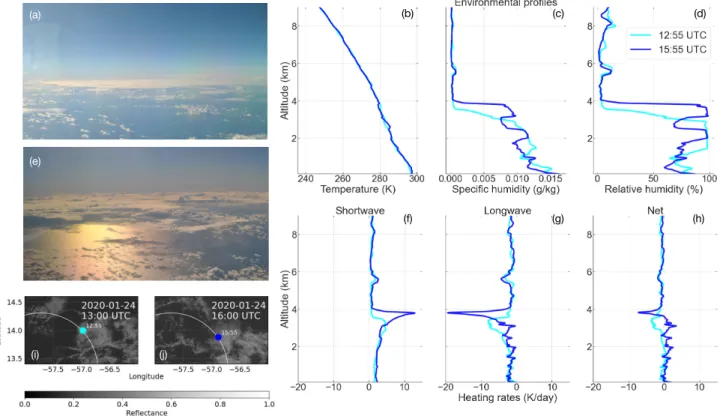
Figure 6 highlights the radiative signatures of elevated moisture layers, which can persist for multiple hours at inversion levels (Stevens et al., 2017; Wood et al., 2018a; Gutleben et al., 2019). We focus in detail on two thermodynamic and radiative heating 165
profiles of a particular elevated moisture layer extending to 4 kilometers, alongside GOES-16 images (Fig. 6i,j) corresponding to these soundings. This structure persisted for at least four hours on January 24, 2020, and we plot thermodynamic conditions and radiative heating profiles sampled three hours apart, at 12:55 and 15:55 UTC (see Fig. 6). A striking feature is the sharp peak in longwave cooling at the top of the moisture layer of nearly -20 K/day at 15:55 UTC, corresponding to the strong humidity gradient, with relative humidity decreasing by nearly 70% in 100 meters (Fig. 6c,d).
170
While we calculate clear-sky profiles only, the present work could be extended to account for radiative effect of cloud liquid water, which could be used, for instance, to investigate the radiative effect of geometrically- and optically-thin ‘veil clouds’ persisting at inversion levels (Wood et al., 2018a, b; O et al., 2018), such as those illustrated by the flight photographs (Fig. 6a,e). Over global oceans, approximately half of low clouds do not fully attenuate space-borne lidar, suggesting that these optically-thin clouds contribute significantly to total cloud cover estimates (Leahy et al., 2012) and have a significant radiative 175
impact (e.g., Wood et al., 2018b).
4 Conclusions
The first objective of this work is to present the method used to calculate clear-sky radiative profiles from 2001 radiosondes and dropsondes launched during the EUREC4A field campaign. These radiative profiles are calculated using a state-of-the-art
line-by-line model, RRTMGP, in which ERA5 reanalyses provide lower and upper boundary conditions. We then aggregate 180
the radiative heating profiles at multiple scales to examine temporal and spatial variability in trade wind regimes. We find that radiative heating rates in the wintertime trade-wind environment display significant diurnal and day-to-day variability, and we observe hints that this variability may be associated with different types of mesoscale organization.
These results present a first overview of how this data set could help answer existing research questions, in particular: 1) What is the role played by radiation in the mesoscale organization of shallow convection? (e.g. Seifert and Heus, 2013; Bretherton 185
and Blossey, 2017) 2) what is the interplay between the diurnal variability in radiative heating, convection, and cloudiness? (e.g., Gray and Jacobson Jr, 1977; Ruppert Jr and O’Neill, 2019; Vial et al., 2019), and 3) what is the influence of clear-sky radiative cooling anomalies on atmospheric circulations? (e.g. Gray and Jacobson, 1977; Mapes, 2001; Emanuel et al., 2014; Thompson et al., 2017; Naumann et al., 2019). Such questions regarding the coupling of clouds, convection, and circulations in trade-wind regimes are at the heart of the EUREC4A field campaign, and the clear-sky radiative profiles presented here
190
complement other EUREC4A observations and data products in forming a toolbox for these investigations.
5 Code and data availability
All data are archived and freely available for public access on AERIS (Albright et al. (2020), https://doi.org/10.25326/78). The code used to compute the radiative profiles and python scripts used to generate the figures of the present paper are publicly released on Zenodo (https://doi.org/10.5281/zenodo.4010195) and Github (https://github.com/bfildier/Albright2020).
195
Author contributions. A.L.A, B.F., and L.T.P contributed equally to the analysis, figures, and text. R.P., C.M. and J.V. helped in conceptual-izing and guiding this project and contributed to the manuscript.
Competing interests. The authors declare that no competing interests are present.
Acknowledgements. A.L.A is grateful for support from the European Research Council (ERC) under the European Union’s Horizon 2020 research and innovation programme (grant agreement #694768). B.F. and C.J.M. gratefully acknowledge funding from the European
Re-200
search Council (ERC) under the European Union’s Horizon 2020 research and innovation programme (Project CLUSTER, grant agreement #805041). L.T.P gratefully acknowledges the funding of his PhD by the AMX program of the Ecole Polytechnique. R. P. is grateful for support from the NOAA Climate Program Office program on Climate Variability and Predictability. To access ERA5 reanalysis data, this study benefited from the IPSL Prodiguer-Ciclad facility which is supported by CNRS, UPMC, Labex L-IPSL and funded by the ANR (Grant #ANR-10-LABX-0018) and by the European FP7 IS-ENES2 project (Grant #312979).
References
Albright, A. L., Fildier, B., and Touzé-Peiffer, L.: Atmospheric radiative profiles during EUREC4A, Earth System Science Data, https://doi.org/10.25326/78, 2020.
Bony, S. and Dufresne, J.-L.: Marine boundary layer clouds at the heart of tropical cloud feedback uncertainties in climate models, Geophys-ical Research Letters, 32, https://doi.org/10.1029/2005GL023851, 2005.
210
Bony, S. and Stevens, B.: Measuring Area-Averaged Vertical Motions with Dropsondes, Journal of the Atmospheric Sciences, 76, 767–783, https://doi.org/10.1175/JAS-D-18-0141.1, 2019.
Bony, S., Stevens, B., Ament, F., Bigorre, S., Chazette, P., Crewell, S., Delanoë, J., Emanuel, K., Farrell, D., Flamant, C., Gross, S., Hirsh, L., Karstensen, J., Mayer, B., Nuijens, L., Ruppert, J. H., Sandu, I., Siebesma, P., Speich, S., Szczap, F., Totems, J., Vogel, R., Wendisch, M., and Wirth, M.: EUREC4A: A Field Campaign to Elucidate the Couplings Between Clouds, Convection and Circulation, Surveys in
215
Geophysics, 38, 1529–1568, https://doi.org/10.1007/s10712-017-9428-0, 2017.
Bony, S., Schulz, H., Vial, J., and Stevens, B.: Sugar, Gravel, Fish, and Flowers: Dependence of Mesoscale Patterns of Trade-Wind Clouds on Environmental Conditions, Geophysical Research Letters, 47, e2019GL085 988, https://doi.org/10.1029/2019GL085988, e2019GL085988 10.1029/2019GL085988, 2020.
Bretherton, C. S. and Blossey, P. N.: Understanding Mesoscale Aggregation of Shallow Cumulus Convection Using Large-Eddy Simulation,
220
Journal of Advances in Modeling Earth Systems, 9, 2798–2821, https://doi.org/10.1002/2017MS000981, 2017.
Bretherton, C. S., Blossey, P. N., Khairoutdinov, M., Bretherton, C. S., Blossey, P. N., and Khairoutdinov, M.: An Energy-Balance Analysis of Deep Convective Self-Aggregation above Uniform SST, Journal of the Atmospheric Sciences, 62, 4273–4292, https://doi.org/10.1175/JAS3614.1, 2005.
Cao, G., Giambelluca, T. W., Stevens, D. E., and Schroeder, T. A.: Inversion variability in the Hawaiian trade wind regime, Journal of
225
Climate, 20, 1145–1160, https://doi.org/10.1175/JCLI4033.1, 2007.
Chazette, P., Marnas, F., Totems, J., and Shang, X.: Comparison of IASI water vapor retrieval with H2O-Raman lidar in the framework of the Mediterranean HyMeX and ChArMEx programs, Atmospheric Chemistry and Physics, 14, 9583–9596, https://doi.org/10.5194/acp-14-9583-2014, 2014.
Emanuel, K., Wing, A. A., and Vincent, E. M.: Radiative-convective instability, Journal of Advances in Modeling Earth Systems, pp. 75–90,
230
https://doi.org/10.1002/2013MS000270.Received, 2014.
European Centre for Medium-Range Weather Forecasts: ERA5 Reanalysis, https://doi.org/10.5065/D6X34W69, 2017.
Feingold, G., Koren, I., Wang, H., Xue, H., and Brewer, W. A.: Precipitation-generated oscillations in open cellular cloud fields., Nature, 466, 849–852, https://doi.org/10.1038/nature09314, 2010.
Garand, L., Turner, D. S., Larocque, M., Bates, J., Boukabara, S., Brunel, P., Chevallier, F., Deblonde, G., Engelen, R., Hollingshead, M.,
235
Jackson, D., Jedlovec, G., Joiner, J., Kleespies, T., McKague, D. S., McMillin, L., Moncet, J. L., Pardo, J. R., Rayer, P. J., Salathe, E., Saunders, R., Scott, N. A., Van Delst, P., and Woolf, H.: Radiance and Jacobian Intercomparison of Radiative Transfer Models Applied to HIRS and AMSU Channels, J. Geophys. Res., 106, 24 017–24 031, https://doi.org/10.1029/2000JD000184, 2001.
George, G.: Dropsondes during EURC4A, 2020.
Gray, W. and Jacobson, R.: Diurnal Variation of Deep Cumulus Convection, Monthly Weather Review, 105, 1171–1187,
240
Gray, W. M. and Jacobson Jr, R. W.: Diurnal variation of deep cumulus convection, Monthly Weather Review, 105, 1171–1188, https://doi.org/10.1175/1520-0493(1977)105<1171:DVODCC>2.0.CO;2, 1977.
Guichard, F., Parsons, D., and Miller, E.: Thermodynamic and Radiative Impact of the Correction of Sounding Humidity Bias in the Tropics, Journal of Climate, 13, 3611–3624, https://doi.org/10.1175/1520-0442(2000)013<3611:TARIOT>2.0.CO;2, 2000.
245
Gutleben, M., Groß, S. M., and Wirth, M.: Cloud macro-physical properties in Saharan-dust-laden and dust-free North Atlantic trade wind regimes: a lidar case study, Atmospheric Chemistry and Physics (ACP), 19, 10 659–10 673, https://doi.org/10.5194/acp-19-10659-2019, 2019.
Haerter, J. O.: Convective Self-Aggregation As a Cold Pool-Driven Critical Phenomenon, Geophysical Research Letters, 46, 4017–4028, https://doi.org/10.1029/2018GL081817, 2019.
250
Kato, S., Ackerman, T. P., Clothiaux, E. E., Mather, J. H., Mace, G. G., Wesely, M. L., Murcray, F., and Michalsky, J.: Uncertainties in modeled and measured clear-sky surface shortwave irradiances, Journal of Geophysical Research: Atmospheres, 102, 25 881–25 898, https://doi.org/10.1029/97JD01841, 1997.
Leahy, L., Wood, R., Charlson, R., Hostetler, C., Rogers, R., Vaughan, M., and Winker, D.: On the nature and extent of optically thin marine low clouds, Journal of Geophysical Research: Atmospheres, 117, https://doi.org/10.1029/2012JD017929, 2012.
255
L’Ecuyer, T. S., Wood, N. B., Haladay, T., Stephens, G. L., and Stackhouse Jr., P. W.: Impact of clouds on atmospheric heating based on the R04 CloudSat fluxes and heating rates data set, Journal of Geophysical Research: Atmospheres, 113, https://doi.org/10.1029/2008JD009951, https://agupubs.onlinelibrary.wiley.com/doi/abs/10.1029/2008JD009951, 2008.
Maddy, E. S. and Barnet, C. D.: Vertical Resolution Estimates in Version 5 of AIRS Operational Retrievals, IEEE Trans. Geosci. Remote Sensing, 46, 2375–2384, https://doi.org/10.1109/TGRS.2008.917498, 2008.
260
Malkus, J. S.: On the structure of the trade wind moist layer, vol. 13, Paper in Physical Oceanography and Meteorology, https://doi.org/10.1575/1912/1065, 1958.
Mapes, B. E.: Water’s two height scales: The moist adiabat and the radiative troposphere, Quart. J. Roy. Meteor. Soc., 127, 2353–2366, https://doi.org/10.1175/1520-0469(1998)055<1354:ETGMSO>2.0.CO;2, 2001.
Medeiros, B. and Nuijens, L.: Clouds at Barbados are representative of clouds across the trade wind regions in observations and climate
265
models, Proceedings of the National Academy of Sciences, 113, E3062–E3070, https://doi.org/10.1073/pnas.1521494113, 2016. Menzel, W. P., Schmit, T. J., Zhang, P., and Li, J.: Satellite-Based Atmospheric Infrared Sounder Development and Applications, Bulletin of
the American Meteorological Society, 99, 583–603, https://doi.org/10.1175/BAMS-D-16-0293.1, 2018.
Mlawer, E., Clough, S., and Kato, S.: Shortwave clear-sky model measurement intercomparison using RRTM, in: Proceedings of the Eighth ARM Science Team Meeting, pp. 23–27, Citeseer, 1998.
270
Mlawer, E. J., Payne, V. H., Moncet, J. L., Delamere, J. S., Alvarado, M. J., and Tobin, D. C.: Development and recent evaluation of the MT-CKD model of continuum absorption, Philosophical Transactions of the Royal Society A: Mathematical, Physical and Engineering Sciences, 370, 2520–2556, https://doi.org/10.1098/rsta.2011.0295, 2012.
Muller, C. J. and Held, I. M.: Detailed Investigation of the Self-Aggregation of Convection in Cloud-Resolving Simulations, Journal of the Atmospheric Sciences, 69, 2551–2565, https://doi.org/10.1175/JAS-D-11-0257.1, 2012.
275
Naumann, A. K., Stevens, B., and Hohenegger, C.: A Moist Conceptual Model for the Boundary Layer Structure and Radiatively Driven Shallow Circulations in the Trades, Journal of the Atmospheric Sciences, 76, 1289–1306, 2019.
Nuijens, L., Medeiros, B., Sandu, I., and Ahlgrimm, M.: The behavior of trade-wind cloudiness in observations and models: The major cloud components and their variability, Journal of Advances in Modeling Earth Systems, 7, 600–616, https://doi.org/10.1002/2014MS000390, 2015.
280
O, K.-T., Wood, R., and Tseng, H.-H.: Deeper, Precipitating PBLs Associated With Optically Thin Veil Clouds in the Sc-Cu Transition, Geophysical Research Letters, 45, 5177–5184, https://doi.org/10.1029/2018GL077084, https://agupubs.onlinelibrary.wiley.com/doi/abs/ 10.1029/2018GL077084, 2018.
Pincus, R., Beljaars, A., Buehler, S. A., Kirchengast, G., Ladstaedter, F., and Whitaker, J. S.: The Representation of Tropospheric Water Vapor Over Low-Latitude Oceans in (Re-)Analysis: Errors, Impacts, and the Ability to Exploit Current and Prospective Observations,
285
Surveys in Geophysics, 38, 1399–1423, https://doi.org/10.1007/s10712-017-9437-z, 2017.
Pincus, R., Mlawer, E. J., and Delamere, J. S.: Balancing Accuracy, Efficiency, and Flexibility in Radiation Calculations for Dynamical Models, Journal of Advances in Modeling Earth Systems, 11, 3074–3089, https://doi.org/10.1029/2019MS001621, 2019.
Randall, D. A. and Tjemkes, S.: Clouds, the Earth’s radiation budget, and the hydrologic cycle, Global and Planetary Change, 4, 3–9, https://doi.org/10.1016/0921-8181(91)90063-3, 1991.
290
Ruppert, J. H. and Johnson, R. H.: On the cumulus diurnal cycle over the tropical warm pool, Journal of Advances in Modeling Earth Systems, 8, 669–690, https://doi.org/10.1002/2015MS000610, 2016.
Ruppert Jr, J. H. and O’Neill, M. E.: Diurnal cloud and circulation changes in simulated tropical cyclones, Geophysical Research Letters, 46, 502–511, https://doi.org/10.1029/2018GL081302, 2019.
Schmit, T. J., Li, J., Ackerman, S. A., and Gurka, J. J.: High-Spectral- and High-Temporal-Resolution Infrared Measurements from
Geosta-295
tionary Orbit, Journal of Atmospheric and Oceanic Technology, 26, 2273–2292, https://doi.org/10.1175/2009JTECHA1248.1, 2009. Seifert, A. and Heus, T.: Large-eddy simulation of organized precipitating trade wind cumulus clouds, Atmospheric Chemistry and Physics,
13, 5631–5645, https://doi.org/10.5194/acpd-13-1855-2013, 2013.
Seifert, A., Heus, T., Pincus, R., and Stevens, B.: Large-eddy simulation of the transient and near-equilibrium behavior of precipitating shallow convection, Journal of Advances in Modeling Earth Systems, 7, 1918–1937, https://doi.org/10.1002/2015MS000489, 2015.
300
Sherwood, S. C., Bony, S., and Dufresne, J.-L.: Spread in model climate sensitivity traced to atmospheric convective mixing., Nature, 505, 37–42, https://doi.org/10.1038/nature12829, http://www.ncbi.nlm.nih.gov/pubmed/24380952, 2014.
Stephan, C. C.: Seasonal modulation of trapped gravity waves and their imprints on trade wind clouds, Journal of the Atmospheric Sciences, 77, 2993–3009, https://doi.org/10.1175/JAS-D-19-0325.1, 2020.
Stephan, C. C., Schnitt, S., Schulz, H., Bellenger, H., Szoeke, S. P. d., Acquistapace, C., Baier, K., Dauhut, T., Laxenaire, R., Morfa-Avalos,
305
Y., et al.: Ship-and island-based atmospheric soundings from the 2020 EUREC4A field campaign, Earth System Science Data Discussions, pp. 1–35, https://doi.org/10.5194/essd-2020-174, 2020.
Stephens, G. L., Li, J., Wild, M., Clayson, C. A., Loeb, N., Kato, S., L’Ecuyer, T., Stackhouse, P. W., Lebsock, M., and Andrews, T.: An update on Earth’s energy balance in light of the latest global observations, Nature Geoscience, 5, 691–696, https://doi.org/10.1038/ngeo1580, 2012.
310
Stevens, B.: EUREC4A Overview Paper, 2020.
Stevens, B., Brogniez, H., Kiemle, C., Lacour, J.-L., Crevoisier, C., and Kiliani, J.: Structure and Dynamical Influence of Water Vapor in the Lower Tropical Troposphere, Surveys in Geophysics, 38, 1371–1397, https://doi.org/10.1007/s10712-017-9420-8, 2017.
Stevens, B., Bony, S., Brogniez, H., Hentgen, L., Hohenegger, C., Kiemle, C., L’Ecuyer, T. S., Naumann, A. K., Schulz, H., Siebesma, P. A., Vial, J., Winker, D. M., and Zuidema, P.: Sugar, gravel, fish and flowers: Mesoscale cloud patterns in the trade winds, Quarterly Journal
315
of the Royal Meteorological Society, 146, 141–152, https://doi.org/10.1002/qj.3662, 2020.
Thompson, D. W. J., Bony, S., and Li, Y.: Thermodynamic constraint on the depth of the global tropospheric circulation, Proceedings of the National Academy of Sciences, 114, 8181–8186, https://doi.org/10.1073/pnas.1620493114, 2017.
Vial, J., Dufresne, J.-L., and Bony, S.: On the interpretation of inter-model spread in CMIP5 climate sensitivity estimates, Climate Dynamics, 41, 3339–3362, https://doi.org/10.1007/s00382-013-1725-9, 2013.
320
Vial, J., Vogel, R., Bony, S., Stevens, B., Winker, D. M., Cai, X., Hohenegger, C., Naumann, A. K., and Brogniez, H.: A new look at the daily cycle of trade wind cumuli, Journal of advances in modeling earth systems, 11, 3148–3166, https://doi.org/10.1029/2019MS001746, 2019.
Wood, R.: Stratocumulus Clouds, Monthly Weather Review, 140, 2373–2423, https://doi.org/10.1175/MWR-D-11-00121.1, 2012.
Wood, R., O, K.-T., Bretherton, C. S., Mohrmann, J., Albrecht, B. A., Zuidema, P., Ghate, V., Schwartz, C., Eloranta, E., Glienke, S., et al.:
325
Ultraclean layers and optically thin clouds in the stratocumulus-to-cumulus transition. Part I: Observations, Journal of the Atmospheric Sciences, 75, 1631–1652, https://doi.org/10.1175/JAS-D-17-0213.1, 2018a.
Wood, R., Tseng, H.-H., et al.: Deeper, precipitating PBLs associated with optically thin veil clouds in the Sc-Cu transition, GeoRL, 45, 5177–5184, https://doi.org/10.1029/2018GL077084, 2018b.
SST
(K
)
Figure 1. (a) The EUREC4A sounding network: 978 soundings from dropsondes (white) and 1023 from radiosondes (coral). We employ 807
dropsondes launched from HALO and 171 dropsondes from the WP-3D to calculate radiative profiles, as well as 216, 249, 114, 240, and 204 radiosondes launched from the Atalante, BCO, MS-Merian, Meteor, and RH-Brown, respectively. Background colors show sea surface temperature (SST) from ERA5 reanalysis at 0.25◦resolution averaged over January and February. (b) The diurnal distribution of the 978
Figure 2. Top: Temperature (a), specific humidity (b) and relative humidity (c) (with respect to ice for T < 0◦C) from EUREC4A dropsonde
and radiosonde data. Bottom: Shortwave (d), longwave (e) and net (f) heating rates calculated from EUREC4A dropsonde and radiosonde
data using the radiative transfer code RRTMGP. The center traces are the median profiles, and the medium and light grey shadings indicate the 25–75% and 5–95% intervals, respectively. For the shortwave, the median and the interquartile range are calculated using daytime values only.
Figure 3. Diurnal composite of shortwave (left), longwave (middle), and net (right) clear-sky heating rates binned in 10-minute intervals. Colored shadings indicate heating rates in units of K/day. The data are plotted with respect to local solar time to simplify interpretation of the diurnal cycle. White indicates the absence of data.
Figure 4. Shortwave (top), longwave (middle), and net (bottom) heating rates at BCO during EUREC4A, from January 19 to February 17.
The heating rates are calculated from radiosondes launched at BCO. In colors are heating rates with units of K/day. White indicates the absence of data.
Fish 22-01-2020 Flower 02-02-2020 Gravel 05-02-2020 Sugar 09-02-2020 (a) (b) (c) (d) (e) (f) (g) (h) (i)
Figure 5. Thermodynamic (a-c), daily mean radiative heating (d-f), and daily standard deviation of radiative heating (g-i) profiles classified by mesoscale organization pattern, using a characteristic example of each type as diagnosed from snapshots from GOES-16 infrared channel (left column). This figure employs HALO dropsondes launched in the circular flight pattern (shown by the white circle) on the chosen day, corresponding to roughly 70 dropsondes each. We focus on the spatial extent of the HALO flight pattern because the cloud organization pattern does not necessarily extend across the entire sampling domain Figure 1a, nor have the patterns been shown to be scale-invariant.
(b) (c) (d)
(f) (g) (h)
(a)
(e)
(i) (j)
Figure 6. Thermodynamic and radiative heating profiles associated with an elevated moisture layer persisting for multiple hours on January 24, 2020 in the HALO flight pattern. Plotted here are the temperature (b), specific humidity (c), relative humidity (d), as well as shortwave, longwave, and net radiative heating rate (f-h) profiles for two soundings sampled three hours apart, at 12:55 and 15:55 UTC. Alongside these profiles are photographs (a,b) taken from the HALO aircraft during the flight and GOES-16 satellite images (i,j), with the dropsonde location and launch time indicated by a circle along the circular flight pattern. Credit for the two flight photographs: J. Vial.