HAL Id: hal-02844079
https://hal.archives-ouvertes.fr/hal-02844079
Submitted on 12 Nov 2020
HAL is a multi-disciplinary open access
archive for the deposit and dissemination of
sci-entific research documents, whether they are
pub-lished or not. The documents may come from
teaching and research institutions in France or
abroad, or from public or private research centers.
L’archive ouverte pluridisciplinaire HAL, est
destinée au dépôt et à la diffusion de documents
scientifiques de niveau recherche, publiés ou non,
émanant des établissements d’enseignement et de
recherche français ou étrangers, des laboratoires
publics ou privés.
Distributed under a Creative Commons Attribution - NonCommercial - NoDerivatives| 4.0
International License
cyclodextrin metal-organic frameworks
Xue Li, Marianna Porcino, Charlotte Martineau-Corcos, Tao Guo, Ting
Xiong, Weifeng Zhu, Gilles Patriarche, Christine Péchoux, Barbara Perronne,
Alia Hassan, et al.
To cite this version:
Xue Li, Marianna Porcino, Charlotte Martineau-Corcos, Tao Guo, Ting Xiong, et al.. Efficient
in-corporation and protection of lansoprazole in cyclodextrin metal-organic frameworks. International
Journal of Pharmaceutics, Elsevier, 2020, 585, �10.1016/j.ijpharm.2020.119442�. �hal-02844079�
UNCORRECTED
PROOF
Contents lists available at ScienceDirect
International Journal of Pharmaceutics
journal homepage: http://ees.elsevier.com
Efficient incorporation and protection of lansoprazole in cyclodextrin metal-organic
frameworks
XueLi
a, MariannaPorcino
b, CharlotteMartineau-Corcos
c,d, TaoGuo
e, TingXiong
f, WeifengZhu
f,
GillesPatriarche
g, ChristinePéchoux
h, BarbaraPerronne
i, AliaHassan
i, RainerKümmerle
i,
AlexandreMichelet
j, AnneZehnacker-Rentien
a, JiwenZhang
e,f, RuxandraGref
a,⁎aUniversité Paris-Saclay, CNRS, Institut des Sciences Moléculaires d'Orsay, 91405 Orsay, France bUniversité d’Orléans, CEMHTI UPR CNRS 3079, F-45071 Orléans, France
cUniversité Paris Saclay, ILV UMR CNRS 8180, Université de Versailles St-Quentin en Yvelines, 78035 Versailles, France dInstitut Universitaire de France (IUF), 75005 Paris, France
eCenter for Drug Delivery Systems, Shanghai Institute of Materia Medica, Chinese Academy of Sciences, 201210 Shanghai, China
fKey Laboratory of Modern Preparation of TCM, Ministry of Education, Jiangxi University of Traditional Chinese Medicine, 330004 Nanchang, China gUniversité Paris-Saclay, CNRS, Centre de Nanosciences et de Nanotechnologies, 91120 Palaiseau, France
hUniversité Paris-Saclay, INRAE, AgroParisTech, GABI, 78350 Jouy-en-Josas, France iBruker Biospin Corporation, 8117 Fällanden, Switzerland
jPerkinElmer, 16 avenue du Québec, 91140 Villebon sur Yvette, France
A R T I C L E I N F O
Keywords Cyclodextrin Metal-organic frameworks Lansoprazole Inclusion complex Drug stabilityA B S T R A C T
Lansoprazole (LPZ) is an acid pump inhibitor, which readily degrades upon acidic or basic conditions and un-der heating. We investigated here LPZ stability upon incorporation in particles made of cyclodextrin metal-or-ganic frameworks (CD-MOFs). LPZ loaded CD-MOFs were successfully synthesized, reaching high LPZ payloads of 23.2 ± 2.1 wt%, which correspond to a molar ratio of 1:1 between LPZ and γ-CD. The homogeneity of LPZ loaded CD-MOFs in terms of component distribution was confirmed by elemental mapping by STEM-EDX. Both CTAB, the surfactant used in the CD-MOFs synthesis, and LPZ compete for their inclusion in the CD cavities. CTAB allowed obtaining regular cubic particles of around 5 µm with 15 wt% residual CTAB amounts. When LPZ was incorporated, the residual CTAB amount was less than 0.1 wt%, suggesting a higher affinity of LPZ for the CDs than CTAB. These findings were confirmed by molecular simulations. Vibrational circular dichroism studies confirmed the LPZ incorporation inside the CDs. Solid-state NMR showed that LPZ was located in the CDs and that it remained intact even after three years storage. Remarkably, the CD-MOFs matrix protected the drug upon thermal decomposition. This study highlights the interest of CD-MOFs for the incorporation and protection of LPZ.
1. Introduction
Cyclodextrin-based metal-organic frameworks (CD-MOFs) have emerged as one of the latest classes of crystalized porous MOFs parti-cles. Since their discovery in 2010 (Smaldone et al., 2010), CD-MOFs have attracted growing interest due to their useful applications in sep-aration, gas storage, sensing, catalysis, and in biomedicine (Arima et al., 2015; Han et al., 2018). Assembled mostly using metals and non-toxic γ-CDs widely used for biomedical applications(Loftsson and Brewster, 1996; Loftsson and Duchêne, 2007), they advantageously display high surface areas, adjustable chemical functionality,
and structural diversity (Arima et al., 2015; Han et al., 2018; Qiu et al., 2020; Smaldone et al., 2010; Qiu et al., 2018). CD-MOFs were shown to incorporate a large variety of anticancer (e.g., doxoru-bicin, fluorouracil, methotrexate, quercetin), anti-inflammatory (e.g., ibuprofen, furbiprofen, fenbufen, ketoprofen), antihypertensive (capto-pril, azilsartan) drugs, acid pump inhibitor (lansoprazole (LPZ)), and various other pharmaceutical ingredients (e.g., salicylic acid, ferulic acid, pseudolaric acid, folic acid, glycyrrhizic acid, etc) (Liu et al., 2017; Lv et al., 2016; Michida et al., 2015; Moussa et al., 2016; Smaldone et al., 2010; Abuçafy et al., 2018; Rajkumar et al., 2019; Xu et al., 2019). As shown in Fig. 1 upper panel, CD-MOFs de
⁎Corresponding author.
E-mail address: ruxandra.gref@universite-paris-saclay.fr (R. Gref) https://doi.org/10.1016/j.ijpharm.2020.119442
Received 29 April 2020; Received in revised form 14 May 2020; Accepted 15 May 2020 Available online xxx
UNCORRECTED
PROOF
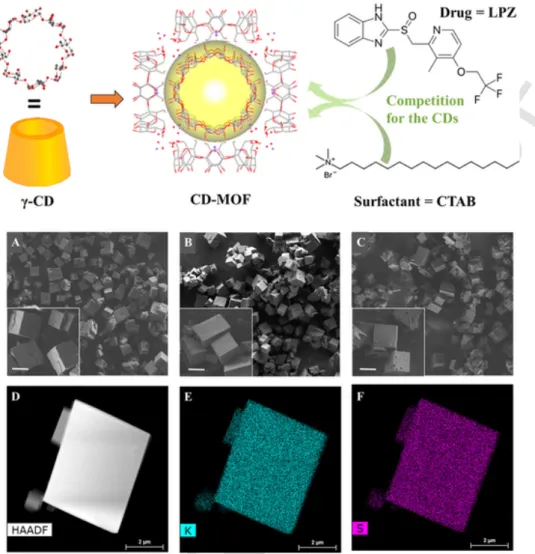
Fig. 1. Upper panel: Schematic representation of the synthesis of CD-MOFs starting from the building units (γ-CDs) and K ions (red dots). The cell unit comprises a cavity (yellow) of
around 1.7 nm which is surrounded by 6 CDs. During synthesis, both the drug (LPZ) and the surfactant (CTAB) compete for the CD cavities. Lower panel: SEM micrographs of empty CD-MOF (A), (±)-LPZ loaded CD-MOF (B) and (R)-LPZ loaded CD-MOF (C) scale bar: 5 µm; HAADF-STEM images (D) and EDX mapping (E: K mapping and F: S mapping) of (±)-LPZ loaded CD-MOF crystals. (For interpretation of the references to colour in this figure legend, the reader is referred to the web version of this article.)
limit an extended framework incorporating the symmetric cyclic γ-CD oligosaccharide, and are based on the coordination of the K+alkali metal cations to alternating α-1,4-linked D-glucopyranosyl units on the primary and secondary faces of the γ-CD tori (Smaldone et al., 2010). Drugs were mainly loaded by impregnation inside the porosity and load-ings reached at best 12.6 wt% in the case of captopril (Liu et al., 2016). The loadings were increased when the molecules of interest were co-crystallized with CD-MOFs. For instance, rhodamine B could be in-corporated with loadings of 18.5 wt% (Smaldone et al., 2010).
One remarkable result was the incorporation of LPZ in CD-MOFs with loadings as high as 23 ± 2 wt% (Li et al., 2017). The crystallized particles of around 6 µm were prepared using cetyltrimethyl ammonium bromide (CTAB) as stabilizer and had regular shapes (Furukawa et al., 2012). When CD-MOFs were prepared in the absence of CTAB, they had irregular shapes and high polydispersity, but the LPZ load-ings were still in the range 21–23 wt%. The high LPZ loadload-ings corre-spond to a 1:1 M ratio between LPZ and γ-CDs in the matrix. How-ever, the role played by CTAB in building regular crystalline supramol-ecular structures without affecting drug loading is still to be uncov-ered. Indeed, both CTAB and LPZ compete for the CD cavities inside the CD-MOFs (Fig. 1, upper panel). Moreover, LPZ is a fragile mole-cule which readily degrades in both acidic (DellaGreca et al., 2006; Ekpe and Jacobsen, 1999; Gupta et al., 2007) and basic conditions (Battu and Pottabathini, 2015; DellaGreca et al., 2006; Liu et al.,
2005), even during storage at 4 °C (DiGiacinto et al., 2000). It was interesting to study here whether the integrity of the drug was preserved upon incorporation in CD-MOFs and long-term storage.
To gain information on LPZ chemical stability as well as LPZ and CTAB respective locations, we employed a set of complementary tech-niques. First, LPZ distribution inside the CD-MOFs was characterized by scanning transmission electron microscope (STEM) associated with en-ergy-dispersive X-ray spectroscopy (EDX), which is a powerful tool to detect compositional distribution in single particles. In particular, the detection of sulfur (present only in LPZ) enabled studying drug distri-bution in these slices of CD-MOFs with high resolution. In addition, vibrational circular dichroism (VCD) enabled studying conformational changes of LPZ inside the CD-MOFs.
The 1H nuclear magnetic resonance (NMR) spectroscopy is often used to study CD-drug inclusions in liquid (Cheng et al., 2018; Di Nunzio et al., 2013; Kundu and Roy, 2017; Rajendiran et al., 2014; Ye et al., 2013) or in solid phase (Ferreira et al., 2015; Sko-rupska et al., 2014; Upreti et al., 2011; Vogt and Strohmeier, 2012; Wulff et al., 2002). Here, although it proved much more chal-lenging, we choose to employ solid-state NMR spectroscopy to directly study the LPZ-loaded in their final state, as crystalline dried powders.
Using state-of-the-art NMR equipment and methods, including high-field magnets (up to 20 T), ultra-fast (up to 60 kHz) magic-angle (MAS) 1H NMR spectroscopy, complemented by1H-19F-13C triple-res-onance
UNCORRECTED
PROOF
NMR and 15N NMR at natural abundance, new atomic-level insights about the interactions between CTAB/LPZ and CD-MOFs, as well as the localization and configuration of CTAB and LPZ in CD-MOFs have been obtained. A special attention has been attributed to the competition of LPZ and CTAB for the CDs in CD-MOFs. These data were further sup-ported by molecular simulation, which allowed comparing the respec-tive interactions between LPZ, CTAB and the CD-MOFs. In a nutshell, the experimental data corroborated the simulations enabling gaining in-sights on the mechanism of formation and locations of individual con-stituents.
Finally, thermogravimetric analysis coupled to Fourier transform in-frared spectroscopy (TGA-FTIR) was used to investigate the thermal de-composition of LPZ as free drug or incorporated in CD-MOFs. The ther-mal stability of the drug molecules was preserved after three years stor-age.
2. Experimental
2.1. Materials and reagents
The chemical compounds, including γ-CD, CTAB, potassium hydrox-ide (KOH), methanol, isopropanol and ethanol were purchased from Sigma-Aldrich Co. Ltd (France). (R)-LPZ was provided by Toronto Re-search Chemicals and (±)-LPZ was provided by Zhuhai Rundu Co. Ltd (China). Water was filtered by a Milli-Q system (18.4 MΩ cm, Millipore, Milford, MA, USA). All chemicals were used without further purifica-tion.
2.2. Synthesis of CD-MOF crystals with or without LPZ
CD-MOF crystals were synthesized as previously reported (Li et al., 2017). Briefly, CD-MOFs were prepared by reacting γ-CD (0.125 mM) with KOH (200 mM). The solution was filtered through a 0.45 μm mem-brane to remove any possible dust. Then, methanol was allowed to dif-fuse in this reaction mixture placed in a vial at 50 °C for 6 h. To obtain monodispersed crystals, 6.0 mL of the supernatant was transferred into another vial with 48.0 mg of CTAB, then the suspension was incubated for 3 h at room temperature. The crystals were finally harvested, washed three times with isopropanol and dried at 50 °C overnight under vac-uum. LPZ-loaded CD-MOFs crystals were synthesized in a similar way, except that (±)-LPZ or (R)-LPZ (80 mM) was added in the aqueous so-lution of γ-CD (0.125 mM) and KOH (200 mM). After purification, the CD-MOFs loaded or not with LPZ were stored at 4 °C in closed vials until further use.
The drug payload is defined as the percentage of LPZ in the drug-loaded CD-MOFs and was calculated as Equation:
2.3. Characterization of CD-MOFs crystals before or after LPZ encapsulation
The morphologies of all synthesized CD-MOF crystals were observed by scanning electron microscopy (SEM). SEM images were acquired on a Zeiss SUPRA 55 VP field emission gun scanning electron microscope fitted with an EDAX EDS analytical system. It was set to a low voltage (1 kV) and low currant (a few pA) in order not to damage the samples and to avoid any conductive coating that could bother direct observa-tion of the samples. Secondary electron type detector was used to record the images.
STEM associated with elemental chemical Energy-dispersive X-ray spectroscopy (EDX) cartography was employed to characterize the ele-mental (C, H, N, S, and Br) distribution in the particles. The MOFs sam-ples were placed on a copper grid covered with a pure carbon mem
brane. The observations in STEM were made on a Titan Themis 200 microscope (FEI/Thermo Fischer Scientific) equipped with a geometric aberration corrector on the probe. This microscope was also equipped with the “Super-X” systems for EDX analysis with a detection angle of 0.9 sr. The observations were made at 200 kV with a probe current of about 70 pA and a half-angle of convergence of 24 mrad. High-angle annular dark-field (HAADF)-STEM images were acquired with a cam-era length of 110 mm (inner/outer collection angles were respectively 69 mrad and 200 mrad).
The synthesized particles were further cut into thin sections for fur-ther STEM observations. Briefly, the dried CD-MOFs powder samples were embedded in epoxy resin (Delta microscopie – France) and poly-merized 48 h at 56 °C. Sections were performed in an ultramicrotome (Leica UC6) using a diamond trim (LFG France). The section thickness was between 100 and 200 nm and the sections were directly collected on 300 mesh carbon grids.
Elemental analysis was performed to quantify the C, H, N, S, and Br elemental weight contents in the CD-MOFs particles loaded or not with LPZ. LPZ and CTAB powders were used as controls. N and S are present only in LPZ but not in CD-MOFs. Moreover, N and Br are in CTAB but not in CD-MOFs. Therefore, the amounts of Br and N found in empty CD-MOFs was used to quantify CTAB content. The amount of S was used to determine the amount of LPZ, and Br for CTAB in LPZ loaded CD-MOFs. The amounts of C, H, and N were used to confirm the results. Briefly, the determination of C, H, N was performed with a combustion method using an Elemental Analyzer (Perkin-Elmer 2400 CHNS/O Se-ries II System). Sample elements were converted to gases at 1050 °C. The quantification of Br was performed using a combustion method to decompose organic samples. Then a potentiometric titration was applied using Titroprocessor (835 Titrando) and ion chromatography analysis was performed on Dionex IC system. Sulfur was determined by a com-bustion method, followed by gravimetric titration and ion chromatogra-phy analysis (Dionex IC system).Inductively coupled plasma mass spec-trometry (ICP-MS) analysis was used to further confirm the payload. Af-ter CD-MOFs digestion using aqua regia (15 min under ultrasonic bath), an ICP-MS equipped with a triple quadrupole (Agilent 8800, Agilent Technologies, Japan) was used for the analysis. Operation conditions were daily optimized using a tuning solution. S isotopes were detected using “mass shift mode” (48SO+,49SO+and50SO+) after their reaction with oxygen in the cell. Dwell time for each of the targeted isotopes was 1 s. S was quantified using external calibration prepared with certified 1000 mg L−1S standard (Merck, Germany).
The vibrational infrared (IR) absorption and VCD spectra of CD-MOFs were measured using a Fourier-transform infrared spec-troscopy (FTIR) spectrometer (Vertex 70, Bruker) equipped with a VCD module (PMA 50, Bruker). The IR radiation was filtered by a low-pass filter cutting at 2000 cm−1, linearly polarized, and then modulated by a 50 kHz ZnSe photo-elastic modulator (Hinds). The signal was measured by a Mercury-Cadmium-Telluride (MCT) IR detector equipped with a BaF2window and cooled with liquid nitrogen then demodulated using a lock-in amplifier (Stanford Research Systems SR 830). A spectral resolu-tion of 4 cm−1was used for both absorption and VCD spectra. The align-ment of the spectrometer was controlled by checking the mirror-im-age relation between the VCD spectra of the two enantiomers of cam-phor (0.3 M in CCl4). The samples were prepared by mixing the stud-ied system with KBr with a mortar and pestle and pressing 200 mg pel-lets. KBr was first grinded in a mixer mill (MM 400 Retsch) at 20 Hz during 30 min and kept dry in an oven at 80 °C, as usually done for the studies of solid samples (Declerck et al., 2019; Pérez-Mellor and Zehnacker, 2017). Two concentrations were used for each system, with the following amounts for 1 g of KBr: 3.8 or 4.3 mg for LPZ, 2.5 or 5 mg for bare CD-MOF, and 4.5 or 5.5 mg for CD-MOF loaded with LPZ. The artefacts due to the birefringence were eliminated following
UNCORRECTED
PROOF
the procedure proposed by Merten (Merten et al., 2008), derived from that introduced by Buffeteau (Buffeteau et al., 2005). It consists in rotating the sample in the plane perpendicular to the light propagation axis for each side of the pellet and averaging the spectra obtained for the pellets at 0°, 90°, 180°, 270°. The measurements were repeated twice. The final spectrum was obtained by adding 2100 scans for each sample position and averaging all the positions so that the total acquisition time was 4 h.
2.4. Solid-state NMR characterization of CD-MOFs crystals with or without LPZ
The1H →19F →13C cross polarized magic angle spinning (CPMAS) NMR spectra were recorded on a Bruker 500 MHz WB NMR spectrome-ter using a1H-19F-X triple-resonance 2.5 mm probe (Martineau et al., 2011). The initial1H →19F CP was used to reduce the repetition de-lay, taking advantage of short T1(1H) compared to T1(19F) (Yu et al., 2015). The13C CP experiments were recorded on a 9.4 T magnet (1H and 13C Larmor frequency of 400 and 100 MHz, respectively) with a Bruker spectrometer, using a 4 mm double resonance MAS probe. The 13C chemical shifts are referenced to TMS. The contact time was set to 3.5 ms, the recycle delay was set at 3 s, the initial 90° pulse on1H to 2.5 μs with a Radio Frequency (RF) field of 70 kHz.1H SPINAL-64 de-coupling was applied during the13C acquisition. The1H MAS NMR spec-tra were recorded at a magnetic field of 18.8 T, using a Bruker 850 MHz WB NMR spectrometer and a HXY 1.3 mm probe in double-resonance mode. The spectra were acquired using Hahn echo pulse sequence, with a 90° pulse duration of 2.5 μs, an inter-pulse delay synchronized with one rotor period and a spinning rate of 60 kHz. The recycle delay was set to 5 s and 16 transients were recorded for each sample. The1H chemical shifts were referenced to TMS. The1H–1H 2D MAS exchange NMR ex-periment was recorded with a recycle delay of 2 s and two different mix-ing times (5 and 10 ms). 700 t1slices with 16 transients were co-added. The States procedure provides a phase sensitive 2D NMR spectrum.
15N CPMAS NMR spectra were recorded on a Bruker 400 WB NMR spectrometer using a 4 mm probe head and spinning at 10 kHz. 10,240 and 75,776 transients were accumulated for LPZ and LPZ loaded CD-MOF, respectively. Similar15N CPMAS NMR spectra were recorded at 8 kHz MAS frequency on a Bruker 600 SB NMR spectrometer using a novel cryogenically cooled 3.2 mm HCN CPMAS probe (Biosolids Cry-oProbe™) (Hassan et al., 2020). 528 and 122 888 transients were ac-cumulated for LPZ and LPZ loaded CD-MOF, respectively. In all cases, acquisition time is 20 ms. No apodization was applied on the LPZ spec-trum, while a 30 Hz Lorentzian apodization was applied on15N CPMAS NMR spectrum of LPZ loaded CD-MOFs. All the samples were finely ground into powders and packed into a zirconia rotor of the appropriate size. The NMR spectra were acquired using TopSpin 3.5 Bruker Software and processed with the DMfit program (Massiot et al., 2002).
2.5. Molecular simulation
The crystal structure of CD-MOFs was extracted from the single crys-tal structure of MOF-1 as reported in the literature (Forgan et al., 2012). In the docking model, an expanded non-periodic structure was used, where the OH– ion was replaced by H2O and the K+ ion was deleted in PyMOL 2.2.0. The molecular structure of γ-CD was extracted from reported CD-MOFs structures (Forgan et al., 2012). The structure of CTAB was obtained from the PubChem of National Center for Biotech-nology Information (PubChem CID: 5974; https://pubchem.ncbi.nlm. nih.gov). AutoDock was then applied using docking program AutoDock Vina 1.1.2 (Allouche, 2012) to optimize their molecular structures.
Lamarckian Genetic Algorithm (LGA) in combination with a grid-based energy evaluation method was used to pre-calculate grid maps according to the interatomic potentials of all atom types present in the host and guest molecules, including the Lennard-Jones poten-tials for van der Waals interactions and Coulomb potenpoten-tials for elec-trostatic interactions. A grid map of dimensions 30 Å × 30 Å × 30 Å and 10 Å × 10 Å × 10 Å, with a grid spacing of 0.375 Å, was placed to cover the CD-MOF and γ-CD models, respectively. With the help of AutoDockTools (Zhao and Sanner, 2007), the atomic partial charges were calculated by the Gasteiger-Marsili method (Gasteiger and Mar-sili, 1980). The parameters used for the global search were an initial population of 50 individuals, with a maximal number of energy evalu-ations of 1,500,000 and a maximal number of generevalu-ations of 50,000 as an end criterion. Other docking parameters were set as default.
2.6. Thermal degradation analysis
Thermal decomposition of LPZ loaded CD-MOFs was investigated using a PerkinElmer thermogravimetric analysis Fourier transform in-frared spectroscopy (TGA-FTIR) system which consists of a TGA 4000 coupled to a FTIR (Spectrum Two) by TL8000 interface. Samples masses ranging from 6 to 10 mg were heated from 25 to 600 °C at a rate of 10 °C/min in a N2atmosphere. The flow rate was approximately 60 mL/ min applied by the TGA 4000 internal mass flow controller and further monitored by TL8000 to ensure the constant flow rate and avoid the gas mixing in the cell. The heated line that transfers evolved gases from the TGA to the FTIR was set at 260 °C and the IR gas cell was held at 270 °C. IR spectra were recorded with a 4 cm−1resolution in the range of 4,000–500 cm−1. Pure LPZ and CD-MOF particles were used as con-trols.
3. Results and discussions
3.1. Synthesis and characterization of LPZ loaded CD-MOFs
CD-MOFs crystals were successfully obtained displaying a crystalline structure with regular cubic morphology and diameters around 5 µm (Fig. 1A), in agreement with previously reported data (Li et al., 2017). The (±)-LPZ or (R)-LPZ loaded CD-MOFs were prepared with a similar procedure except the addition of the drug directly in the reaction mix-ture composed of γ-CD, KOH and CTAB.
LPZ was reported to degrade rapidly within 6–8 h in basic condi-tions, especially at high temperature (e.g. 60 °C (Battu and Potta-bathini, 2015) or 80 °C (Shankar et al., 2017)). In this study, LPZ was incorporated in CD-MOFs at lower temperature (50 °C) and during a 6 h procedure, in the presence of KOH (200 mM). LPZ was extracted from the prepared CD-MOFs and its integrity was assessed by HPLC, showing exactly the same retention time peak without the appearance of degradation products, out ruling a possible degradation during CD-MOF preparation. Possibly, CDs played a protective role, as it has been ob-served in previous studies (Pasic, 2008).
Three complementary methods were used to assess drug loading: i) elemental analysis (determination of “N” and “S” contents in loaded samples) showed that the (±)-LPZ payload reached 21 ± 2 wt% (Table 1); ii) HPLC-UV–vis allowed determining payloads of 22 ± 2 wt% and iii) ICP-MS showed payloads of 20 ± 2 wt%. It was concluded that there is a good agreement between the three methods. Moreover, no signif-icant drug loading differences were observed when (R)-LPZ was incor-porated instead of (±)-LPZ (less than 2% differences, as quantified by ICP-MS, showing (R)-LPZ payload of 20 ± 1.5 wt%). Interestingly, de-spite the high LPZ loadings, the CD-MOFs’ morphology and size were not affected by LPZ incorporation (Fig. 1B and C).
HAADF-STEM images confirmed the regular morphologies of the CD-MOFs possessing sharp edges, loaded or not with the drug (Fig. 1D). When coupled with EDX, this method gave insights on the element
UNCORRECTED
PROOF
Table 1
Elemental analysis of CD-MOFs loaded or not with LPZ. Free LPZ and CTAB were used as controls.
Sample C (%) H (%) S (%) N (%) Br (%) LPZ (%) CTAB (%) Aa A A Bb A B A B LPZ 51.8 ± 0.4 3.3 ± 0.3 9.1 ± 0.3 8.7 ± 0.3 11.15 ± 0.3 – 98 ± 3 (N) 100 ± 3 (S) – CTAB 62.9 ± 0.4 12.2 ± 0.3 – – 3.8 ± 0.1 22.4 ± 0.5 – – 100 ± 3 (N) 101 ± 2 (Br) CD-MOF 42.4 ± 0.4 6.8 ± 0.3 – – 0.6 ± 0.1 3.1 ± 0.3 – – 14.8 ± 3 (N) 14.1 ± 2 (S) LPZ loaded CD-MOF 42.0 ± 0.4 5.5 ± 0.3 2.0 ± 0.3 2.1 ± 0.1 2.6 ± 0.1 0.3 ± 0.1 23 ± 3 (S) 24 ± 3 (S) 0.05 ± 0.02 (N) 1.4 ± 0.5 (Br) A: The experiments were performed with a combustion method using an elemental analyzer; B: The results were obtained by ICP-MS.
distribution inside the particles. The homogeneous distribution of K in the CD-MOFs (Fig. 1E) indicates their homogeneity in terms of compo-sition. Indeed, sulfur (S) is only present in LPZ and not in the CD-MOFs matrix. Fig. 1F shows the high homogeneity in terms of drug distribu-tion in the particles. Control samples (Fig. S1) shows that there is no residual S in the empty CD-MOFs. Fluor (F) is a lighter element com-pared to S, present in LPZ and not in CD-MOFs. Fig. S2 shows that this element diffracted more at the particle edges in thick samples, as con-firmed also by the mapping of C and O.
Thus, to circumvent possible artefacts due to the thickness of the samples and gain deeper insights on the element distribution inside the CD-MOFs, these were cut into slices of 100–200 nm thick and analyzed again by HAADF-STEM. Fig. S3 shows the mapping of all the CD-MOF components (F, C, O, S, K), supporting the homogeneous drug distribu-tion within their structure.
It has been previously reported (Li et al., 2017) by some of us that the Raman spectra of different individual CD-MOFs particles per-fectly superimposed, suggesting the homogenous composition of the drug loaded CD-MOFs particles. However, element mapping (Fig. S3) gave even deeper and clearer insight.
As reported by Furukawa et al (Furukawa et al., 2012), the addi-tion of CTAB during the synthesis of the particles is needed to control their size and achieve regular cubic morphologies. However, no study has been performed yet to elucidate the possible interference of CTAB with drug loading inside CD-MOFs. To do so, CTAB residual amounts in empty and loaded CD-MOFs was determined by both elemental analysis and ICP-MS (Table 1).
As described in materials and method section, CTAB contains Br and N, whereas CD-MOFs do not. Elemental analysis of control samples (CTAB and LPZ) shows that their composition can be retrieved from el-emental analysis data (Table 1). Therefore, the accurate quantification
of Br and N in the synthesized CD-MOFs allows for determining their residual CTAB content.
The amount of CTAB in empty CD-MOF crystals was as high as 15 ± 1.4 wt% (corresponding to molar ratio of 2:3 between CTAB and γ-CD). This suggests that CTAB was incorporated in high amounts in CD-MOFs, possibly poisoning crystals growing and thus allowing for the formation of small crystals. Surprisingly, the amount of residual CTAB in LPZ-loaded CD-MOFs was practically undetectable (less than 0.1 wt%) despite the fact that the same amount of CTAB was used in the prepara-tion procedure as in the case of empty CD-MOFs.
In contrast, the contents of LPZ in the CD-MOFs were similar, whether CTAB was used or not in their preparation procedure (payloads of 21 ± 2 wt% and 23 ± 2 wt%, respectively).
It can be concluded that the addition of LPZ during the CD-MOF for-mation competed with CTAB, and LPZ substituted CTAB in the final par-ticle.
3.2. Solid-state NMR characterization
Magic-angle spinning (MAS) solid-state NMR spectroscopy measure-ments were performed in order to get further information about the in-teraction of CTAB and CD-MOF as well as the modification of LPZ struc-ture upon encapsulation.
3.2.1. Solid-state NMR characterization of CD-MOF
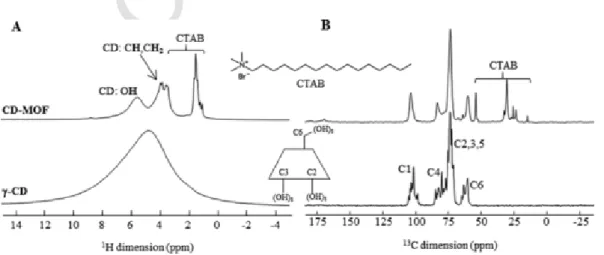
Fig. 2 displays the 1D1H and13C solid-state NMR spectra of pris-tine γ-CD and of the CD-MOF. The1H MAS spectrum of γ-CD shows a single broad featureless resonance while the spectrum of the CD-MOF, acquired under the same experimental conditions, contains three sets of peaks: the hydroxyl protons at 5.20 ppm, the CH groups and the CH2 groups at 3.49 and 3.06 ppm, respectively (Bekiroglu et al., 2003). 1H–13C 2D NMR experiments validate our line assignment (Fig. S5).
UNCORRECTED
PROOF
The lines corresponding to the γ-CD appear narrower on the CD-MOF. This might be due to the intrinsic porosity of the CD-MOF, which in-creases the1H–1H distances, hence reduces the homonuclear dipolar in-teraction and the linewidth. An additional set of peaks is noticed at 1 ppm which corresponds to the aliphatic protons of the CTAB used in the CD-MOF synthesis and trapped in their final structure. This is con-firmed by the13C CPMAS NMR spectrum, which contains, in addition to the peaks of the γ-CD (at 102.2, 82.3, 73.5 and 61.8 ppm), peaks of smaller intensity that correspond to the CTAB. This validates the incor-poration of CTAB in the CD-MOFs detected by the elemental analysis (Table 1).
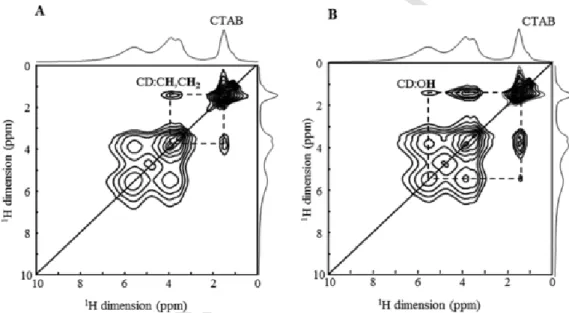
1H–1H 2D MAS NMR homonuclear correlation spectra were recorded to get further insights into the possible location of the CTAB in the CD-MOFs. The 2D 1H–1H NMR spectrum of the CD-MOFs recorded with a short mixing time (Fig. 3A) contains cross-correlation peaks of high intensity between the CTAB and the CH/CH2of the γ-CD, while the intensity of the cross-peaks between the CTAB and the OH of the γ-CD are of a much smaller intensity. This is due to shorter distance
of the CTAB with the inside protons of the γ-CD, which indicates that part of the CTAB is very likely located inside the γ-CD cavity.
3.2.2. Solid state NMR characterization of LPZ loaded CD-MOF
The1H and13C MAS NMR spectra of LPZ loaded CD-MOFs were dis-played in Fig. 4 along with those of pure LPZ. The first observation was that the intensity of the CTAB resonances has strongly decreased (in the 25 ppm region and slightly above 50 ppm), indicating that the drug loading process has expelled most CTAB molecules from the system, as observed by elemental analysis (Table 1).
Several13C NMR experiments were performed to identify and quan-tify the various carbon atoms (Fig. S6): a CP with short contact time (50 μs) allows selection of the proton bearing carbon atoms while a quantitative CP (Johnson and Schmidt-Rohr, 2014) allows the deter-mination of the number of carbon atoms contributing to each13C res-onance (which can arise from the overlap of several C atoms). Care-ful analysis of these experiments showed that all13C resonances of the drug are found in the LPZ loaded CD-MOF sample, supporting he HPLC data which showed that the drug remained intact after the encapsula
Fig. 3.1H–1H 2D MAS NMR correlation spectra of CD-MOF recorded with mixing time of 5 ms (A) and 10 ms (B). The dash lines indicate spatial proximity between the protons of the
CTAB and those of the γ-CD.
Fig. 4.1H MAS (A) and13C CPMAS (B) NMR spectra of pure LPZ (top) and LPZ loaded CD-MOF (bottom). The lines are assigned comparing with LPZ solution (in DMSO‑d6) NMR studies
UNCORRECTED
PROOF
tion process, presumably because it was stabilized inside the MOF par-ticles. Stability of LPZ inside the particles is further supported by the 13C liquid-state NMR spectrum of the CD-MOF dissolved in D2O, which shows the absence of degraded LPZ (Fig. S4).
Finally, the quantitative analysis1H–1H and1H–13C 2D NMR data (Fig. S7) indicate a ratio between the LPZ and γ-CD close to 1:1, cor-roborating the ICP-MS, elemental analysis and HPLC data.
One can notice that the13C resonances corresponding to the car-bon atoms C11 and C20 (overlapped with one CD resonance) of the LPZ have different chemical shifts in the pure and loaded drug (Figs. 4 and 5). Notably, C11 and C20 are flexible sp3carbon atoms, the observed
Fig. 5.13C chemical shift variation (ppm) of the carbon atoms of LPZ pure and loaded in
the CD-MOFs.
shifts hence very likely correspond to a bending of the drug once it is loaded in the CD-MOFs.
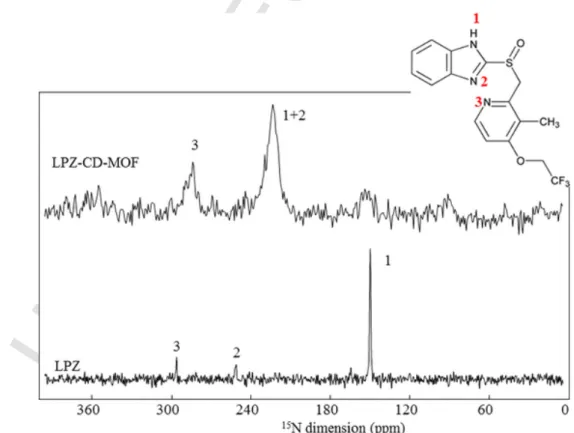
Besides C11 and C20, C5 and C6, which belong to the imidazole ring, also show significant shift of their13C resonance upon loading. These shifts are correlated to the disappearance of the N–H proton of the pure drug (1H chemical shift of 11.5 ppm Fig. 4A), when it is loaded in the CD-MOF and with a strong shift of the15N resonance in the15N CPMAS NMR spectrum (Fig. 6). All these features indicated that the LPZ mole-cules are deprotonated when loaded in the CD-MOF, possibly because of their basic inner microenvironment.
Despite the relatively small amount of drug loaded (below 25%) and broadness of the signals (due to chemical shift distributions), the 15N CPMAS NMR spectrum of the drug-loaded samples could be ob-tained at natural abundance in less than 48 h due to significant signal enhancement provided by the novel cryogenically cooled 3.2 mm HCN CPMAS probe (see experimental section), while no signal could be ob-tained in a week in an usual NMR spectrometer (Fig. S8). In formulated drugs, significant15N NMR sensitivity gain have been obtained using dy-namic nuclear polarization (DNP-MAS) NMR (Ni et al., 2017). How-ever, CD-MOFs are unstable in the solvents that are required for per-forming DNP-MAS studies. Hence, the cryoprobe technology is so far the only technology that allows probing the state of a low API content in formulations that are not amenable to DNP-MAS NMR. Note that the CP-MAS CryoProbe has been used so far for biomolecules (Hassan et al., 2020), and we reported here its first use in the field of materials science. Despite using a high magnetic field (20.0 T) and fast MAS (60 kHz), the1H MAS NMR spectrum of LPZ loaded CD-MOFs only showed broad peaks with extremely low resolution (Fig. 4A and S9), hence 2D1H–1H NMR appeared of limited use. Therefore, to get insights into the inter-actions between the drug and the CD-MOFs, we used the19F nucleus as a spy. The advantage of19F is that there is only one fluorine atom in the compound, which belongs to the drug. We therefore recorded, us-ing a dedicated1H-19F-X probe, a1H-19F-13C double CPMAS NMR ex-periment. The initial1H-19F was used to benefit from the shorter relax
UNCORRECTED
PROOF
ation T1of1H (shorter than 1 s) compared to the one of19F (>5 s). This experiment allows the selection of the carbon atoms in the vicinity of the fluorine atom. The resulting13C NMR spectrum (Fig. 7) was compared to the1H–13C CPMAS NMR spectrum, in which all13C atoms are present (since both the drug and the γ-CD have protons to transfer magnetiza-tion to the carbon atoms). The spectra were normalized to the CD peak at 73 ppm. In the19F-13C CPMAS, one can notice that the CF3and C20 carbons of the LPZ have higher intensity, which is an expected result as these are the closest C atoms to the19F nuclei. There is also a signifi-cant signal for the13C of the γ-CD, indicating its close spatial proximity to the drug. Among the13C signals of the γ-CD, the one labeled C6 in Fig. 2 (which corresponds to the CH2OH) has higher intensity than the other γ-CD carbon atoms (Fig. 7). This indicates that the CF3is in close contact with the CH2OH of the γ-CD, i.e., the molecule is most probably bend so that the CF3groups get located outside of the CD cavity.
To investigate the fate of the LPZ molecules once incorporated in CD-MOF crystals, the synthesized particles were characterized by VCD spectroscopy. (R)-LPZ loaded particles were successfully synthesized, reaching the payload of 20 ± 1.5 wt%. Prior to the VCD spectra, IR spectra was recorded for (R)-LPZ, empty CD-MOFs, and drug loaded CD-MOFs. All the bands of CD-MOFs appear unmodified in the IR absorption spectrum of loaded MOF, indicating that the structure of the crystals was preserved after LPZ loading. Several intense bands of (R)-LPZ also appeared in this spectrum, at 1167, 1267 and 1585 cm−1 (Fig. S11). They were not modified in frequency or intensity relative to (R)-LPZ. This confirmed the successful drug loading in the particles. In contrast, the region of other intense bands of (R)-LPZ, between the bands at 1040 and 1115 cm−1, was modified in the loaded CD-MOF rel-ative to the pure drug (R)-LPZ. This observation points to a modification of the structure of LPZ upon inclusion in the CD-MOFs.
The VCD spectra of (R)-LPZ, bare CD-MOF, and loaded CD-MOF were recorded. As shown in Fig. 8, the spectrum of (R)-LPZ is intense, of the order of 5 × 10⁻⁴. Indeed, intense VCD spectra are often ob-served for crystalline samples. Most bands present in the VCD spectrum of the drug-loaded MOF are due to the CD-MOF itself, further prov-ing that the structure of CD-MOF was kept intact. For example, the IR absorption band of (R) LPZ at 1167 cm−1(shown in Fig. S11) corre
sponds to an intense negative band in the VCD spectrum of (R)-LPZ. Al-though this band is observed in the IR absorption of loaded CD-MOF, it is absent in its VCD spectrum. These data indicate again that the LPZ structure was changed upon inclusion in CD-MOFs. HPLC and NMR data clearly ruled out a possible degradation of the drug. A possible expla-nation of VCD data could be LPZ deprotoexpla-nation, as is suggested by the solid-state NMR data.
3.3. Molecular simulation
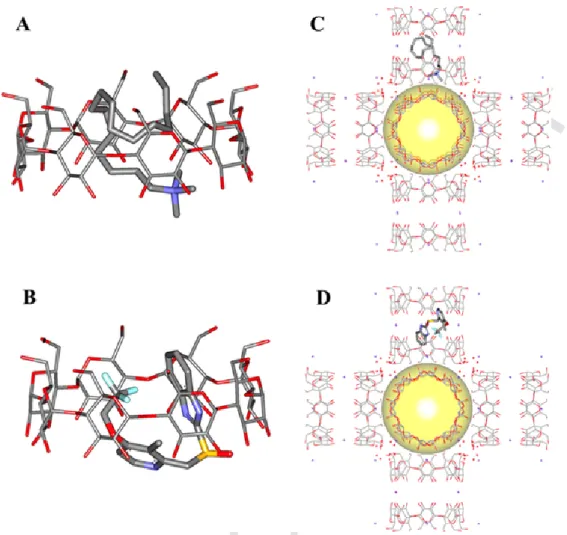
Molecular simulation was carried out to gain insights into the com-petition between CTAB and LPZ to insert into the available cavities of CD-MOFs. First, the interaction of the two molecules with free γ-CDs were studied. Fig. 9 (A,B) shows that both LPZ and CTAB crouch in the hydrophobic γ-CD cavity [14].
In contrast, inside the CD-MOF structures, both LPZ and CTAB pref-erentially locate in the γ-CD pairs of CD-MOF rather than in the cage of CD-MOF (yellow sphere in Fig. 9 C, D).
As shown in Fig. 9, part of the CTAB molecule is nonetheless lo-cated inside the CD-cavity of CD-MOF, which is in agreement with the 1H–1H MAS NMR spectra reported in Fig. 4. When one LPZ molecule is inserted in the system, the CF3group tend to locate outside the γ-CDs of CD-MOF, in between two of them, which is also in agreement with the 19F-13C CPMAS NMR experiments.
LPZ possessed a stronger interaction free energy with both γ-CD (-5.3 kcal⋅mol−1) and CD-MOF (-7.5 kcal⋅mol−1) than CTAB (-2.9 kcal⋅mol−1 and −4.0 kcal⋅mol−1 for γ-CD and CD-MOF, respec-tively).
In summary, the interaction free Gibbs energy of CTAB is weaker than that of LPZ either with CD-MOF or with γ-CD, which explains the experimental observations that LPZ molecules are preferentially incor-porated in the CD-MOFs when both CTAB and LPZ are used for their preparation. This is likely due to the presence of more nonpolar alkyl groups in CTAB than in LPZ. Moreover, simulations were performed to study the competition between LPZ and CTAB molecules for the CD cav-ities in CD-MOFs. To do so, one LPZ molecule and one CTAB mole-cule was placed in contact with one CD Inside the CD-MOF. Based on the free Gibbs energies ΔG and the Eq. (1), at a temperature of 300 K, with R = 8.314 J mol−1K−1and e = 2.71828, the probability that LPZ
Fig. 7.1H →13C (red) and19F →13C (blue) CPMAS NMR spectra of LPZ loaded CD-MOF. The spectra are normalized to the13C resonance of γ-CD at 73 ppm. The lines are assigned. (For
UNCORRECTED
PROOF
Fig. 8. (A) VCD spectrum of (R)-LPZ (red), bare CD-MOF (blue), and (R)-LPZ loaded
CD-MOF (black), together with their absorption spectrum (B). The vertical scale of the VCD spectra is multiplied by 104. (For interpretation of the references to colour in this
fig-ure legend, the reader is referred to the web version of this article.)
forms an inclusion complex was 40 times higher than for the CTAB:CD complex. This again supports the fact that during CD-MOF synthesis, LPZ molecules replace CTAB ones and only trace CTAB is found in the final LPZ-loaded CD-MOFs.
(1)
3.4. Thermal stability of LPZ as free or encapsulated form
Once demonstrated that LPZ was embedded inside the γ-CDs of the CD-MOFs, it was interesting to study if this peculiar configuration allows improving its stability inside the dried particles stored at room tempera-ture up to three years. To do so, thermal decomposition was investigated by TGA-FTIR analysis, combining the TGA ability to accurately and mea-sure weight loss during heating and FTIR allowing to chemically identify the nature of the gas evolved from the sample decomposition.
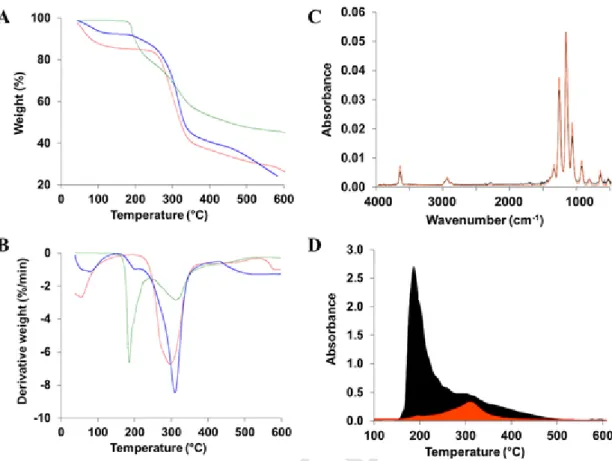
TGA weight loss thermograms and the corresponding derivative curves (DTG) for LPZ, CD-MOF, and LPZ loaded CD-MOF crystals are shown in Fig. 10A and B. Free LPZ degraded in two steps, with specific temperatures of around 190 °C and 315 °C, respectively. Total IR ab-sorbance spectra were recorded when these degradation events occurred (Fig. S12). As illustrated in Fig. 10C, the FTIR spectra correspond-ing to the first gas departure at 190 °C corresponds well to 2,2,2-tri-fluoroethanol (C2H3F3O). The FTIR spectra of the second departure at around 315 °C showed bands at around 1476 cm−1, which were assigned to the departure of LPZ aromatic rings (Fig. S13).
In contrast to LPZ, CD-MOF crystals exhibited different thermal degradation stages with two weight loss regions at around 55 °C and 300 °C. First gas departure at around 55 °C in CD-MOFs thermograms was attributed to isopropanol traces (Fig. S14), as this solvent was used to wash the particles. CD-MOF particles decomposed at around 300 °C.
Finally, three decomposition steps were observed for LPZ-loaded CD-MOFs (Fig. 10, blue curves). The first departure corresponds to iso-propanol traces, as in the case of empty CD-MOFs. The 2,2,2-trifluo-roethanol vapor production corresponding to LPZ decomposition was identified in both second and third departures (around 200 and 310 °C, respectively). Remarkably, the departure of 2,2,2-trifluoroethanol from LPZ-loaded CD-MOFs was dramatically delayed as compared to the pure LPZ (190 °C & 310 °C for pure LPZ and LPZ-loaded CD-MOFs, respec-tively). This delay corresponds to an increased in the stability of the drug upon decomposition which could be attributed to its embedding inside the CD-MOF matrix. These results are in line with the protective effects of LPZ embedding in native CDs upon thermal decomposition of LPZ (Lu et al., 2012).
4. Conclusion
LPZ-loaded CD-MOFs were successfully synthesized displaying regu-lar cubic morphology, uniform size of around 5 µm and high LPZ pay-loads up to 23 ± 2 wt%, which corresponds to a molar ratio of 1:1 be-tween LPZ and γ-CD in the CD-MOFs. The drug was uniformly distrib-uted inside the particles as assesses by STEM-EDX in the whole particles and in thin slices of them. Solid NMR enabled deciphering drug loca-tion and configuraloca-tion inside CD-MOFs, which was well corroborated by molecular simulations and VCD studies.
The drug LPZ was well incorporated inside the constitutive γ-CDs cavities of the CD-MOFs, filling practically all of them. LPZ competes for the γ-CDs with the CTAB surfactant used to modulate the size of the CD-MOFs and replaces it, leading to the formation of crystals devoid of CTAB, but maintaining their high LPZ payloads, which is an advantage for biomedical applications.
Remarkably, the CD-MOF matrix protected the drug upon degrada-tion, even after three years storage at room temperature.
Declaration of Competing Interest
The authors declare that they have no known competing financial in-terests or personal relationships that could have appeared to influence the work reported in this paper.
Acknowledgements
This work was supported by the French National Research Agency (ANR-10-LABX-0035, ANR-14-CE08-0017 and EuronanoMedIII PCI-nano) and the National Science and Technology Major Projects for “Ma-jor New Drugs Innovation and Development” (2018ZX09721002–009). We thank Pierre Florien (CEMHTI Orléans) for help in the 15 N-NMR experiments, financial support from the IR-RMN-THC Fr3050 CNRS, the MIMA2-MET platform (https://doi.org/10.15454/1.
5572348210007727E12) and the Ile-de-France DIM RESPORE. We are
grateful to Dr. Borja Moreira-Alvarez, Dr José M. Costa Fernandez and Dr. Jorge R. Encinar (University of Oviedo, Spain) for ICP-MS experi-ments. MP thanks the Région Centre-Val de Loire for a PhD fellowship. We thank Dr. Mohamed Haouas (ILV, Versailles) for the acquisition of the13C liquid NMR spectrum.
Appendix A. Supplementary data
Supplementary data to this article can be found online athttps://doi. org/10.1016/j.ijpharm.2020.119442.
UNCORRECTED
PROOF
Fig. 9. Simulated configurations of CTAB (A, C) and LPZ (B, D) in monomeric γ-CD (A, B) and in γ-CD-MOF (C, D). K ions was indicated as purple spots in the structure of the CD-MOF. For
the simulation, two LPZ molecules were placed in contact with two CD cavities of the CD-MOFs. (For interpretation of the references to colour in this figure legend, the reader is referred to the web version of this article.)
UNCORRECTED
PROOF
Fig. 10. TGA (A) and DTG (B) curves for LPZ (green), CD-MOFs (red), and LPZ-loaded CD-MOFs (blue); FTIR spectra (C) of LPZ evolved gas at 190 °C (black) and the spectrum of
2,2,2-tri-fluoroethanol from the database (orange); 2,2,2-tri2,2,2-tri-fluoroethanol departure (D) from pure LPZ (black) and LPZ-loaded CD-MOFs (orange). (For interpretation of the references to colour in this figure legend, the reader is referred to the web version of this article.)
References
Abuçafy, M P, Caetano, B L, Chiari-Andréo, B G, Fonseca-Santos, B, do Santos, A M, Chorilli, M, Chiavacci, L A, 2018. Supramolecular cyclodextrin-based metal-organic frameworks as efficient carrier for anti-inflammatory drugs. Eur. J. Pharm. Biopharm. 127, 112–119.
Allouche, A, 2012. Software news and updates gabedit: a graphical user interface for computational chemistry softwares. J. Comput. Chem. 31, 174–182.
Arima, H, Hayashi, Y, Higashi, T, Motoyama, K, 2015. Recent advances in cyclodextrin delivery techniques. Expert Opin. 12, 1425–1441.
Battu, S, Pottabathini, V, 2015. Hydrolytic degradation study of lansoprazole, identification, isolation and characterisation of base degradation product. Am. J. Anal. Chem. 6, 145–155.
Bekiroglu, S, Kenne, L, Sandström, C, 2003. 1H NMR studies of maltose, maltoheptaose, α-, β-, and γ-cyclodextrins, and complexes in aqueous solutions with hydroxy protons as structural probes. J. Org. Chem. 68, 1671–1678.
Buffeteau, T, Lagugné-Labarthet, F, Sourisseau, C, 2005. Vibrational circular dichroism in general anisotropic thin solid films: measurement and theoretical approach. Appl. Spectrosc. 59, 732–745.
Cheng, J G, Yu, H J, Chen, Y, Liu, Y, 2018. Selective binding and controlled release of anticancer drugs by polyanionic cyclodextrins. Bioorganic Med. Chem. 26, 2287–2290.
Declerck, V, Pérez-Mellor, A, Guillot, R, Aitken, D J, Mons, M, Zehnacker, A, 2019. Vibrational circular dichroism as a probe of solid-state organisation of derivatives of cyclic β-amino acids: cis- and trans-2-aminocyclobutane-1-carboxylic acid. Chirality 31, 547–560.
DellaGreca, M, Iesce, M R, Previtera, L, Rubino, M, Temussi, F, Brigante, M, 2006. Degradation of lansoprazole and omeprazole in the aquatic environment. Chemosphere 63, 1087–1093.
Di Nunzio, M R, Wang, Y L, Douhal, A, 2013. Spectroscopy and dynamics of topotecan anti-cancer drug comprisedwithin cyclodextrins. J. Photochem. Photobiol. A Chem. 266, 12–21.
DiGiacinto, J L, Olsen, K M, Bergman, K L, Hoie, E B, 2000. Stability of suspension formulations of lansoprazole and omeprazole stored in amber-colored plastic oral syringes. Ann. Pharmacother. 34, 600–605.
Ekpe, A, Jacobsen, T, 1999. Effect of various salts on the stability of lansoprazole, omeprazole, and pantoprazole as determined by high-performance liquid chromatography. Drug Dev. Ind. Pharm. 25, 1057–1065.
Ferreira, M J G, García, A, Leonardi, D, Salomon, C J, Lamas, M C, Nunes, T G, 2015. 13C and 15N solid-state NMR studies on albendazole and cyclodextrin albendazole complexes. Carbohydr. Polym. 123, 130–135.
Forgan, R S, Smaldone, R A, Gassensmith, J J, Furukawa, H, Cordes, D B, Li, Q, Wilmer, C E, Botros, Y Y, Snurr, R Q, Slawin, A M Z, Stoddart, J F, 2012. Nanoporous carbohydrate metal-organic frameworks. J. Am. Chem. Soc. 134, 406–417. Furukawa, Y, Ishiwata, T, Sugikawa, K, Kokado, K, Sada, K, 2012. Nano- and microsized
cubic gel particles from cyclodextrin metal-organic frameworks. Angew. Chem. Int. Ed. 124, 10718–10721.
Gasteiger, J, Marsili, M, 1980. Iterative partial equalization of orbital electronegativity-a rapid access to atomic charges. Tetrahedron 36, 3219–3228.
Gupta, H P, Saini, K, Dhingra, P, Pandey, R, 2007. Study of acid catalyzed reactions of proton pump inhibitors at D.M.E. Port. Electrochim. Acta 26, 433–448.
Han, Y, Liu, W, Huang, J, Qiu, S, Zhong, H, Liu, D, 2018. Cyclodextrin-based metal-organic frameworks (CD-MOFs) in pharmaceutics and biomedicine. Pharmaceutics 10, 1–21. Hassan, A, Quinn, C M, Struppe, J, Sergeyev, I V, Zhang, C, Guo, C, Runge, B, Theint, T,
Dao, H H, Jaroniec, C P, Berbon, M, Lends, A, Habenstein, B, Loquet, A, Kuemmerle, R, Perrone, B, Gronenborn, A M, Polenova, T, 2020. Sensitivity boosts by the CPMAS CryoProbe for challenging biological assemblies. J. Magn. Reson. 311, 106680. Johnson, R L, Schmidt-Rohr, K, 2014. Quantitative solid-state 13C NMR with signal
enhancement by multiple cross polarization. J. Magn. Reson. 239, 44–49.
Kundu, M, Roy, M N, 2017. Preparation, interaction and spectroscopic characterization of inclusion complex of a cyclic oligosaccharide with an antidepressant drug. J. Incl. Phenom. Macrocycl. Chem. 89, 177–187.
Li, X, Guo, T, Lachmanski, L, Manoli, F, Menendez-Miranda, M, Manet, I, Guo, Z, Wu, L, Zhang, J, Gref, R, 2017. Cyclodextrin-based metal-organic frameworks particles as efficient carriers for lansoprazole: Study of morphology and chemical composition of individual particles. Int. J. Pharm. 531, 424–432.
Liu, B, He, Y, Han, L, Singh, V, Xu, X, Guo, T, Meng, F, Xu, X, York, P, Liu, Z, Zhang, J, 2017. Microwave-assisted rapid synthesis of γ-cyclodextrin metal-organic frameworks for size control and efficient drug loading. Cryst. Growth Des. 17, 1654–1660. Liu, B, Li, H, Xu, X, Li, X, Lv, N, Singh, V, Stoddart, J F, York, P, Xu, X, Gref, R, Zhang,
J, 2016. Optimized synthesis and crystalline stability of γ-cyclodextrin metal-organic frameworks for drug adsorption. Int. J. Pharm. 514, 212–219.
Liu, K H, Kim, M J, Jung, W M, Kang, W, Cha, I J, Shin, J G, 2005. Lansoprazole enantiomer activates human liver microsomal cyp2C9. Pharmacology 33, 209–213. Loftsson, T, Brewster, M E, 1996. Pharmaceutical applications of cyclodextrins. 1. Drug
solubilization and stabilization. J. Pharm. Sci. 85, 1017–1025.
Loftsson, T, Duchêne, D, 2007. Cyclodextrins and their pharmaceutical applications. Int. J. Pharm. 329, 1–11.
UNCORRECTED
PROOF
Lu, Y, Guo, T, Qi, J, Zhang, J, Wu, W, 2012. Enhanced dissolution and stability oflansoprazole by cyclodextrin inclusion complexation: preparation, characterization, and molecular modeling. AAPS PharmSciTech 13, 1222–1229.
Lv, N, Guo, T, Liu, B, Wang, C, Singh, V, Xu, X, Li, X, Chen, D, Gref, R, Zhang, J, 2016. Improvement in thermal stability of sucralose by γ-cyclodextrin metal-organic frameworks. Pharm. Res. 34, 269–278.
Martineau, C, Engelke, F, Taulelle, F, 2011. Multiple resonance heteronuclear decoupling under MAS: dramatic increase of spectral resolution at moderate magnetic field and MAS frequencies. J. Magn. Reson. 212, 311–319.
Massiot, D, Fayon, F, Capron, M, King, I, Le Calvé, S, Alonso, B, Durand, J O, Bujoli, B, Gan, Z, Hoatson, G, 2002. Modelling one- and two-dimensional solid-state NMR spectra. Magn. Reson. Chem. 40, 70–76.
Merten, C, Kowalik, T, Hartwig, A, 2008. Vibrational circular dichroism spectroscopy of solid polymer films: Effects of sample orientation. Appl. Spectrosc. 62, 901–905. Michida, W, Ezaki, M, Sakuragi, M, Guan, G, Kusakabe, K, 2015. Crystal growth of
cyclodextrin-based metal-organic framework with inclusion of ferulic acid. Cryst. Res. Technol. 50, 556–559.
Moussa, Z, Hmadeh, M, Abiad, M G, Dib, O H, Patra, D, 2016. Encapsulation of curcumin in cyclodextrin-metal organic frameworks: dissociation of loaded CD-MOFs enhances stability of curcumin. Food Chem. 212, 485–494.
Ni, Q Z, Yang, F, Can, T V, Sergeyev, I V, D’Addio, S M, Jawla, S K, Li, Y, Lipert, M P, Xu, W, Williamson, R T, Leone, A, Griffin, R G, Su, Y, 2017. In situ characterization of pharmaceutical formulations by dynamic nuclear polarization enhanced MAS NMR. J. Phys. Chem. B 121, 8132–8141.
Pasic, M., 2008. Study to design stable lansoprazole pellets (Ph.D. thesis). Univ. Basel. Pérez-Mellor, A, Zehnacker, A, 2017. Vibrational circular dichroism of a
2,5-diketopiperazine (DKP) peptide: evidence for dimer formation in cyclo LL or LD diphenylalanine in the solid state. Chirality 29, 89–96.
Qiu, C, Wang, J, Qin, Y, Fan, H, Xu, X, Jin, Z, 2018. Green synthesis of cyclodextrin-based metal-organic frameworks through the seed-mediated method for the encapsulation of hydrophobic molecules. J. Agric. Food Chem. 66, 4244–4250.
Qiu, J., Li, X., Gref, R., Vargas-Berenguel, A., 2020. Carbohydrates in metal organic frame-works: Supramolecular assembly and surface modification for biomedical applica-tions, in: Mozafari, M. (Ed.), Metal Organic Frameworks for Biomedical Applications. pp. 445–465
Rajendiran, N, Sankaranarayanan, R K, Saravanan, J, 2014. A study of supramolecular host-guest interaction of dothiepin and doxepin drugs with cyclodextrin macrocycles. J. Mol. Struct. 1067, 252–260.
Rajkumar, T, Kukkar, D, Kim, K H, Sohn, J R, Deep, A, 2019. Cyclodextrin-metal–organic framework (CD-MOF): From synthesis to applications. J. Ind. Eng. Chem. 72, 50–66. Ramulu, K, Rao, B M, Someswara Rao, N, 2013. Identification, isolation and
characterization of potential degradation product in idebenone drug substance. Rasayan J. Chem. 6, 324–333.
Shankar, G, Borkar, R M, Suresh, U, Guntuku, L, Naidu, V G M, Nagesh, N, Srinivas, R, 2017. Forced degradation studies of lansoprazole using LC-ESI HRMS and 1H-NMR experiments: in vitro toxicity evaluation of major degradation products. J. Mass Spectrom. 52, 459–471.
Skorupska, E, Jeziorna, A, Kazmierski, S, Potrzebowski, M J, 2014. Recent progress in solid-state NMR studies of drugs confined within drug delivery systems. Solid State Nucl. Magn. Reson. 57–58, 2–16.
Smaldone, R A, Forgan, R S, Furukawa, H, Gassensmith, J J, Slawin, A M Z, Yaghi, O M, Stoddart, J F, 2010. Metal-organic frameworks from edible natural products. Angew. Chem. Int. Ed. 49, 8630–8634.
Upreti, M, Strassburger, K, Chen, Y L, Wu, S, Prakash, I, 2011. Solubility enhancement of steviol glycosides and characterization of their inclusion complexes with gamma-cyclodextrin. Int. J. Mol. Sci. 12, 7529–7553.
Vogt, F G, Strohmeier, M, 2012. 2D solid-state NMR analysis of inclusion in drug-cyclodextrin complexes. Mol. Pharm. 9, 3357–3374.
Wulff, M, Aldén, M, Tegenfeldt, J, 2002. Solid-state NMR investigation of indomethacin-cyclodextrin complexes in PEG 6000 carrier. Bioconjug. Chem. 13, 240–248.
Xu, J, Wu, L, Guo, T, Zhang, G, Wang, C, Li, H, Li, X, Singh, V, Chen, W, Gref, R, Zhang, J, 2019. A “ Ship-in-a-Bottle ” strategy to create folic acid nanoclusters inside the nanocages of γ-cyclodextrin metal-organic frameworks. Int. J. Pharm. 556, 89–96. Ye, Y, Sun, Y, Zhao, H, Lan, M, Gao, F, Song, C, Lou, K, Li, H, Wang, W, 2013. A novel
lactoferrin-modified β-cyclodextrin nanocarrier for brain-targeting drug delivery. Int. J. Pharm. 458, 110–117.
Zhao, Yong, Sanner, Michel F, 2007. FLIPDock: docking flexible ligands into flexible receptors. proteins. Struct. Funct. Bioinfomatics 68, 726–737.
Yu, C, Bourrelly, S, Martineau, C, Saidi, F, Bloch, E, Lavrard, H, Taulelle, F, Horcajada, P, Serre, C, Llewellyn, P L, Magnier, E, Devic, T, 2015. Functionalization of Zr-based MOFs with alkyl and perfluoroalkyl groups: the effect on the water sorption behavior. Dalt. Trans. 44, 19687–19692.