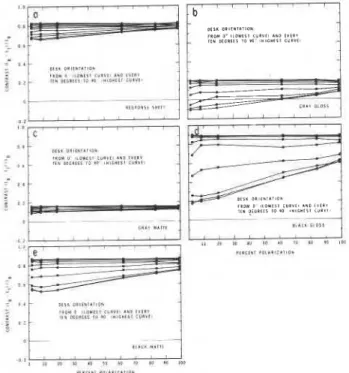
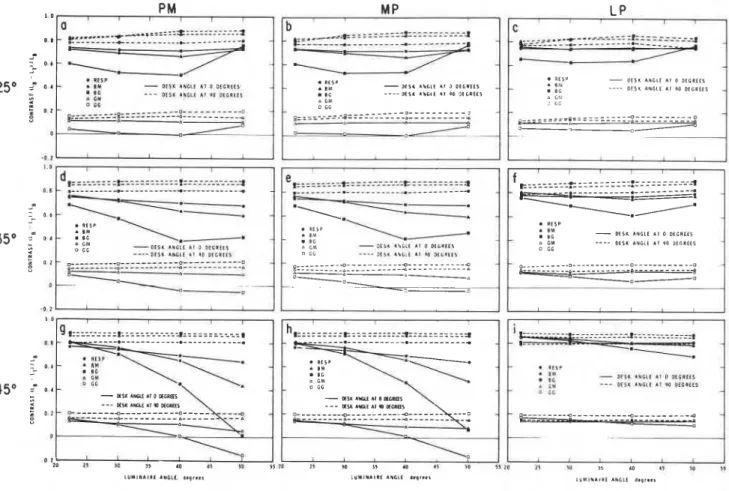
Visual performance with realistic methods of changing contrast
Texte intégral
Figure


Documents relatifs
For each panel, lowercase letters indicate significant groupings by post hoc comparisons using the chi-square test (P \ 0.05) and Student’s t test (P \ 0.05) for infection rates
We proposed two methods satisfying this constraint, based on either color imaging or polarized imaging according to the type of fabric: the color imaging method is suitable
Evaluation of C-reactive protein, an inflammatory marker, and infectious serology as risk factors for coronary artery disease and myocardial infarction.. Fagerberg B, Gnarpe J, Gnarpe
For over- dominant QTL, maximization of crossbred performance one generation at a time resulted in similar responses as optimization across all generations and simultaneous
The absorption parameters of set B ‘insoluble’ samples (Figure 13) showed that the largest number of migrations corresponded to the most hydrophilic samples
Une urne contient 5 boules blanches et 3 boules noires. On tire simultanément de cette urne 4 boules. X égale au nombre de boules blanches tirées. Donner la loi de la v.a. qui suit
(Re)Constructing Memory with “Imagination’s Invisible Ink” in Carol Shields’ The Stone Diaries..
Depth information will help to give a 3D aspect to the impostor and the normal will be used to compute a per pixel dynamic lighting.. The Schaufler’s layered impostor technique
