HAL Id: hal-01963568
https://hal-amu.archives-ouvertes.fr/hal-01963568
Submitted on 21 Dec 2018
HAL is a multi-disciplinary open access archive for the deposit and dissemination of sci-entific research documents, whether they are pub-lished or not. The documents may come from teaching and research institutions in France or abroad, or from public or private research centers.
L’archive ouverte pluridisciplinaire HAL, est destinée au dépôt et à la diffusion de documents scientifiques de niveau recherche, publiés ou non, émanant des établissements d’enseignement et de recherche français ou étrangers, des laboratoires publics ou privés.
Stefano Luccioli, David Angulo-Garcia, Rosa Cossart, Arnaud Malvache,
Laura Mòdol, Vitor Hugo Sousa, Paolo Bonifazi, Alessandro Torcini
To cite this version:
Stefano Luccioli, David Angulo-Garcia, Rosa Cossart, Arnaud Malvache, Laura Mòdol, et al.. Mod-eling driver cells in developing neuronal networks. PLoS Computational Biology, Public Library of Science, 2018, 14 (11), pp.e1006551. �10.1371/journal.pcbi.1006551�. �hal-01963568�
Modeling driver cells in developing neuronal
networks
Stefano Luccioli1,2, David Angulo-Garcia3, Rosa Cossart4, Arnaud Malvache4,
Laura Mo´ dol4
, Vitor Hugo Sousa4, Paolo Bonifazi5,6‡, Alessandro TorciniID1,4,7‡*
1 CNR - Consiglio Nazionale delle Ricerche - Istituto dei Sistemi Complessi, Sesto Fiorentino, Italy, 2 INFN
Sez. Firenze, Sesto Fiorentino, Italy, 3 Grupo de Modelado Computacional - Dina´mica y Complejidad de Sistemas, Instituto de Matema´ ticas Aplicadas, Universidad de Cartagena, Cartagena de Indias, Colombia,
4 Aix Marseille Univ, INSERM, INMED, Marseille, France, 5 Biocruces Health Research Institute, Bilbao,
Vizcaya, Spain, 6 Ikerbasque: The Basque Foundation for Science, Bilbao, Spain, 7 Laboratoire de Physique The´orique et Mode´lisation, Universite´ de Cergy-Pontoise, CNRS, UMR 8089, Cergy-Pontoise, France ‡ These authors are joint senior authors on this work.
Abstract
Spontaneous emergence of synchronized population activity is a characteristic feature of developing brain circuits. Recent experiments in the developing neo-cortex showed the existence of driver cells able to impact the synchronization dynamics when single-handedly stimulated. We have developed a spiking network model capable to reproduce the experi-mental results, thus identifying two classes of driver cells: functional hubs and low function-ally connected (LC) neurons. The functional hubs arranged in a clique orchestrated the synchronization build-up, while the LC drivers were lately or not at all recruited in the syn-chronization process. Notwithstanding, they were able to alter the network state when stimu-lated by modifying the temporal activation of the functional clique or even its composition. LC drivers can lead either to higher population synchrony or even to the arrest of population dynamics, upon stimulation. Noticeably, some LC driver can display both effects depending on the received stimulus. We show that in the model the presence of inhibitory neurons together with the assumption that younger cells are more excitable and less connected is crucial for the emergence of LC drivers. These results provide a further understanding of the structural-functional mechanisms underlying synchronized firings in developing circuits pos-sibly related to the coordinated activity of cell assemblies in the adult brain.
Author summary
There is timely interest on the impact of peculiar neurons (driver cells) and of small
neuro-nal sub-networks (cliques) on operational brain dynamics. We first provide experimental
data concerning the effect of stimulated driver cells on the bursting activity observable in the developing entorhinal cortex. Secondly, we develop a network model able to fully reproduce the experimental observations. Analogously to the experiments two types of driver cells can be identified: functional hubs and low functionally connected (LC) cells. We explain the role of hub neurons, arranged in a clique, for the orchestration of the
a1111111111 a1111111111 a1111111111 a1111111111 a1111111111 OPEN ACCESS
Citation: Luccioli S, Angulo-Garcia D, Cossart R,
Malvache A, Mo´dol L, Sousa VH, et al. (2018) Modeling driver cells in developing neuronal networks. PLoS Comput Biol 14(11): e1006551.
https://doi.org/10.1371/journal.pcbi.1006551
Editor: Michele Giugliano, BELGIUM Received: February 6, 2018 Accepted: October 7, 2018 Published: November 2, 2018
Copyright:© 2018 Luccioli et al. This is an open access article distributed under the terms of the
Creative Commons Attribution License, which permits unrestricted use, distribution, and reproduction in any medium, provided the original author and source are credited.
Data Availability Statement: All relevant data are
within the paper and its Supporting Information files.
Funding: The authors acknowledge financial
support from the European Commission under the program "Marie Curie Network for Initial Training", project N. 289146, "Neural Engineering Transformative Technologies (NETT)" (SL, DAG, AT), by the A�MIDEX grant (No.
ANR-11-IDEX-0001-02) and by the I-Site Paris Seine Excellence Initiative (No. ANR-16-IDEX-0008), both funded by the French Government programme
bursting activity in control conditions. Furthermore, we report a new mechanism which can explain why and how LC drivers emerge in the structural-functional organization of the entorhinal cortex.
Introduction
Coordinated neuronal activity is critical for a proper development and later supports sensory processing, learning and cognition in the mature brain. Coordinated activity represents also an important biomarker of pathological brain states such as epilepsy [1]. It is therefore essen-tial to understand the circuit mechanisms by which neuronal activity becomes coordinated at a population level. A series of experimental results indicates that non-random features are clearly expressed in cortical networks [2–4], in particular neuronal sub-networks, termed cli-ques [5], have been shown to play a fundamental role for the network activity and coding both in experiments [6–10] as well as in models [11–14].
The identification of these small highly active assemblies in the hippocampus [6] and in the cortex [7–9] poses the question if these small neuronal groups or even single neurons can indeed control the neural activity at a mesoscopic level. Interestingly, it has been shown that the stimulation of single neurons can affect population activity in vitro as well as in vivo [15–25]. The direct impact of single neurons on network and behavioral outputs demonstrates the importance of the specific structural and functional organization of the underlying cir-cuitry. Neurons having such a network impact were recently termedoperational hubs [26] or
driver cells [24]. It is thus critical to understand how specific network structures can empower single driver cells to govern network dynamics. This issue has been addressed experimentally in some cases. More specifically, in the developing CA3 region of the hippocampus, single GABAergic hub neurons with an early birthdate were shown to coordinate neuronal activity. These cells have a high functional connectivity degree, reflecting mainly the fact that they are activated at the onset of Giant Depolarizing Potentials (GDPs), as well a high effective connec-tivity degree [17]. This therefore represents a simple case where the circuit mechanism, pro-moting a cell to the role of hub, is due to their exceptional number of anatomical links. But the picture can be quite different in other brain regions, as recently demonstrated in the develop-ing Entorhinal Cortex (EC) [24], where the driver cell population comprises both cells with a high functional out-degree, as well as low functionally connected (LC) cells.
In order to understand the circuit mechanisms by which even a LC cell can influence popu-lation bursts we have upgraded and modified a network model based on excitatory leaky inte-grate-and-fire (LIF) neurons [12], previously developed to reproduce the functional properties of hub neurons in the developing hippocampal CA3 area [17]. In such a model thepopulation bursts (PBs), corresponding to GDPs in neonatal hippocampus [27], were controlled by the sequential and coordinated activation of few functional hubs. Notably, the perturbation of one of these neurons strongly impacted the collective dynamics and brought even to the complete arrest of the bursting activity, similarly to what experimentally found for the developing hippo-campus in [17]. The model described in this paper contains two main differences with respect to the hippocampal model [12].
Firstly, it comprises both inhibitory and excitatory neurons, to account for the fact that, even though GABA acts as an excitatory neurotransmitter at early postnatal stages, some more developed neurons have already made the switch to an inhibitory transmission at the end of the first postnatal week in mice (P8), where most experimental data was obtained [28–30]. In that respect, the maturation profile of the entorhinal-hippocampal circuit was recently Ikerbasque (The Basque Foundation for Science)
(PB) and from the Ministerio Economia, Industria y Competitividad of Spain (grant SAF2015-69484-R (MINECO/FEDER)) (PB). The funders had no role in study design, data collection and analysis, decision to publish, or preparation of the manuscript.
Competing interests: The authors have declared
analyzed and it was shown that stellate cells in layer 2 of the medial EC were the first to mature, followed, in chronological order, by pyramidal cells in MEC layer 2 and CA3 [31]. This indi-cates a higher probability to find inhibitory GABAergic synapses in EC with respect to CA3 and it justifies our choice to include some inhibitory neuron in the model. Secondly, the devel-opmental profile of the network is regulated only by the correlation between neuronal excit-ability and connectivity, while in [12] a further correlation was present. The anti-correlation between intrinsic excitability and the synaptic connectivity reproduces to some extent the homeostatic regulation of the intrinsic excitability described during neural development [32]. This model nicely mimicked the experimental observations in the EC similarly displaying the presence of driver cells with both low and high functional connectivity.
The paper is organized as follows. Firstly, we will report experimental evidences of how the stimulation of single LC drivers can impact network synchonization in the developing EC. Sec-ondly, we will show that our simple model can nicely reproduce such results. This to validate its applicability in order to understand the synchronization dynamics of the EC at the early stage of the development. Then, we will present a full characterization of the numerical model leading to a complete understanding of the mechanism underlying the PB generation and the impact of driver LC cells on population dynamics. We will conclude with a discussion of the obtained results and of their possible relevance in the context of neuroscience.
Results
Experimental evidences of driver LC cells
The main experimental observation at the rationale of this work is the existence ofdriver cells
(or Operational Hubs [26]) in the mice EC during developmental stage [24]. Driver cells have been identified using calcium imaging experiments and they were characterized by the capa-bility to impact network synchronization (namely, GDPs0occurence) when externally acti-vated/stimulated through intra-cellular current injection. Two classes of driver cells were identified: (i) those with high directed functional connectivity out-degree, early activated and playing a critical role in the network synchronizations (driver hub cells) and (ii) those recruited
only in the later stages of the synchronization build up, which therefore are low functionally connected (driver LC cells).
The experimental setup used to identify, target and probe the single-handedly impact of neurons on spontaneous EC synchronization is schematized inFig 1(a.E)andS1 Fig. In brief, the functional connectivity of the cells has been measured during the spontaneous activity ses-sion, which preceded the single neurons’ stimulation sesses-sion, both lasting two minutes. A directed functional connection from neuronA to B was established whenever the firing activity
ofA significantly preceded the one of neuron B (more details can be found in Methods). The
functional out-degreeDO
i of a neuroni corresponded to the percentage of imaged neurons
which were reliably activated after its firing. Neurons in the 90% percentile of the connectivity distribution were classified as hub neurons early activated in the network synchronization.
The protocol used for probing the impact of single neurons on the network dynamics was organized in three phases, each of two minutes duration: (1) a pre-stimulation resting period; (2) a stimulation period, during which a series of supra-threshold current pulses at a specific frequencyνShave been injected into the cell; (3) a final recovery period, where the cell is no
more stimulated. The frequenciesνSemployed to stimulate the single neurons have been
selected to be of the order of magnitude of the average GDP frequency with the aim of reveal-ing cell-network interaction.
A cell was identified as a driver whenever the distributions of the Inter-GDP-Intervals (IGIs) were significantly different in the stimulation period with respect to the pre-stimulation
and recovery periods (seeMethodsfor more details). A further indicator that we use to visual-ize the effect of the stimulation on the GDP deliver is the shift of the IGI phase F measured with respect to the pre-stimulation phase (for the definition seeMethodsEq (1)and in [33]). At a population level the stimulation may have an inhibitory (excitatory) effect corresponding
Fig 1. Impact of single-handedly stimulation of LC drivers on the collective dynamics of the entorhinal cortex and of the model. The left column
(x.E) refers to experimental measurements taken in slices of EC, while the right column (x.S) to the numerical results. Experiment. The first panel (a.E) presents the image of a slice loaded with the calcium sensor where the active neurons are encircled and the pipette indicates the neuron targeted for intracellular stimulation. Scale bar: 100μm. Data for a neuron with functional out-degree DO’ 7% are reported in (b-d.E), data for a neuron (from a different slice) withDO’ 8% are shown in (e-g.E). Panels (b.E) and (e.E) are boxplot of the IGIs for each experimental phase. Panels (c.E) and (f.E) represent the fraction of recruited cells participating in the GDP. During the stimulation period (red curves) a single cell is stimulated with a frequency
νS= 0.33 Hz (νS= 0.14 Hz) for the first (second) neuron according to the protocol discussed in the text. Panels (d.E) and (g.E) report the phase F of the GDP versus the GDP index (denoting the successive GDP cycles). F is the difference between the number of observed versus expected GDPs relative to the pre-stimulation frequency (seeMethods). The average IGI was 4.2 s (7.8 s) in the pre-stimulation phase, becoming 3.2 s (14 s) during the
stimulation period for the first (second) neuron. Model. The first row (a.S) displays a cartoon of the performed single neuron stimulation experiment in the network model, where inhibitory (inh.) and excitatory (exc.) neurons and synapses are marked in green and black respectively. Panels (b-d.S) refer
to the excitatory driver LC cellel1which was silent in control condition and once stimulated with a currentIstim= 15.135 mV was able to enhance
population dynamics. Panels (e-g.S) refer to the excitatory driver LC cellel2which was active in control condition withDO= 3% and once stimulated
with a currentIstim= 15.435 mV depressed the PB activity.
to a slow-down (acceleration) of the GDP frequency associated with an increase (decrease) of the measured IGI corresponding to a positive (negative) phase shift. Two examples of driver LC cells, withD0’ 7− 8%, are reported inFig 1in the panels (b-d.E) and (e-g.E). In the first case, upon stimulation the network dynamics accelerated, as testified by the decrease of the average IGI (Fig 1(b.E)) and by the negative instantaneous phase shift of GDPs (Fig 1d.E). In the second case, the stimulation led to a pronounced slow down of the average network activity (as shown inFig 1(e.E)) together with an increase of the instantaneous phase with respect to control conditions (Fig 1(g.E)). In both cases the removal of the stimulation led to a recovery of the dynamics similar to the control ones.
A further extreme case of a silent cell, i.e. not spontaneously active and therefore with a zero (out-degree) functional connectivity, is shown inFig 2. This cell, when stimulated with different stimulation frequenciesνS, revealed opposite effects on the network behaviour. At
lower stimulation frequency (νS= 0.33 Hz) the cell activity induced an acceleration of the
pop-ulation dynamics (seeFig 2(a)–2(c.E)), while at higher stimulation frequency (νS= 1 Hz) of the
same neuron we observed a slowing down of the network dynamics (seeFig 2(d)–2(f.E)). By considering a much larger pool of driver cells we have verified that the value ofνSdoes not
induce a systematic trend towards a slow down or an acceleration of the GDPs (for more details seeS2 TextandS3 Fig).
We also tested the possibility that single neuron stimulation could modify other features of network synchronization besides the GDP frequency, in particular we focused on the width of the GDPs, i.e. on their time duration as defined inS1 Text. However, as shown inS2 Figwe could not find any statistical differences between stimulation epoch and pre/post stimulation
Fig 2. The same driver LC cell upon different stimulations can enhance or depress the population activity. The left column (x.E) refers to
experimental measurements taken in slices of entorhinal cortex, while the right column (x.S) to the numerical results. Panels are similar toFig 1but reporting the case in which the network acceleration (a-c.E and a-c.S) and slowing down (d-f.E and d-f.S) are observable by stimulating the same neuron at different frequencies. The experiment and the simulation refer to neurons with zero functional out-degree. Experiment. Panels (a-c.E) ((d-f.E)) are obtained withνS= 0.33 Hz (νS= 1.0 Hz). Namely, the average IGI varied from 6.08 s in control conditions to 5.14 s during stimulation with
νS= 0.33 Hz, and from 5.36 s to 6.68 s withνS= 1.0 Hz. Model. All the panels refer to the driver LC cellel3connected in output to theel1neuron
discussed in panels (b-d.E) inFig 1. The results refer to the stimulation of the same neuron with two different currents, namely panels (a-c.S) refer to
Istim= 15.42 mV and (d-f.S) to currentIstim= 15.9 mV.
periods (seeS1 Textfor details). This doesn’t mean that other more subtle features of the GDPs could not be impacted by manipulating single neurons, but probably these modifica-tions could be hardly discernible in view of the limited time resolution associated to calcium imaging.
Numerical evidences of driver LC cells
In order to mimic the impact of single neurons on the collective dynamics of a neural circuit, we considered a directed random network made ofN LIF neurons [34,35] composed of excit-atory and inhibitory cells and with synapses regulated by short-term synapticdepression and facilitation, analogously to the model introduced by Tsodyks-Uziel-Markram (TUM) [36]. In particular, synaptic depression was present in all the connections, while facilitation only in the connections targeting inhibitory neurons. This in agreement with recent experimental investi-gations of Layer II of the medial enthorinal cortex reporting evidences of short-term synaptic depression among excitatory neurons (namely, stellate and pyramidal cells) as well as among fast-spiking interneurons and pyramidal cells and of short-term facilitation in the connections from stellate cells towards low-threshold-spiking interneurons [37] (seeMethodsfor more details).
As shown in [36,38,39], these networks exhibit a dynamical behavior characterized by an alternance of short periods of quasi-synchronous firing (PBs) and long time intervals of asyn-chronous firing, thus resembling cortical GDPs’ occurrence in early stage networks. Similarly to the modeling reported in [12], we considered neuronal intrinsic excitabilities negatively cor-related with the total connectivity (in-degree plus out-degree) (for more details seeDefinition of the Model inMethodsandS4 Fig). The introduction of these correlations was performed to mimic developing networks, where both mature and young neurons are present at the same time associated to a variability of the structural connectivities and of the intrinsic excitabilities. Experimental evidences point out that younger cells have a more pronounced excitability, most likely due to the fact that their GABAergic inputs are still excitatory [40–42], while mature cells exhibit a higher number of synaptic inputs and they do receive inhibitory or shunting GABAergic inputs [17,43]. The presence of inhibition and facilitation are the major differences from the model developed in [12] to simulate the dynamics of hippocampal circuits in the early stage of development, justified by the possible presence of mature GABAergic cells in the network.
Using this network model, we studied the effect of single neuron current injectionIstimon network dynamics, thus altering the average firing frequency of the neuron during the stimula-tion time, similarly to what done in the experiments. In the numerical investigastimula-tions, at vari-ance with the experiments, the stimulation delivered to the neurons is an unique supra-threshold step of duration of 48 seconds. InFig 1two representative driver LC cells are reported for comparison with the experiments. The first cell (panels (b-d.S) ofFig 1) was a silent neuron in control conditions (therefore withDO= 0), that once stimulated could enhance of ’ 30% the PB emission, thus leading to a decrease of the instantaneous phase F with respect to control condition. Panels (e-g.S) refer to a second neuron characterized by a low functional output connectivity, namelyDO= 3%, whose stimulation led to a depression in the PB frequency (as shown in panels (e.S) and (f.S)) joined to an increase of the instantaneous phase of the network events with respect to control conditions (as shown in panel (g.S)). These results compare quite well with the experimental findings reported in the same figure.
Furthermore, analogously to what found in the experiment,Fig 2(a)–2(f.S)shows a silent neuron in control condition that once stimulated could lead to both enhancement or depres-sion of the population activity depending on the level of injected current during stimulation.
A full characterization of the network model concerning the impact on the network dynam-ics of each single neuron stimulation in relation to neuronal type, current injected and func-tional connectivity is detailed below.
Impact of single neuron stimulation and deletion on network dynamics
In order to explore the full dynamical range associated to the impact of single neuron stimula-tion on the network dynamics, we examined the response of the model network to two types of single neuron perturbations, i.e.single neuron deletion (SND) and single neuron stimulation
(SNS) by employing the protocols introduced in [12]. In particular, the SND experiment con-sisted in recording the activity of the network in a fixed time intervalΔt = 84 s when the con-sidered neuron was removed from the network itself. While, the stimulation of the single neuron (SNS) was performed with a step of DC current of amplitudeIstimfor a time window
Δt = 84 s. The recording of the activity in control condition was lasting 84 s as well, in order to
compare directly the number of observed PBs during control and perturbation period. In par-ticular, we tested the response of the network to a broad range of stimulation amplitudes vary-ing from 14.5 mV (slightly below the firvary-ing threshold for an isolated neuronVth= 15 mV, see
Methods) to 18.0 mV with a step of 0.015 mV, inducing in the stimulated neuron a maximal firing frequency of ’70 Hz. Typically the stimulated neuron fired with a frequency much higher than the frequency of neurons under control conditions (i.e. in absence of any pertur-bation). As an example, for a stimulation currentIstim= 15.90 mV the targeted neuron fired at a frequencyν ’ 32 − 36 Hz well above the average (’3 Hz) and the maximal (22 Hz) frequency
of all neurons in control conditions. The SND represented an extreme version of the SNS, where the neuronal removal corresponded to the injection of an hyperpolarizing current inhibiting the neurons from firing spontaneously or in response to any synaptic input.
In both SNS and SND experiments the impact of single neuron perturbation on the collec-tive dynamics was measured by the variation of the PB frequency relacollec-tive to control condi-tions. In general, we have classified a neuron as a driver cell whenever upon stimulation it is able to modify the PB frequency of at least 50% with respect to control conditions. In the spe-cific, in analogy to what done in [24], for SNS experiments we considered both enhancement and decrease in the PB activity. On the other hand, SND allowed us to directly identify the driver neurons which are fundamental for the PB build-up. Therefore in this case we limited to consider those cells whose SND led to a population decrease of at least 50%. The choice of this threshold is based on the analysis of the distribution of the number of PBs delivered dur-ing SNS and SND experiments compared to the PB variability observed in control conditions. This was preliminarily measured by considering the average and the standard deviation of the number of population bursts obtained by considering for each network realization 100 differ-ent initial conditions over a time window of 84 s. As we were interested in strong impact on the network dynamics, we decided to consider as significant the variations of the population activity which were well beyond the statistical fluctuations in the population bursting mea-sured by three standard deviations. The choice of 50% fulfilled this condition in all the ana-lyzed networks.
Fig 3(a) and 3(b)report a comparison of the impact of SND and SNS (with representative injected current of 15.90 mV) on the PB activity. The removal of any of the four neurons labeled asih1,eh1,eh2,eh3was able to arrest completely the bursting dynamics within the
con-sidered time window, while in other two cases (for neuronsih2andeh4) the activity was
reduced of 60% with respect to the one in control conditions. For clarity, the used labelsi/e
stand for inhibitory/excitatory andh for hub, as we will show later this is related to the
non relevant modification in the number of emitted PBs, within the variability of the bursting activity in control conditions (Fig 3(a)).
The SNS confirmed that the neuronsih1,eh1,eh2,eh3were capable to arrest the collective
dynamics. Neuronseh4andih2poorly impacted PB dynamics for the reported injected
cur-rent, although for different values ofIstimthey were able to strongly influence the network dynamics (as shown in the subsectionTuning of PBs frequency upon hubs’ and driver LC cells’ stimulations). At variance from what found in a purely excitatory network [12], the SNS revealed also the presence of other 18 driver cells not identified by the SND capable to impact the occurence of PBs in the network (Fig 3(b)).
Fig 3. Model—Network response to single neuron stimulation. (a-b) Response of the network to SND and SNS, respectively. These panels report the
number of PBs, recorded during SND (SNS) experiments versus the labels of the removed (stimulated) neuron, ordered accordingly to their average firing ratesν under control conditions (shown in panel (c)). Inhibitory neurons are marked with asterisks. In this representative SNS experiment each
neuron was stimulated with a DC stepIstim= 15.90 mV for a time intervalΔt = 84 s. The central horizontal dashed line shows the average number of PBs emitted in control conditions within an intervalΔt = 84 s, while the lower and upper horizontal dashed lines mark the 50% variation. The vertical dashed line separates firing neurons (on the right side) from silent neurons (on the left side) in control conditions. (d) Raster plot of the network activity. (e) Close ups of population bursts representative of the two principal routes (i.e the firing sequence of hub cells): an instance of the main route is reported in the left panel, while the second most frequent route is displayed in the right panel. Note that neurons are labeled accordingly to their index and are not ordered as in panels (a-c). (f) Scatter plot showing the functional out degreeDOof the neurons versus their total structural degreeKT. A double square marks two neurons with overlapping properties. (g) Sketch of the structural connections among driver hub neurons and driver LC1 cells, the large rectangle highlights the clique of the hub cells. In all the panels, circles (squares) denote driver hub (LC) cells, while the green (red) symbols refer to inhibitory (excitatory) driver cells.
For an equivalent random network, without any imposed correlation, SNS or SND affected the dynamics in a neglibile way producing a maximal variation of the bursting activity of 25-30% with respect to the control conditions (seeS5(a) and S5(b) Fig).
To summarize, the presence of correlations among the neuronal intrinsic excitabilities and the corresponding structural connectivities was crucial to render the network sensible to single neuron manipulation. Differently from purely excitatory networks where SNS and SND exper-iments gave similar results, the inclusion of inhibitory neurons in the network promoted a larger portion of neurons to the role of drivers, and their properties will be investigated in the following.
Connectivity and excitability of the driver cells
The role played by the neurons in the simulated network was elucidated by performing a directed functional connectivity (FC) analysis. In the case of the spiking network model, in order to focus on the dynamics underlying the PB build-up, the FC analysis was based on the first spike fired by each neuron in correspondence of the PBs. An equivalent information was provided in the analysis of the EC by considering the calcium signal onset to calculate the directed functional connectivity. The six neurons playing a key role in the generation of the PBs (eh1−4,ih1−2) were characterized by high values of functional out-degree, namely with an
average functional degreeDO= 68%± 8%, ranking them among the 16 neurons with the high-est functional degree. Given the high functional out-degree and their fundamental role in the generation of the PBs (as shown by the SND inFig 3(a)), we identified these neurons asdriver hub cells. The high value of DOreflected their early activation in the PB, thus preceding the activation of the majority of the other neurons.
Next, we examined the structural degree of the neurons, specifically we considered the total structural degreeKT, which is the sum of the in-degree and out-degree of the considered cell. As shown inFig 3(f), we observed an anti-correlation amongDOandKTwhere neurons with high functional connectivity are typically less structurally connected than LC neurons. This was particularly true for the six driver hubs, previously examined, since they were character-ized by an averageKT= 15± 3, well below the average structural connectivity of the neurons in the network (’ 20).
Concerning the excitability, the six driver hubs despite being in proximity of the firing threshold (slightly above or below) as shown inS6(a) Fig, they were among the 25% fastest spiking neurons in control condition, (as shown inFig 3(c)). In particular, the three neurons
eh1,eh2,ih2were supra-threshold, while neuronseh3,eh4,ih1were slightly below the threshold.
When embedded in the network their firing activity was modified, in particular three couples of neurons with similar firing rates can be identified, namely (eh1,ih1), (ih2,eh2) and (eh3,eh4),
as reported inTable 1. The direct structural connections present among these couples (see also
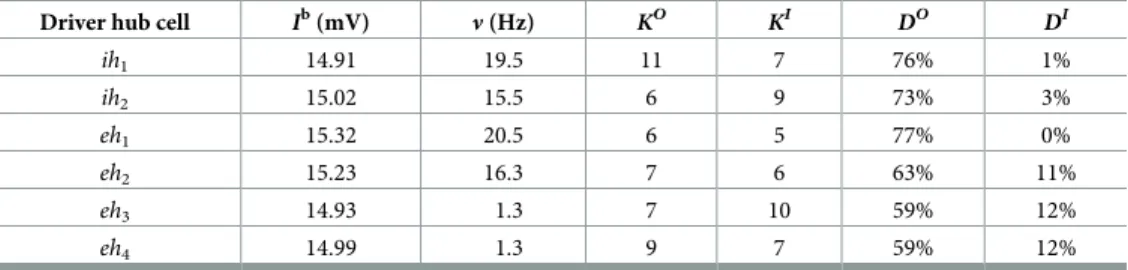
Table 1. Properties of driver hub cells in control condition. For each driver hub cell (ih1,ih2,eh1,eh2,eh3,eh4) the
columns report the intrinsic excitability (Ib), the average spiking frequency in control conditions (
ν), the structural
out-degree (KO) and in-degree (KI), the functional out-degree (DO) and in-degree (DI).
Driver hub cell Ib(mV) ν (Hz) KO KI DO DI
ih1 14.91 19.5 11 7 76% 1% ih2 15.02 15.5 6 9 73% 3% eh1 15.32 20.5 6 5 77% 0% eh2 15.23 16.3 7 6 63% 11% eh3 14.93 1.3 7 10 59% 12% eh4 14.99 1.3 9 7 59% 12% https://doi.org/10.1371/journal.pcbi.1006551.t001
Fig 3(g)) could explain the observed firing entrainments, as discussed in details in the next subsection. When compared to the other hub neurons, the much lower activity of (eh3,eh4),
corresponding to twice the average frequency of the PBs in control condition, was related to the fact that these two neurons fired only in correspondence of the ignition of collective events like PBs andaborted bursts (ABs), the latter being associated to an enhancement of the
net-work activity but well below the threshold we fixed to detect PBs. This will become evident from the discussion reported in the subsectionSynaptic resources and population bursts.
As already mentioned, besides the six driver hubs, the SNS experiments revealed the exis-tence of a different set of 18 drivers, whose activation also impacted the population dynamics, although they had no influence when removed from the network and therefore they were not relevant for the PBs build up. These neurons represented inFig 3with squares were character-ized by a low FC, namelyD0= 13%± 15%. Therefore, we have termed them driver LC cells rep-resenting the ones which reproduced the behaviour of the driver LC cells identified in the EC (see Figs1and2and reference [24]). In the following we will refer to them asel. . .oril1
accord-ing to the fact that they are excitatory or inhibitory neurons, respectively (note that only one LC driver was inhibitory). As shown inFig 3(c), LC drivers were not particularly active (with firing frequencies below 1 Hz in control conditions) and in some cases they were even silent. Notably, under current stimulation they could in several cases arrest PBs or strongly reduce/ increase the activity with respect to control conditions as shown inFig 3(b)for a specific level of current injection and also as discussed in detail in the following sections.
Compared to the driver hubs, driver LC cells had a lower degree of excitability (essentially they were all sub-threshold, seeS6(a) Fig), which resulted in a later recruitment in the synchro-nization build up, and as a consequence in a lower functional out-degree. Therefore, driver LC cells were not necessary for the generation of the PBs, playing the role of followers in the spon-taneous network synchronizations. As shown inFig 3(f), driver LC neurons were charaterized by a higher structural connectivity degreeKTwith respect to driver hubs, namelyKT= 23± 3,
and the most part of them were structurally targeting the driver hubs either directly (i.e. path length one) or via a LC driver (i.e. path length two, centered on a LC driver). InFig 3(f), the two groups of drivers, hubs and LC cells, can be easily identified as two disjoint groups in the plane (KT,D0
). These results indicated that driver hubs are not structural hubs, while the low functional connectivity neurons are promoted to their role of drivers due to their structural connections. This latter aspect will be exhaustively addressed in subsectionTuning of PBs fre-quency upon hubs’ and LC cells’s stimulation.
Generality of the results. With the purpose of demonstrating that the results reported
here are generic, and not due to a fine tuning of the parameters of the model, we have analyzed fifteen different realizations of the network. In particular, we used the same distributions for the intrinsic excitabilities, synaptic parameters and structural connectivities. The parameter values were taken from random distributions with the same averages and standard deviations as defined inDefinition of the model in Methods. Furthermore, in all the numerical
experi-ments we kept fixed the size of the network (N = 100), the number of excitatory/inhibitory
neurons (Ne= 90,Ni= 10), the average in-degree, and all the other constraints specified in Def-inition of the model in Methods. In six networks we found no bursting dynamics or number of
bursts too small to be significant. While, in the remaining nine network PBs were always pres-ent and we could perform significant SND/SNS experimpres-ents on all the neurons in each net-work. This analysis allowed us to identify driver hub cells and driver LC cells in all these networks, with characteristics similar to the ones found in the network analysed in detail in the paper. In particular, we have identified for each network a number of hub cells ranging from two to eight with an average value 5± 2, and a number of LC cells ranging from 1 to 27 with an average value 12± 9 (apart a peculiar single network where we found just one hub and
one LC cell). By examining the nine networks displaying bursting dynamics we found the pres-ence of inhibitory cells among the hubs in three cases and among the driver LC cells in six cases (with numbers ranging from one to four). As general features, we observed that driver hub cells were characterized by a high intrinsic excitability and a low structural connectivity: namely,Ibwas in the range [14.55: 15.42] mV (with average 15.0± 0.2 mV and ’ 37% of the hubs supra-threshold), while the total connectivityKTwas in the range [6: 31] (with average 16± 3 and a single hub with KT= 31). On the other hand, the LC drivers were characterized by a low intrinsic excitability in the range [14.55: 15.03] mV (with average 14.7± 0.1 mV and ’ 99% of the LC cells below the firing threshold) and by a highKTin the range [14: 32] (with average 22± 4 and a single driver LC cell with KT= 14).
It is important to stress that in [12], for a model similar to the one here studied, it has been shown that the population dynamics as well as the sensitivity to SNS/SND are robust to wide variation in several parameters controlling the network design as well as the synaptic dynamics.
Functional clique of excitatory and inhibitory neurons
In order to deepen the temporal relationship among neural firings leading to a PB, we exam-ined the spikes emitted in a time window of 70 ms preceding the peak of synchronous activa-tion (seeMethodsfor details). The cross correlations between the timing of the first spike emitted by each driver hub neuron during the PB build up are shown inS7 Fig(Upper Sequence of Panels). The cross correlation analysis demonstrated that the sequence of activa-tion of the neurons waseh1!ih1!ih2!eh2!eh3!eh4. The labeling previously assigned
to these neurons reflected such an order. A common characteristic of these cells was that they had a really low functional in-degreeDIas reported inTable 1indicating that they were among the first to fire during the PB build-up. In particular,eh1had a functional in-degreeDI
zero, revealing that it was indeed the firing of this neuron to initialize all the bursts and there-fore it could be considered as theleader of the clique.
A detailed inspection of the firing times, going beyond the first spike event, revealed the existence of more than one firing sequence leading to the collective neuronal activation: i.e. the existence of different routes to PBs. This is at variance with what found in [12] for a purely excitatory network, where only one route was present and all the PBs were preceded by the same ordered sequential activation of the most critical neurons. In particular, the neuroneh1
fired twice before the PBs (seeFig 3(e)), usually in-between the firing ofeh2and that of the
pair (eh3,eh4), and this represents the main route, occurring for ’ 85% of the PBs. Along the
second route (present only for the ’ 7% of the PBs),eh1was firing the second time at the end
of the sequence. The neuroneh1fired essentially by following its natural period T1¼ tmln ½ðI
b
eh1 vrÞ=ðI
b
eh1 VthÞ� ¼ 52:15ms, and its second occurrence in the firing
sequence depended on the delay among the firing of the other neurons. As a matter of fact we verified that the elimination of the second spike emitted byeh1from the network dynamics
didn’t prevent, and didn’t delay, the onset of the PB and had only a marginal effect on the fir-ing of a very limited number of neurons in the PB. Therefore we can conclude that it is not essential to the PB build up. The two routes leading to the PB build-up are shown inFig 3(e).
To observe a PB the six driver hubs should fire not only in an ordered sequence, as shown inFig 3(e), but also with defined time delays, their average values with the associated standard deviations are reported inS1 Tablefor the two principal routes. These results clearly indicate that the six driver hubs are arranged in afunctional clique whose activation was crucial for the
PB build-up. In the period between the occurence of two PBs, the driver hubs in the clique could be active, but in that case they did not show the precise sequential activation associated
to the main and secondary route, see the out-of-burst results reported in the Lower Sequence of Panels inS7 Fig. A remarkable exception is represented by the case of the ABs, in that case PBs are not triggered despite the presence of the right temporal activation of all the hubs in the clique, due to the lack of synaptic resources (as discussed in details in subsectionSynaptic resources for population bursts). Out of PBs and ABs, we registered clear time-lagged
correla-tions only for those neuronal pairs sharing direct structural conneccorrela-tions (shown inFig 3(g)): namely,eh1!ih1,ih2!eh2andeh2! (eh3,eh4). The firing delays of these neuronal pairs
were not particularly altered also out of burst with respect to those measured during the burst build-up and reported inS1 Table.
As shown inFig 3(g), theeh3neuron represented the cornerstone of the clique, receiving
the inhibitory input coming from the structural pair (eh1,ih1) and the excitatory one from the
pair (ih2,eh2), with the activity of the neurons within each pair perfectly frequency locked.
More specifically,eh1entrained the activity ofih1(below threshold in isolation) so that both
neurons before a PB fired with a period quite similar to the natural period ofeh1. The other
pair (ih2,eh2) was controlled by the inhibitory action ofih2that slowed down the activity of eh2, whose natural period was 60.6 ms, while before a PBih2andeh2both fired with a slower
period, namely 72± 2 ms.
As it will be explained in details in the next two subsections, the two requirements to be ful-filled for the emergence of PBs are the availability of sufficient synaptic resources at neurons
eh3andeh4and the coordinated activation ofeh1(andih1) with the pair (ih2,eh2), in the
absence of any synaptic connection between the two pairs.
Synaptic resources for population bursts
Next we analyzed the relation between the evolution of synaptic resources in the hub driver cells and the onset of the PB. The availability of synaptic resources was measured by the effec-tive efferent synaptic strengthXOUTas defined inEq (8). In particular, we considered the avail-able resources only for the hub neuronseh3andeh4which were the last neurons of the clique
to fire before the PB ignition. We have examined only these two hub neurons, because when-evereh3andeh4fired, a burst or an AB was always delivered.
Neuronseh3,eh4were receiving high frequency excitatory inputs fromeh2(although the
natural firing ofeh2was slowed down by the incoming inhibition ofih2) and high frequency
inhibitory inputs fromih1(entrained by theeh1, the neuron with highest firing frequency in
the network). This competitive synaptic inputs resulted in a rare activation ofeh3compared to
the higher frequency of excitatory inputs arriving fromeh2. The period of occurrence of the
ABs was comparable to the average interval between PBs (namely,TPB= 1.4±1.0 s) and ABs
were preceded by the sequential activations of the six critical neurons of the clique in the cor-rect order and with the required delays to ignite a PB. The number of observed ABs was 66% of the PBs, thus explaining why the average firing period ofeh3andeh4was
Teh3 ¼ 0:8s ’ TPB=ð1 þ 0:66Þ, since their firing always triggered a PB or an AB.
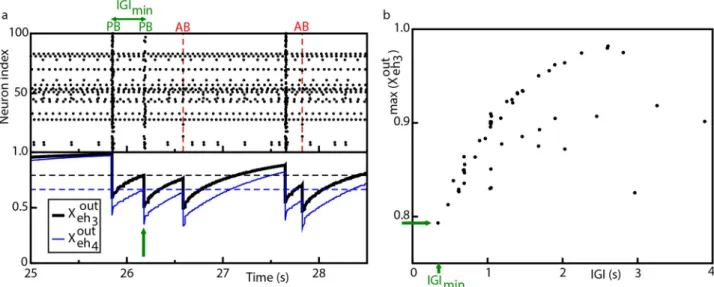
To understand why in the case of ABs the sequential activation of the neurons of the clique did not lead to a PB ignition, we examined the value of synaptic resources for regular and aborted bursts, as shown inFig 4(a). From the figure it is clear thatXOUT
eh3 andX
OUT eh4 should
reach a sufficiently high value in order to observe a PB, otherwise one had an AB. Further-more, the value reached byXOUT
eh3 andX
OUT
eh4 was related to the time passed from the last
collec-tive event and thus the requirement of a minimal value of the synaptic resources to observe a PB set a minimal value for the IGI, i.e. the interval between two PBs. As a matter of fact, as shown inFig 4(b)theIGI values grew almost linearly with the values reached by XOUT
before the PB, at least forXOUT
eh3 < 0:9. At larger values the relationship was no more linear and
a saturation was observable, due to the fact thatXOUT
eh3 could not overcome one.
We could conclude that the slow firing of the couple (eh3,eh4), moderate by the inhibitory
action ofih1oneh3, was essential to ignite a PB, since a faster activity would not leave to the
synapses the time to reach the minimal value required for a PB ignition, namelyXout�
eh3 ¼ 0:793
andXout�
eh4 ¼ 0:666. This could be better understood by reconsidering the SND experiment on
ih1, as expected the resection of neuronih1from the network led to a much higher activity of
neuronseh3andeh4, as shown inS8 Fig. However, this was not leading to the emission of any
PBs, because in this case the value ofXOUT eh3 andX
OUT
eh4 remained always well below the value
required for a PB ignition.
Moreover, also among the network synchronization events classified as PBs we observed a variability in the number of neurons taking part to a PB. A detailed analysis reported inS3 Textreveals that at least two kind of events can be identified: one which sees the contribution of almost all the active neurons and another one where the participation is more limited (see S9 Fig). These results resemble the ones reported experimentally for the EC in [24]. Further-more, the analysis shows a clear correlation between the available synaptic resources of the drivers controlling the population activity and the entity of the observed PBs.
Tuning of PBs frequency upon hubs’ and LC cells’ stimulation
In order to better understand the role played by the hub and LC drivers for the collective dynamics of the network, we performed SNS experiments for a wide range of stimulation cur-rents. The results of this analysis for currents in the range 14.5 mV �Istim� 18 mV are shown inFig 5(where all the driver hubs and six representative cases of driver LC cells are reported) and inFig 6(a). The driver hub neurons could, upon SNS, usually lead to a reduction, or
Fig 4. Model—Population bursts and synaptic resources. (a) Top panel: raster plot of the network activity, where population bursts (PBs) and aborted
bursts (ABs) are shown. The vertical (red) dashed lines signal the occurrence of aborted burst. Bottom panel: average synaptic strength of the efferent connections of the two hub neuronseh3,eh4in control conditions; the output effective synaptic strength is measured by the average value of the fraction
XOUT
eh3 (thik black line),X
OUT
eh4 (thin blue line) of the synaptic transmitters in the recovered state associated to the efferent synapses. The dashed horizontal
lines signals the values of the local maxima ofXOUT
eh3 (black line,X out� eh3 ¼ 0:793) andX OUT eh4 (blue line,X out�
eh4 ¼ 0:666) corresponding to the occurrence of
the shortest IGI, IGImin. (b) Values of the local maxima ofXehOUT3 (maxðX
OUT
eh3 Þ) in correspondence of the latest IGI. In both the figures the (green) arrow
marks the occurrence of IGImin.
silencing, of PBs, apart for two cells (namely,eh1andeh4) which, for specific stimulation
cur-rents, could even enhance the population activity. On the other hand, the 18 driver LC cells can be divided in two classes LC1 and LC2 according to their influence on the network dynam-ics upon SNS: a first group of 14 driver LC1 cells able mainly to reduce/stop the collective
Fig 5. Model—PBs frequency is tuned by current stimulation of driver cells. The plots report the number of PBs emitted during SNS of the hub
neuronseh1,eh2,eh3,eh4,ih1,ih2(a-f) as well as of the driver LC cellsil1,el1,el2,el3,el4,el7(g-l) for a wide range of the stimulation currentIstim(over a
time intervalΔt = 84 s). The blue vertical dashed lines, resp. the horizontal magenta solid line, refer to the value of the intrinsic excitability, resp. to the bursting activity, when the network is in control condition. The threshold value of the current is set toVth= 15 mV.
activity, and in few cases to increase the PB frequency, and a group of 4 LC2 neurons capable only to enhance the PB frequency. The three neuronsel1,el2andel3, previously considered in
subsectionNumerical evidences of driver LC cells for comparison with experimentally
identi-fied LC cells, belonged to the class LC1 (see Figs1and2), while we have no experimental examples of LC2 cells.
For what concerns the driver hubs’ dynamics, PBs were generated in the network whenever the hubseh2andih1, both structurally connected toeh3, were stimulated with currents smaller
than the excitabilityIb
eh1of the leader of the clique and within a specific interval (seeFig 5(b)
and 5(e)). This means that in order to have a PB both neurons controllingeh3should not fire
faster than the leader of the clique. If this was not the case, the inhibition (originating fromih1)
would not be anymore sufficient to balance the excitation (carried byeh2) or viceversa, thus
leadingeh3to operate outside the narrow current window where it should be located to
pro-mote collective activity (seeFig 5(c)). In the case ofih2andeh4the SNS produced a less
pro-nounced impact on the PB activity, their stimulation could never silence the network (as shown inFig 5(d) and 5(f)), apart in two narrow stimulation windows forih2. This is in
agree-ment with what reported inFig 3(a)for the SND, since the removal of neuronseh4andih2
only reduced the occurrence of PBs of ’ 60%.
Fig 6. Model—Response to SNS of the driver cells. (a) Quantification of the response to SNS for each of the driver cells, sorted in three groups,
respectively hubs, LC1 and LC2. The heatmap displays how many times the SNS over a wide range of currents (namely, 14.5 mV �Istim� 18 mV)
induced a given number of PBs (x-axis) in the network. To facilitate the visualization, each row of the heatmap has been smoothed with a gaussian function of 1.58 standard deviation and unitary area. The red vertical lines denote the limits of activity in control condition: one standard deviation around the average. Model—Current stimulation of driver LC cells can modify the functional clique of the network. The panels (b),(c) refer to driver LC1 cellel1(seeFig 1(b.S)–1(d.S)). In the top panel (b) the configuration of the functional clique is reported for some sample stimulation current
Istimofel1. Full circles, resp. open squares, signal the presence, resp. absence, of the corresponding neuron of the functional cliqueih1,ih2,eh1,eh2,eh3,
eh4, while the open (red) circles indicate the presence of new neuronsNH in the functional clique (the number of new neurons is reported inside the
red circles). In the bottom panel (c) it is shown the number of PBs emitted by the network (black line with dots and left y-axis) and the firing frequency
ν of the LC cell (green line and right y-axis) during the current stimulation. The vertical (magenta) line marks the threshold value, Vth, while the vertical (blue) dashed line signals the intrinsic excitability of the LC cell in control condition.
LC drivers impact hub neurons. The SNS of LC1 drivers could induce, in 10 cases over
14 identified LC1 cells, a complete silencing in the network. A peculiar feature of eight out of these ten cases was that the PBs were completely suppressed as soon as these LC1 driver were brought supra-threshold: two examples are reported inFig 5(g) and 5(i). The first example in Fig 5(g)refers to the unique inhibitory driver LC cell we have identified, namelyil1, which was
directly connected to the hub neuroneh3(as shown inFig 3(g)). A stimulation ofil1led to a
decrease of the activity ofeh3and as a direct consequence of the PB activity.Fig 5(i)is devoted
toel2, previously examined in SectionNumerical evidences of driver LC cells and reported in
Fig 1(e.S)–1(g.S). The depressive effect on the network activity due to the stimulation ofel2,
could be straightforwardly explained by the fact thatel2is directly connected to the inhibitory
LC cellil1and to the inhibitory driver hubih1, thus performing an effective inhibitory action
on the network, even if the stimulated driverel2was excitatory. For the other six excitatory
LC1 drivers acting onil1only in two cases the PBs could not be completely blocked, and this
happened when the cells were also directly connected to the driver hubeh3. In the two cases of
driver LC1 cells able to block the population activity, but not acting throughil1, these cells
were exciting eithereh1orih1, both belonging to the path with an inhibitory effect oneh3. The
four remaining LC1 drivers that were able to reduce, but not to completely silence the popula-tion activity, acted either througheh4(which was unable to block the PBs, even upon SND) or
by simultaneously exciting and inhibitingeh3.
It should be remarked that nine of the previously discussed LC1 drivers could either enhance or reduce the PBs for different values ofIstim. The double action of these neurons is exemplified by the two examples reported inFig 5(h) and 5(j), which refer to neuronel1and el3, already examined in connection with experimental data inFig 1(b.S)–1(d.S)and inFig 2(a.
S)–2(f.S), respectively.
The neuronel1was structurally connected to the inhibitory hub cellih1,el1was silent in
control condition and once stimulated with a currentIstim= 15.135 mV was able to enhance population dynamics as shown inFig 1(b.S)–1(d.S). However, depending on the stimulation current it could even completely silence the PB activity, as shown inFig 5(h). In order to understand in deeper details the mechanisms underlying both the enhancement and suppres-sion of PBs, we stimulatedel1withIstim2 [14.5: 16] mV and for each value of the stimulation
current we performed SND of the all neurons in the network. These analyses were aimed at identifying (for each value ofIstim) the driver hub cells involved in the PB generation, i.e the neurons that upon SND reduced the population activity at least or more than 50%. The results of these experiments are shown inFig 6(b) and 6(c), for sufficiently low stimulation currents (even above threshold) the activity ofel1had no influence at a network level, and this is
consis-tent with the response ofih1upon SNS reported inFig 5(e). However for higher stimulation
current the clique of functional hubs is modified by the action ofel1: not all the hub cells
previ-ously identified remained relevant for the network activity and in some cases some new driver hubs was identified, as reported inFig 6(b). The most significant modification is that the neu-roneh1was no more relevant (in most cases) for the PB generation, and this could be
explained by the fact that the inhibitory hubih1is now controlled directly byel1. This is further
confirmed by the fact that when the stimulation became sufficiently large the collective dynam-ics was completely silenced due to the high activity ofih1. As a matter of fact, some lower
activ-ity in the network could be restored for even larger current values aboveIstim
’ 15.65 mV. This effect can be explained in terms of the prevalence of facilitation over depression in the synapse connectingel1withih1, as discussed inS5 Textand inS12 Fig. Furthermore, at these
large stimulation currents one can observe also modified functional cliques.
The LC1 driverel3had also a double action leading to enhancement or depression of the
architecture:el3was structurally connected, via the bridge neuronel1, toih1, whose impact
on the network was to arrest the bursting apart a very narrow range of stimulation currents (Fig 5(e));el3was also structurally connected toeh4, which in some ranges of stimulation
cur-rents could enhance network dynamics (Fig 5(d)).
To conclude the analysis of the driver cells, we consider LC2 cells. These were excitatory neurons characterized by a lowIb(below the firing thresholdVth) and, given the imposed
cor-relation in the network model, by a high global structural connectivity (seeS4 Fig). In control conditions these neurons were not active and did not participate to PBs. Two examples of the SNS of these neurons are reported inFig 5(k) and 5(l)for LC2 driversel4andel7. Whenever
they were stimulated above threshold they induced a sharp increase in the PB activity in the order of 50%. Furthermore, in the case of LC2 drivers the SNS led in general to a more regular bursting dynamics, characterized by a smaller average Inter GDP Interval (of the order of the recovery time for the synapses, seeMethodsfor details) and a smaller standard deviation (i.e. forel7we measured <IGI > = 0.9 ± 0.6 s for Istim= 15.9 mV) with respect to control conditions
(where <IGI > = 1.4 ± 1.0 s). When LC2 cells were current stimulated, the action of
enhance-ment of PBs activity was not mediated by the impact on other driver cells. As shown inS10 Fig, while the stimulation of LC1 drivers led to a noticeable modification of the firing rates of the hub cells, the SNS of driver LC2 cells had essentially no influence on the hubs. Therefore due to their high structural out-degree we can safely affirm that their influence on the network dynamics should be related to a cooperative excitatory effect. As a matter of fact, during the SNS of driver LC2 cells we observed the disappearence of ABs and as a consequence Inter GDP Interval become more regular, thus leading to an enhancement of the population activity. In particular, the disappearence of ABs was due to the fact that whenevereh3was firing, a
burst was emitted due to the presence of a higher level of excitation in the network, even when the synaptic resources ofeh3were below the minimal value required in control conditions, as
discussed in the subsectionSynaptic resources and population bursts.
Discussion
We have developed a simple brain circuit model to mimic recent experimental results obtained in cortical slices of the mice Entorinhal Cortex during developmental stages [24]. These analy-sis revealed the existence of high and low functionally connected driver cells able to control the network dynamics. The fact that functional hubs can orchestrate the network dynamics is somehow expected [17,44], while the existence of driver neurons with low functional out-degrees has been revealed for the first time in [24]. In this paper, we focused mainly on the analysis of these latter class of drivers. which in control conditions were essentially irrelevant for the build-up of the GDPs. On the contrary, if single-handedly stimulated they could never-theless strongly modify the frequency of occurrence of GDPs, as evident from the experimental findings reported in Figs1(b)–1(g.E)and2(a)–2(f.E). In particular, their stimulation could lead both to an enhancement as well as to a reduction of the population activity (GDPs’ fre-quency). Quite remarkably, some of the driver LC cell were able to perform both these tasks as an effect of different stimulation frequencies as revealed by the experiment shown in Fig 2(a)–2(f.E).
Furthermore we have demonstrated that the experimental findings could be replicated in a simple spiking neural network model made of excitatory and inhibitory neurons with short-term synaptic plasticity and developmentally inspired correlations (see Figs1(b)–1(g.S)and 2(a)–2(f.S)). The analysis of the model has allowed to understand the fundamental mecha-nisms able to promote a single neuron to the role of network driver without being a functional hub, as usually expected.
In the model, all the driver neurons able to influence the network dynamics could be identi-fied and they could be distinguished in neuronal hubs characterized by high out-degree or low functionally connected drivers. Functional hubs are highly excitable excitatory and inhibitory neurons arranged in a clique, whose sequential activation triggered the Population Bursts (analogous to GDPs). This in agreement with recent experimental evidences that small neuro-nal groups of highly active neurons can impact and control cortical dynamics [7–10]. On the other hand, driver LC cells are characterized by a lower level of excitability, but a higher struc-tural connectivity with respect to driver hubs. Due to their low activity and functional connec-tivity in control conditions, these neurons were not fundamental for the PBs development, but were passively recruited during the burst, or even completely silent. The LC drivers can be divided in two classes LC1 and LC2 according to their influence on the population activity whenever stimulated with different values of DC current: the majority of them were able both to enhance and reduce (or even set to zero) the frequency of occurrence of the PBs (LC1), while a small group was able only to enhance the PBs’ frequency with respect to control condi-tions (LC2). Noticeably, driver LC1 cells were structurally connected to the hubs (directly or via a bridge LC cell). Therefore, whenever stimulated they can influence the network activity by acting on the clique dynamics. In most cases, even if these cells were excitatory, their action on the network was mainly depressive, since either they stimulated directly inhibitory hubs or the inhibitory LC1 driver, which acted as a bridge over the clique. In more than the 50% of the cases (8 over 14) whenever brought over threshold driver LC1 cells led to a complete arrest of the PB activity.
Driver LC2 cells instead were silent in control conditions and highly structurally connected, therefore they were putative structural hubs. As a matter of fact, whenever brought supra threshold they favoured a more regular collective dynamics. The activation of the many effer-ent connections of LC2 drivers led to the creation of many alternative pathways for the PB igniton, in a sort of homeostatic regulation of the network which led to an optimal employ of the synaptic resources [45] with the corresponding disappearence of the aborted bursts, largely present in control conditions.
Furthermore, we have shown that the stimulation of single driver LC cells was not only able to alter the collective activity but also to deeply modify the role of neurons in the network, such that some neurons can be promoted to the role of driver hubs or driver hubs can even lose their role (seeFig 6(b) and 6(c)). At variance with purely excitatory networks [12], the syn-chronized dynamics of the present network, composed of excitatory and inhibitory neurons, is less vulnerable to targeted attacks to the hubs [46,47]. As demonstrated by the fact that differ-ent firing sequences of hub neurons can lead to population burst ignitions (seeFig 3(e)) and that hubs can be easily substituted in their role by driver LC cells when properly stimulated. The robustness of the synchronized dynamics is confirmed by the fact that the presence of channel noise, up to quite large noise strength, does not substantially modify the composition neither of the functional clique nor of the LC drivers (for more details on the analysis seeS4 TextandS11 Fig).
The experimental analysis of the population activity in the EC has revealed the existence of two kind of synchronization events: global, where most of the neurons were involved, and local, where only a sub-group took part to the burst [24]. In our model we have shown a simi-lar effect that can be explained in terms of the available synaptic resources of the driver cells (for more details seeS3 TextandS9 Fig). It has been reported in different contexts [48,49] that the strength of the connectivity between neurons is a key variable defining neuronal ensemble dynamics. However, whether the mechanism that we have found to be at the basis of this variability could explain also the experimental findings in [24] is an interesting question
that cannot be answered with our experimental set-up, and that we leave open for future investigation.
Another relevant aspect is that the inclusion of inhibitory neurons in the network did not cause a trivial depressing action on the bursting activity, as it could be naively expected, but instead they can play an active role in the PB build-up. Our analysis clearly demonstrate that their presence among the driver cells is crucial in determining and controlling the PB activity, somehow similarly to what found in [20] where it has been shown that the emergence of sharp-wave in adult hippocampal slices was controlled by single perisomatic-targeting inter-neurons. We expect that the model described in this paper could also find application for other developing circuits, beyond EC, where inhibitory GABAergic synapses are also present.
Our results suggest that inhibitory neurons can have a major role in information encoding by rendering on one side the population dynamics more robust to perturbations of input sti-muli and on another side much richer in terms of possible repertoire of neuronal firings. These indications confirm the key role of inhibitory neurons in neural dynamics, already dem-onstrated for the generation of brain rhytms [50,51] and for attentional modulation [52].
Entorhinal cortex is involved in human mesial temporal lobe epilepsy [53]. A recent in vitro study on the onset of seizure-like events in EC slices [54] revealed fast-rising and sus-tained extracellular potassium increases associated to interneuronal network activity consis-tently preceding the initiation of seizures, supporting a key role of interneuron activity in the EC in focal seizure generation. There results are consistent with our observation that inhibi-tory neurons play a key role in the generation and orchestration of network synchronizations.
The main ingredient introduced in our model to mimic the developmental stage was an anti-correlation between intrinsic excitability and the synaptic connectivity inspired by homeostatic regulation mechanisms observed during neural development [32]. Interestingly a similar phenomenon co-regulating neuronal connectivity and excitability could possibly occur in adult circuits due to functional switches or functional losses (such as those following an injury). In such cases the prolonged absence of functional input in neurons could synergisti-cally lead to synaptic depletion and increased neural excitability. Therefore, massive pre-syn-aptic neural loss in adults circuits could as a consequence enhance the neural excitability of the post-synaptic targets [9], possibly upgrading the role of these cells to functional hubs with eventual pathological consequences as we could imagine in the case of epilepsy.
Recently there has been a renovated interest on the existence and role of neuronal cliques within the brain circuitries [13,55]. Cliques have been proposed as structural functional multi-scale computational units whose hierarchical organization can lead to increasingly complex and specialized brain functions and can ground memory formations [55]. In addition, activa-tion of neuronal cliques as in response to external stimuli or feedforward excitaactiva-tion can lead to a cascade of neuronal network synchronizations with distinct spatio-temporal profiles [13]. Our results provide a further understanding on how cliques can emerge (spontaneously during development) and modify (in response to stimuli similarly to the SNS here discussed) with a consequent reshaping of the spatio-temporal profile of the dynamics of the network in which the clique is embedded. Notably, it is the presence of inhibitory neurons within the network to favour the emergence of different cliques by empowering drivers with different functional con-nectivity degree. While driver functional hubs guarantee the functioning of the network syn-chronization in absence of stimuli (such as during development and in non-stimulated conditions), LC drivers widen the ability of the network to play distinct synchronization pro-files (i.e. spatio-temporal activations) possibly underlying emergent functions within the brain networks.
Finally, our results could be of some relevance also for the control of collective dynamics in complex networks [56,57]. Usually the controllability of complex networks is addressed with