Size, Site Fidelity, and Overlap of Home Ranges
and Core Areas in the Socially Monogamous Owl
Monkey (
Aotus azarae) of Northern Argentina
Flurina M. Wartmann&Cecilia P. Juárez&
Eduardo Fernandez-Duque
Received: 11 September 2013 / Accepted: 23 January 2014 / Published online: 6 April 2014 # Springer Science+Business Media New York 2014
Abstract In addition to environmental factors, social variables such as group size may play an important role in explaining primate ranging patterns. In this study we investigated range sizes, site fidelity, and range overlaps of owl monkeys (Aotus azarae) in Northern Argentina. We calculated the size of home range and core areas for 18 groups in our study area. For the six most intensively studied groups we tested whether precipitation as a crude proxy for food availability or group size had an influence on range size, assessed the degree of site fidelity by quantifying overlaps of annual ranges and core areas, and calculated the amount of range overlap between neighboring groups for each year. We used the kernel density estimation method to calculate home ranges as 90% kernel and core areas as 50% kernel. Home range size (mean ± SD) was 6.2 ha (± 1.8) and core area size 1.9 (± 0.6). Rainfall and group size were not statistically significant predictors of range sizes. Site fidelity was high, with a range overlap of 82% (± 11) between consecutive years. Neighboring groups overlap-ped over 48% (± 15) of the outer parts of their group ranges and 11% (± 15) of their core areas. We found no evidence that larger groups occupy larger areas than smaller groups, suggesting that food availability might be above a critical threshold for owl monkeys so that larger groups do not need to extend their foraging areas to meet their energy requirements. Our findings indicate that ranges remain stable over several years as groups visit the same locations of fruit trees within their range. We showed that owl monkeys exhibit a considerable degree of range overlap. However, we suggest that this range overlap might be spatial rather than temporal, which maximizes access to
DOI 10.1007/s10764-014-9771-7
F. M. Wartmann (*)
Department of Geography, University of Zurich, Winterthurerstrasse 190, CH-8057 Zurich, Switzerland e-mail: flurina.wartmann@geo.uzh.ch
C. P. Juárez
:
E. Fernandez-DuqueCECOAL-Conicet, C. P. 3400 Corrientes, Argentina E. Fernandez-Duque
clumped feeding resources in overlapping areas that are used at distinct times, while excluding other males from access to females in exclusively used areas.
Keywords Aotus azarae . Core area . Home range . Kernel density estimation . Site fidelity . Social monogamy . Territoriality
Introduction
Space use is an important aspect of primate behavior that is often described using the concepts of home range and core area. The home range is defined as “that area traversed by the individual in its normal activities of food gathering, mating, and caring for young” (Burt1943, p. 351), whereas the core area delineates areas more intensively visited within the overall home range (Boitani and Fuller 2000). Different factors influence space use among primates. Ranging is, for instance, directly linked to metabolic expenditure and body size (Clutton-Brock and Harvey1981; Dobson et al.
2010; Lehman et al. 2007; Milton and May 1976). In addition, the availability of different resources has also been shown to influence individual spatial behavior. Although the location of water or sleeping sites may affect the use of space (Zhou et al.2011), the diet and quality and distribution of food sources are usually considered the most important resources influencing patterns of ranging (Buzzard 2006). Generally, folivorous primates have smaller ranges as they exploit ubiquitous food resources, whereas frugivorous and insectivorous primates have comparatively larger ranges and longer daily travel distances to exploit unpredictable or patchily distributed resources (Clutton-Brock and Harvey1977b). When preferred food sources become scarce, primates exhibit dietary responses by increasing the amount of fallback foods in their diet and by reducing their daily traveled distances (Brockman and van Schaik
2005; Fernandez-Duque et al.2013; Zhang1995), which is subsequently reflected in changes in range size.
In many primate species, home range size is also related to group size, in line with the prediction that groups will expand their range when the number of individuals in a group increases if scramble competition is present (Clutton-Brock and Harvey1981; Isbell et al.1998; Watts1998). Thus, larger groups have been observed to expand their ranges when food is limited, to compensate for increasing competition with other group members (Clutton-Brock and Harvey 1977a; Dias and Strier 2003; Teichroeb and Sicotte 2009). This has, for example, been documented in vervets (Cercopithecus aethiops: Isbell et al.1998), mountain gorillas (Gorilla gorilla beringei: Watts1998), chimpanzees (Pan troglodytes: Herbinger et al. 2001), black-and-gold howlers (Alouatta caraya: Agostini et al.2010), and tufted capuchins (Cebus apella nigritus: Di Bitetti2001). However, in some primate taxa there seems to be no relationship, such as in the blue-eyed black lemur (Eulemur flavifrons: Sylviane et al.2011) and Thomas’s langur (Presbytis thomasi: Steenbeek and van Schaik2001).
Other factors that affect range use in group-living primates are the needs to defend mating partners, offspring, or food resources from neighboring groups (Fashing2001; Garber et al.1993; Lazaro-Perea2001). Territorial behavior is expected to evolve when resources are both limited and defendable (Mitani and Rodman1979). Defendability depends on the size of the overall range, the length of its boundary, detection distance,
and the ability of individual groups or subgroups to patrol the borders of a territory (Lowen and Dunbar 1994). Territorial behaviors in primates, such as vocalizations (Cowlishaw 1992), boundary controls (Mitani and Watts 2005), and aggressive en-counters with neighboring groups (Wilson et al.2001), are well documented, yet few studies have analyzed the spatial components of territoriality (Markham et al.2012; Williams et al.2002). Despite intergroup competition due to limiting factors, numerous species, including some territorial ones, show overlapping zones between the home ranges of neighboring groups (Biebouw2009; Sylviane et al.2011). These overlapping zones are generally underused (Wrangham et al.2007).
Most of the analyses mentioned above have focused on relatively short periods of a few seasons or years. Few studies of primate ranging behavior cover temporal scales that allow the detection of long-term characteristics of ranging behavior, such as range shifts or site fidelity. Those that have include for instance, long-term studies of a population of ring-tailed lemurs (Lemur catta), which found that troops remained site-faithful during three decades (Jolly and Pride 1999; Mertl-Millhollen 2000). Another study, which documented high site fidelity of gray-cheeked mangabeys (Lophocebus albigena) during a decade, found that range shifts were linked to dispersal of individuals or group fission (Janmaat et al.2009). Possible reasons for site fidelity are the benefits derived from knowing the location of important resources such as sleeping sites, feeding trees, or efficient travel routes. Consequently, movement into unknown areas may be associated with increased costs, as, e.g., in vervets (Cercopithecus aethiops: Isbell et al.1990). Moreover, most studies of home ranges in primates have not taken into account differential space use or have not quantified the size of overlapping zones. Those that have mainly focused on examining the conditions under which overlapping ranges may be more likely, costly, or adaptive (Mitani and Rodman1979; Nievergelt et al.1998; Wrangham et al.2007), rather than empirically analyzing the use patterns of these shared space in comparison with more exclusively used areas (Benadi et al.2008; Wartmann et al. 2010). To investigate the degree of range overlap is especially relevant for understanding the evolution of primate social systems (Lukas and Clutton-Brock 2013). The mate-guarding hypothesis for the evolution of social monogamy in mammals predicts that when females occupy small, discrete ranges, males are unable to defend several females from other mating partners, and may form a pair with one female whom they guard from other male competitors (Komers and Brotherton1997). Under this hypothesis, it is proposed that nonoverlap-ping territories may be a prerequisite for social monogamy to evolve.
In this study we chose a socially monogamous primate, the Azara’s owl monkey (Aotus azarae azarae) of the Argentinean Chaco, to describe long-term home range sizes and to study social factors influencing ranging behavior. Owl monkeys (Aotus spp.) are distributed over a wide geographic area that extends from Panamá to the South American Chaco (Fernandez-Duque 2011a). These small arboreal primates live in groups that generally consist of an adult reproductive pair, one infant, and one or two juveniles and subadults (Fernandez-Duque2011a; Wright 1994). Owl monkeys are socially monogamous (Fernandez-Duque2011b), with males showing intense care of infants (Fernandez-Duque et al. 2009; Huck and Fernandez-Duque 2013). Natal dispersal of both males and females usually occurs when individuals are ca. 3 yr old (Fernandez-Duque et al.2009). Like other owl monkey species, Azara’s owl monkeys
species, which are strictly nocturnal, Azara’s owl monkeys are cathemeral (Tattersall
2006), being active as much during the day as during the night (Erkert et al.2012; Fernandez-Duque et al.2010).
Across their continental distribution, all species have relatively small home ranges that vary between 4 and 10 ha (Fernandez-Duque2011b). Owl monkeys, including Aotus azarae, have been observed to show forms of territorial behavior during inter-group encounters, varying from ritualized displays and vocalizations with no physical contact to chases and fights that may include violent physical contact between members of different groups (Wright1978, pers. obs. of the authors). Despite these territorial behaviors, owl monkey groups have been sometimes observed to use the same areas, suggesting overlapping ranges. However, there has been some debate on the extent of overlap between neighboring ranges: whether they overlap extensively (Wright1978) or only slightly (Fernandez-Duque2011b).
We present here the results of a 10-yr study that examined the home ranges of 18 groups of owl monkeys in Formosa, Argentina. For six of the groups we also evaluated whether there was a relationship between annual range size, precipitation as a crude proxy for food availability and group size, how much the outer range portion of their ranges and the areas of more intense use within the range (core areas) changed across years, and which parts of these ranges overlapped with neighboring groups. For our study we made the following predic-tions: First, we expected to find a difference in ranging between relatively large groups (five or six individuals) and smaller ones that may be a response to scramble competition, and we expected annual range sizes to remain stable as long as group size remains unchanged. We tested these predictions by assessing the relationship between group sizes and ranging patterns and evaluated whether larger groups overlapped with neighboring groups more than smaller ones. Second, we assumed that for primarily frugivorous primates, knowledge of the location of fruit trees and time of fruiting is essential to exploit patchily distributed resources. Because we had observed that groups frequently revisit feeding trees within their range, we thus predicted that ranges would remain relatively stable over several years. We tested this prediction by quantifying site fidelity as the degree of overlap between annual ranges. Finally, under the mate-guarding hypothesis (Komers and Brotherton1997) we expect nonoverlapping territories that are actively defended. To test this prediction we quantified the degree of range overlap to evaluate whether owl monkey ranging patterns provide support for the mate-guarding hypothesis. We predicted that range overlap would be <21%, the reported mean for 26 socially monogamous primate species (Lukas and Clutton-Brock 213). We expected groups with larger annual ranges and core areas to have higher overlapping areas, because of the constraints to defend larger ranges.
Methods
Study Area and Population
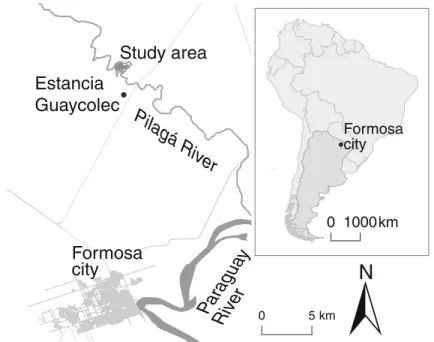
The study area is located in the cattle ranch Estancia Guaycolec (S 25.9735/W 58.1913), ca. 25 km north of the city of Formosa in Northern Argentina (Fig.1).
The ranch includes a mosaic of grasslands and savannas, semideciduous gallery forest along the banks of the Pilagá river (Placci1995), and isolated patches of forests immersed in the savanna matrix. The owl monkey groups inhabit both the gallery forest
and the isolated patches (Juárez et al.2012). Within the gallery forest, a system of transects that runs east to west and north to south, spaced every 100 m, covers an area of ca. 300 ha. Transects are marked every 50 m with fluorescent plastic flagging and aluminum tags. We georeferenced these points with GPS to allow easy and reliable recording of location data of marked transect points. Placci (1995) and van der Heide et al. (2012) thoroughly characterized the structure, composition, and phenology of the gallery forest. The owl monkey groups inhabiting the 300-ha area are habituated to researchers, as Fernandez-Duque et al. (2001) have been monitoring them since 1997. We considered 16 neighboring groups and 2 peripheral ones in the vicinity of the study area for the analyses of long-term home range and core area size. There are no other non-study groups in the area occupied by the 18 groups we studied. Six neighboring groups (C0, Cola Corta, D100, D500, E500, E350) that have been more intensively studied since 1997 contributed most of the spatial data for the analyses of annual ranging patterns. The number of groups in the area did not change during the study. More detailed analyses of demographic and life-history data for the study population can be found elsewhere (Fernandez-Duque 2009; Huck and Fernandez-Duque2012; Huck et al.2011; Juárez2012).
Long-Term Home Ranges and Core Areas
We calculated long-term home ranges for all 18 groups using data from 1998–2008. We contacted groups in the population at least once a month. Given the cathemeral habits of the species (Fernandez-Duque et al.2010), we contacted the groups during active periods that take place early in the morning (05:00–09:30 h) and late in the afternoon (16:00–21:30 h). When we contacted a group, we observed it for a minimum of 15 min and collected data on group composition. A more detailed description of demographic
Study area
Formosa city 0 1000kmPilagá
Riv
er
Estancia
Guaycolec
Formosa
city
5 0 kmR
iv
er
P
ar
ag
ua
y
N
data collection is presented elsewhere (Fernandez-Duque2009). We also recorded the group’s location in relation to the georeferenced transect system. Later, we estimated the latitude/longitude coordinates for the recorded location with a spreadsheet formula using the distance, angle, and the GPS position from the tagged and georeferenced transect point. We tested this method of ranging data collection by comparing locations for points collected with compass and with a GPS device (Garmin OregonTM 200, Garmin International Inc., Olathe, KS) and found that the method using georeferenced transect points provided an accuracy of ca. 10 m per location, which is acceptable for the questions being explored in our study.
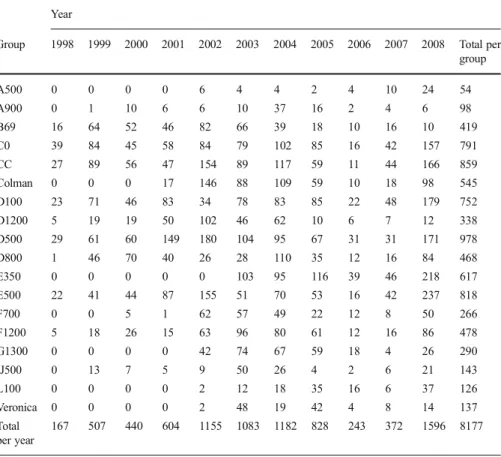
For long-term home range calculations, 8177 locations were available from the 18 studied groups (TableI). The number of locations varied among years, months, and groups. We obtained a mean (± SD) of 145 (± 24) locations per year. The least sampled year was 1998 at the beginning of the study period (167 locations), and the most sampled one was 2008 (1596 locations). We obtained a mean of 42 (± 26) locations per group per year.
Throughout the study period, April was the least (467 locations) and October the most sampled month (925 locations), and we obtained a mean of 38 (± 7) locations per group per month. A500 was the least sampled group and D500 the most. To reduce the
Table I Yearly sample sizes of recorded locations for 18 focal groups of owl monkeys (Aotus azarae) in Estancia Guaycolec ranch, Formosa Province, Argentina, 1998–2008
Year
Group 1998 1999 2000 2001 2002 2003 2004 2005 2006 2007 2008 Total per group A500 0 0 0 0 6 4 4 2 4 10 24 54 A900 0 1 10 6 6 10 37 16 2 4 6 98 B69 16 64 52 46 82 66 39 18 10 16 10 419 C0 39 84 45 58 84 79 102 85 16 42 157 791 CC 27 89 56 47 154 89 117 59 11 44 166 859 Colman 0 0 0 17 146 88 109 59 10 18 98 545 D100 23 71 46 83 34 78 83 85 22 48 179 752 D1200 5 19 19 50 102 46 62 10 6 7 12 338 D500 29 61 60 149 180 104 95 67 31 31 171 978 D800 1 46 70 40 26 28 110 35 12 16 84 468 E350 0 0 0 0 0 103 95 116 39 46 218 617 E500 22 41 44 87 155 51 70 53 16 42 237 818 F700 0 0 5 1 62 57 49 22 12 8 50 266 F1200 5 18 26 15 63 96 80 61 12 16 86 478 G1300 0 0 0 0 42 74 67 59 18 4 26 290 IJ500 0 13 7 5 9 50 26 4 2 6 21 143 L100 0 0 0 0 2 12 18 35 16 6 37 126 Veronica 0 0 0 0 2 48 19 42 4 8 14 137 Total per year 167 507 440 604 1155 1083 1182 828 243 372 1596 8177
potential influence of different sampling intensities across groups and time, and to reduce the amount of autocorrelation present in data sets with high sample sizes (Swihart and Slade1985), we chose a random subset of 800 locations for groups with >800 locations as an optimal balance between reducing amounts of autocorrelation while retaining as much biologically meaningful information as possible. For subsam-pling we used Hawth’s analysis tools (Beyer 2004) in ArcGIS 9.1 (ESRI Inc., Redlands, CA). In total we retained 7400 locations for analysis.
To estimate the size of the home ranges, we used the kernel density estimation (Worton1989), currently the prevalent method in wildlife biology to calculate home ranges (Laver and Kelly 2008). The kernel density estimation (KDE) provides a probabilistic measure of how animals use space and allowed us to distinguish between areas of different intensities of use (Horne and Garton2006), which, e.g., is not possible with the minimum convex polygon method (Wartmann et al.2010). We used the fixed kernel density estimation method as implemented in the home range tools extension HRT (Rodgers et al.2007) in ArcGIS with a raster resolution size of 150 m. This raster resolution provided adequate results given the size of the home ranges we were calculating, without being too computationally intensive. One of the limitations of the kernel method is that it is sensitive to the choice of the smoothing parameter, or bandwidth (Gitzen et al.2006). Various methods are available to select the smoothing parameter objectively (Kernohan et al. 2001). We used biased-cross validation for smoothing parameter selection because, compared to other smoothing parameter selection methods, such as least-squares cross validation, it is stable at large sample sizes (Hemson et al. 2005; Wartmann et al. 2010). The mean (± SD) of all smoothing parameters calculated for home range estimates was 0.38 (± 0.06, N = 18). We report home ranges based on 90% volume contours of kernel probability density surface, as the 95% curve is less accurate (Börger et al.
2006). As most home range studies employing KDE calculated core areas based on 50% volume contours (Laver and Kelly 2008), including primate ranging studies (Williams et al. 2002), we employed the same measurement. To assess the accuracy of the fixed kernel density estimation, we visually compared the spatial distribution of the original locations with the home range as estimated by the model. All kernel estimates fitted the distribution of the original locations well, except for one group (Colman). This group lives in an isolated, narrow island of forest surrounded by grassland outside the main area of study. Because of the relatively narrow and linear shape of this island of forest, the estimation established the home range boundary outside the area where the group actually ranges. Thus, for this group, we manually adapted the smoothing parameter to h = 0.1 to produce a more conservative home range estimate. All results are presented as means with standard deviation (± SD).
Variation in Annual Ranges, Core Areas, and Group Size
To analyze ranging patterns at smaller temporal scales of years, we calculated annual ranges and core areas for the six intensively studied groups. We used the same kernel density estimation method to calculate annual ranges as described for the long-term home ranges in the preceding text. The number of recorded locations varied among groups and years. Thus, for the calculation of each annual range, we chose a random
subset of 100 locations if the total number exceeded 100 locations. When we had less than 35 locations available for a certain group and year, we did not estimate a range for that year. To ensure that the number of locations did not have an influence on range estimates, we used Spearman’s correlation in PASW 18 (SPSS Inc., IBM Corporation, New York, NY) to evaluate the relationship between the total number of locations used to calculate a range and the resulting range size for both annual ranges and core areas. The relationship was weak and not statistically significant for annual ranges (Spearman’s ρ = 0.091, P = 0.512, N = 54) or for core areas (Spearman’s ρ = 0.126, P = 0.363, N = 54). The mean (± SD) of smoothing parameters used to estimate annual ranges and core areas was 0.47 (± 0.04, N = 54 smoothing parameters). We used one-way ANOVA to test whether there were statistically significant differences among groups in annual ranges, core areas, and group size. We tested the relationship between annual range and core area sizes and changes in group size with Spearman’s correlation tests using data on group size for January–February of each year. We chose group size in January–February because it is a time when demographic events that change group size are less likely; births are concentrated in October–December (Fernandez-Duque
2002), dispersals in August–December (Fernandez-Duque2009) and replacements of adults in April–June (Huck and Fernandez-Duque2012). We used general linear mixed models to determine if the dependent variables“annual range” and “core area” were related to rainfall and group size (fixed effects), including group identity as a random factor.
Site Fidelity
To assess the degree of site fidelity, we analyzed the extent of areas that owl monkeys used repeatedly over time. We tested for site fidelity for annual ranges, as well as for core areas, by calculating the intersection of kernel contours for consecutive years in ArcGIS. To test for possible long-term range shifts, we calculated the amount of range overlap between the annual range in 1999 for each group with the annual range of the same group in 2008, e.g., overlap of range in 1999 with range in 2008 for the group Cola Corta, and repeated this calculation for core areas.
Overlaps of Annual Ranges and Core Areas Between Neighboring Groups
To quantify the degree of range overlap between owl monkey groups we calculated the extent of each group annual range that overlapped with the ranges of neighboring focal groups. We calculated range overlap only between focal groups, and not between focal and nonfocal groups, although there is also some additional overlap with those. Using both annual ranges as outer range boundaries, as well as delineations of core areas, we were able to also consider internal space use patterns. We calculated overlaps for the annual range and for the core area as the size of the polygons formed by the intersection of the respective kernel contours in ArcGIS. The sample sizes reported correspond to the number of pairs of years that were compared. We tested whether larger groups overlapped more with neighboring groups more than smaller ones by assessing whether there was a relationship between the size of annual ranges and core areas and the size of overlapping areas using Spearman’s correlation.
Results
Long-Term Home Ranges and Core Areas
The mean home range size was 6.2 ha (± 1.8 ha, N = 18) between 1998 and 2008. The largest home range was three times as large as the smallest one (Veronica: 10.9 ha vs. D500: 3.6 ha; Fig.2, TableII). The mean core area size was 1.9 ha (± 0.6, N = 18) and the range was relatively smaller (1.0–2.6 ha; TableII).
Variation in Annual Ranges, Core Areas, and Group Size
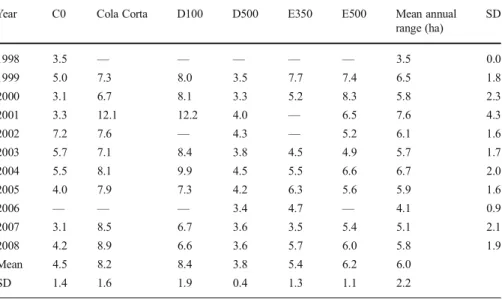
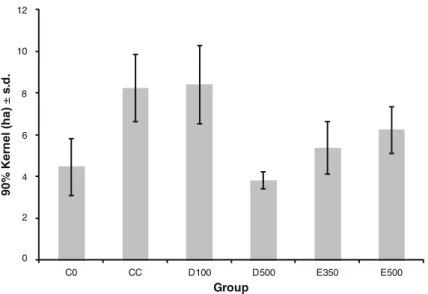
The mean annual range was 6.0 ha (± 2.2 ha, N = 6 groups) and groups differed markedly in the size of their annual ranges (one-way ANOVA: df = 5, F = 18.8, P < 0.001; TableIII, Fig. 3). For example, D500 with a mean annual range size of 3.8 ha (± 0.4 ha, N = 10 yr) consistently occupied less than half the range of D100 (8.4 ha ± 1.9, N = 8) or Cola Corta (8.2 ha ± 1.6, N = 9). The mean core area was 1.9 ha (± 0.7, N = 6 groups), and groups also differed markedly in the size of those (one-way ANOVA: F = 17.74, df = 5, P < 0.001).
There was no significant within-group variation in the size of the annual ranges across years (TableIII, one-way ANOVA: F = 0.738, df = 10, P = 0.685).
Mean group size was 3.6 individuals (± 1.0, N = 6 groups; TableIV). Differences in size among groups were pronounced and statistically significant (TableIV; one-way ANOVA: F = 2.8, df = 5, P = 0.026). Cola Corta was consistently the largest group (4.2 ± 0.8, N = 10 yr), whereas D100 was the smallest one (2.9 ± 0.6, N = 10).
0 200 Meters Legend 50% Kernel 90% Kernel River Pilagá A500 A900 Cola corta C0 D100 D500 B68 D800 F1200 D1200 G1300 F700 IJ500 E500 E350 Veronica Colman L100
N
Fig. 2 Owl monkey home ranges and core areas of the 18 focal groups in Estancia Guaycolec ranch in Formosa Province, Argentina, 1998–2008.
Neither annual range nor core area size was significantly related to group size (TableV).
Table II Home ranges and core areas of 18 focal groups of owl monkeys (Aotus azarae) in Estancia Guaycolec ranch, Formosa Prov-ince, Argentina, 1998–2008
Group Home range (ha) Core area (ha)
A500 7.2 2.6 A900 5.8 1.7 B68 5.2 1.6 C0 5.1 1.6 Cola corta 8.2 2.6 Colman 4.4 1.0 D100 8.0 2.5 D1200 5.1 1.6 D500 3.6 1.2 D800 4.3 1.3 E350 5.3 1.8 E500 5.8 2.3 F700 5.2 1.4 F1200 5.7 1.7 G1300 7.3 2.7 IJ500 9.1 2.6 L100 5.4 1.2 Veronica 10.9 3.2 Mean 6.2 1.9 SD 1.9 0.7
Table III Annual ranges (ha) for six focal groups of Aotus azarae in Estancia Guaycolec ranch, Formosa Province, Argentina, 1998–2008
Year C0 Cola Corta D100 D500 E350 E500 Mean annual range (ha) SD 1998 3.5 — — — — — 3.5 0.0 1999 5.0 7.3 8.0 3.5 7.7 7.4 6.5 1.8 2000 3.1 6.7 8.1 3.3 5.2 8.3 5.8 2.3 2001 3.3 12.1 12.2 4.0 — 6.5 7.6 4.3 2002 7.2 7.6 — 4.3 — 5.2 6.1 1.6 2003 5.7 7.1 8.4 3.8 4.5 4.9 5.7 1.7 2004 5.5 8.1 9.9 4.5 5.5 6.6 6.7 2.0 2005 4.0 7.9 7.3 4.2 6.3 5.6 5.9 1.6 2006 — — — 3.4 4.7 — 4.1 0.9 2007 3.1 8.5 6.7 3.6 3.5 5.4 5.1 2.1 2008 4.2 8.9 6.6 3.6 5.7 6.0 5.8 1.9 Mean 4.5 8.2 8.4 3.8 5.4 6.2 6.0 SD 1.4 1.6 1.9 0.4 1.3 1.1 2.2
Neither rainfall nor group size was a strong predictor of the annual range (rainfall, F = 3.291, P = 0.192; group size, F = 1.2, P = 0.272) or the core area (rainfall, F = 0.279, P = 0.606, group size, F = 0.509, P = 0.480). However, the variable“group” was highly predictive of the annual range (F = 18.68, P < 0.001) and core area (F = 4.777, P < 0.001), suggesting that most of the observed variation in range sizes was explained by variation among individual owl monkey groups.
Site Fidelity
Site fidelity in owl monkeys was high; ranges remained fairly stable during almost a decade. We found a mean overlap between outer range boundaries of successive years of 82% (± 11, N = 6 groups; TableVI). The highest mean overlap was 86% and the lowest 78% (TableVI). The highest annual range overlap between two successive years was 98% and the lowest 54%. For core areas, the average overlap between successive
0 2 4 6 8 10 12 C0 CC D100 D500 E350 E500 90 % K e rn el ( h a) ± s. d . Group
Fig. 3 Owl monkey group annual ranges, core areas, and overlaps for the six focal groups in Estancia Guaycolec ranch in Formosa Province, Argentina. Data for 2004 are displayed as an example.
Table IV Group size of six focal groups of owl monkeys (Aotus azarae) in Estancia Guaycolec ranch in Formosa Province, Argentina in January of each year, 1998–2008
Year Group 1998 1999 2000 2001 2002 2003 2004 2005 2006 2007 2008 Mean SD C0 5 4 5 4 4 2 3 2 2 2 2 3.2 1.3 Cola Corta — 5 5 4 5 3 3 4 4 4 5 4.2 0.8 D100 — 3 4 3 2 3 2 3 3 3 3 2.9 0.6 D500 — 3 3 4 4 5 6 3 3 4 4 3.9 1.0 E350 — 3 3 3 — 2 3 4 4 4 4 3.3 0.7 E500 — — 5 5 3 2 3 4 5 5 3 3.9 1.2
years was 65% (± 15, N = 6 groups, TableVI). The highest mean overlap was 71% and lowest 60% (TableVI). The highest core area overlap between two successive years was 100% and the lowest 34%.
Mean overlap was 77% (± 19, N = 6) between the annual ranges in 1999 and those occupied in 2008. The highest annual range overlap was 99% and the lowest was 62%. The mean overlap of core areas was 47% (± 25, N = 6); the highest was 84% and the lowest 16%.
Overlaps Between Annual Ranges and Core Areas of Neighboring Groups
Groups overlapped considerably in the outer parts of their ranges (Fig.4). On average, almost half of a focal group’s annual range overlapped with neighboring focal groups (48% ± 15). There was also variation among groups in the range of overlap. The groups that shared, on average, the smallest parts of their range were Cola Corta (41% ± 25, N = 8 yr) and D100 (43% ± 5, N = 8), whereas the largest mean overlaps were observed for C0 (54% ± 15, N = 8) and E350 (56% ± 6, N = 5).
Groups with larger annual ranges overlapped more with neighboring groups than groups with smaller ranges (Spearman’s ρ = 0.63, P < 0.001, N = 34). However, we found no evidence that larger groups overlapped more with other groups than smaller ones (ρ = 0.13, P = 0.475, N = 34).
Table V Spearman’s ρ for the correlation of group size and annual range/core area for six focal groups of owl monkeys (Aotus azarae) in Estancia Guaycolec ranch, Formosa Province, Argentina, 1998–2008
Annual range Core area
Group ρ P N ρ P N C0 –0.25 0.478 10 –0.25 0.490 10 CC –0.16 0.680 9 –0.61 0.084 9 D100 –0.22 0.604 8 –0.44 0.280 8 D500 0.63 0.049 10 0.39 0.259 10 E350 0.39 0.927 8 –0.20 0.642 8 E500 0.50 0.206 8 0.45 0.263 8
Table VI Mean and standard de-viation of core area and annual range overlap (%) for six focal groups of owl monkeys (Aotus azarae) in Estancia Guaycolec ranch, Formosa Province, Argenti-na, 1998–2008
N = number of comparisons be-tween successive annual ranges.
Group N Mean core area SD Mean annual range SD C0 7 62 11 78 15 Cola Corta 7 71 20 84 14 D100 5 72 8 86 8 D500 6 60 14 85 5 E350 3 62 14 85 17 E500 6 64 21 78 7 Total 34 65 15 82 11
The extent of overlap of the core areas was much smaller (11% ± 15), but the variation among groups was still pronounced. For example, there was almost exclusive use of the core area by Cola Corta (1% ± 1, N = 8 yr) and E500 (2% ± 4, N = 5), whereas C0 and D100 overlapped on average almost a fifth of their core areas with other groups (C0: 17% ± 12, D100: 18% ± 23). We did not find that groups with larger core areas had larger parts of their core areas overlap with neighbors (ρ = –0.1, P = 0.574, N = 34). There was also no relationship between the amount of overlap and group size (ρ = 0.01, P = 0.942, N = 34).
Discussion
Inter- and Intraspecific Variation in Owl Monkey Home Ranges
Our study provides some new findings on space use by Azara’s owl monkeys of the Argentinean Chaco. Focusing on a large number of identified groups intensively sampled during a decade, our data show that owl monkey groups occupy home ranges that average 6 ha and include a core area that is ca. 2 ha. These estimates of home range size are in good agreement with previous estimates of 4–12 ha for the same population (Fernandez-Duque 2011b), for two other populations inhabiting isolated patches of forest in the region (Juárez 2012) and for a different subspecies (Aotus azarae boliviensis, 10 ha, N = 1 group; García and Braza1987). Estimates of home range size for other tropical owl monkey species have also reported sizes within this range: Groups of Aotus nigriceps occupy 4–17 ha in Manú NP, Peru (N = 3 groups, Wright 1994), and A. vociferans of 6 ha in Yasuní, Ecuador (N = 1; Fernandez-Duque et al. 2008a). That all owl monkey species, strictly nocturnal or cathemeral, tropical or subtropical, in continuous or fragmented landscapes, seem to occupy ranges of similar size suggests influences that exceed the merely ecological ones.
0 100 Meters Legend C0 Cola corta D100 D500 E350 E500 90% Kernel 50% Kernel N
Fig. 4 Owl monkey mean annual ranges for the six focal groups in Estancia Guaycolec ranch in Formosa Province, Argentina, 1998–2008.
Comparing different populations, subspecies and species is a powerful approach to identify ecological factors influencing patterns of use of space. In fact, much of comparative primate socioecology has been developed by comparing data from differ-ent species in various habitats to investigate the influence of those habitats on the behavioral ecology of the species under consideration. However, comparative studies are complicated by differences in sampling strategy, sample sizes, and home range models. Most studies quantifying home ranges in Aotus spp. have used minimum convex polygon (MCP) methods on a relatively small number of groups sampled during time intervals of several months or few years. MCP methods have the undesir-able tendency to underestimate ranges at low sample sizes and to overestimate them at higher sample sizes (Burgman and Fox2003; Wartmann et al.2010), whereas kernel estimates are much less susceptible to sample size (Kernohan et al.2001; Wartmann et al.2010). To be able to conduct comparative studies in the future, researchers should use standardized methods to estimate ranges and report the model and methods used carefully (Laver and Kelly 2008; Sterling et al. 2000). Our results illustrate an impressive range of variation; some home ranges were three times as large as others. This intrapopulation variation exceeds the reported interspecies variation.
Variation in Annual Ranges, Core Areas, and Group Size
We found no significant intragroup variation in mean annual range size. This may explain why we found no intragroup relationship between range size and environmental or social factors such as rainfall or group size. However, it seems likely that food availability might influence owl monkey ranging on smaller temporal and spatial scales than we assessed in this study. For example, future studies should investigate whether ranging patterns vary between the dry and wet seasons.
We found significant intergroup variation in the size of ranges used. Variability in the size of core areas between groups was lower but still pronounced. We predicted that variation in group size would be related to differences in range sizes, with larger groups ranging over bigger areas than smaller ones. However, our data do not support this prediction, as the number of individuals in owl monkey groups was not significantly associated with the size of the annual range or core area. An earlier study (Fernandez-Duque et al.2013) suggested that food availability in core areas is above a critical threshold necessary for owl monkeys; thus larger groups may not need to expand their core area to meet their energy requirements. In other words, it is possible that the outer part of the range may be more important for social behavior than for foraging. In chimpanzees (Pan troglodytes), for instance, the size of home ranges reflects the abundance of resources; areas with low abundance and high dispersal of food resources result in larger ranges (Dunbar1988; Herbinger et al.2001) and those with local high abundance of food resources produce smaller ones (Newton-Fisher2003).
Due to the varying proportions of floodable, lowland, and transitional forest in the owl monkey study area, habitats differ in the quality and abundance of food resources they offer to the various groups (van der Heide et al.2012). Thus, one would expect to find higher local food abundance in owl monkey groups with smaller ranges. However, despite pronounced differences in the distribution of important tree species and food availability across four owl monkey ranges, there was no evidence that groups with smaller ranges had more food available in their overall range (van der Heide et al.
2012). The differences in food availability between the ranges of different groups were more pronounced within outer range boundaries. The core areas were more similar to each other, with important food species such as Ficus spp. being similarly abundant (van der Heide et al.2012). The core areas were also comparatively more productive than the overall ranges, and predictably produced food even during the dry seasons when overall food availability in the area markedly decreased (van der Heide et al.
2012). During these dry seasons, core areas were similar in fruit production for the different groups, and comparatively more productive than the overall group ranges (Fernandez-Duque et al.2013). The core areas had the smallest differences in food availability among territories, which suggests that it is the quality of those that is the critical factor for owl monkey feeding and foraging. Our findings support this argu-ment, as we found the core areas to be used almost exclusively, whereas the overall ranges overlapped considerably between neighboring groups.
Further, we found that core areas are only one third the size of the annual range, which means that owl monkeys spent on average half of their time in less than half of their range. Such intensive use of only a small part of the overall range is common in primates. Chimpanzees (Pan troglodytes) spent 75% of the time in 35% of their range (Boesch and Boesch-Ackermann2000) and brown howlers (Alouatta guariba) spent 50% of their time in only 10% of their range (Agostini et al.2010). Even though the notion of a“core area” has been questioned (Barg et al.2005; Wray et al.1992), our results show that, at least for owl monkeys, they exist as a biologically relevant space. Site Fidelity
Owl monkeys made stable use of their ranges from one year to the next, and for almost a decade. Generally, in any given year, groups occupied as much as 80% of the overall range they had occupied the previous year. This finding provides some support for the prediction that owl monkey ranges remain stable over several years, as groups keep visiting the same locations of fruit trees within their range. However, our method to determine site fidelity did not include the direction of range shifts (Janmaat et al.2009) or the number of years in which certain areas were used (Ramos-Fernandez et al.
2013), which we propose as methods for future and more detailed analyses. The high site fidelity observed for owl monkeys also fits well with overall abundance of food species reported for the area (van der Heide et al.2012), rendering range switches unnecessary in the absence of pronounced social or ecological pressures. These results contribute to a small set of studies on site fidelity by primates conducted over periods of many years. Ring-tailed lemurs (Lemur catta) were found to occupy similar ranges even across generations (Jolly and Pride 1999; Mertl-Millhollen 2000), and gray-cheeked mangabeys (Lophocebus albigena), which, like owl monkeys, are highly frugivorous, also showed pronounced site fidelity with an overlap of >60% over 10 yr (Janmaat et al.2009).
Naturally, site fidelity largely depends on the time scale at which it is analyzed. Even species considered site-faithful at relatively long temporal scales may exhibit seasonal movement patterns within their overall home range (Janmaat et al.2009). Frugivorous primates often adapt their ranging behavior to local fruiting patterns; Sumatran orang-utans, for example, follow peaks in fruit production along altitudinal bands within their overall range (Buij et al.2002). To analyze seasonal movement patterns in frugivorous
owl monkeys, movement analyses at finer temporal granularities, such as during dry or wet seasons, will be needed in the future; ideally those studies should be performed together with accurate estimates of actual food availability in these seasonal ranges (Fernandez-Duque et al.2013).
Range Overlaps, Monogamy, and Mate Guarding
Following the mate-guarding hypothesis (Komers and Brotherton1997), we predicted that for socially monogamous owl monkeys, groups would occupy nonoverlapping territories. Our results do not provide direct support for the hypothesis because we found that on average half of their outer range overlapped with neighboring groups. Comparing range overlaps for owl monkeys with other monogamous species, we observed higher average overlap in our study (48%) than the 21% reported mean overlap for 26 socially monogamous primates (Lukas and Clutton-Brock2013). In contrast to spatial overlap in the outer range parts, owl monkey groups occupied almost exclusive core areas that only overlapped minimally (10%) with other groups. In contrast with the high overlap areas towards the outer range, the existence of such exclusively used spaces provides support for the mate-guarding hypothesis. The high overlap of annual ranges and low overlap in core areas indicates that owl monkey groups use the inner parts of the home range more exclusively, while overlap occurs in the outer areas of the range. In those outer areas resident owl monkeys may thus have potential access to more than one mating partner. Such potential access to mating partners also exists for other socially monogamous and pair-living species (Dobson et al.2010; Fietz et al.2000; Palombit1994). However, no extra-pair matings have been documented in owl monkeys (Babb et al.2011; Fernandez-Duque et al.2008b). The high overlaps in less used areas is in accordance with the findings that overlap zones in primate ranges tend to be underused (Wrangham et al.2007). The core areas are thus where groups maintain almost exclusive access to resources such as food, sleeping sites, and mates by excluding competition from other groups. In other words, it seems that for owl monkeys one can think of the core area as a territory. Ongoing examinations of the spatial distribution of territorial behavior, feeding, and sleeping trees will allow us to test the potential function of the core area (Corley et al.2014; Savagian et al.2014). In the future it will be important to extend our analyses to consider in more depth the temporal dimension of range use. Our analyses were almost exclusively on spatial overlap, but much will be gained from detailed examinations of temporal overlap. We have observed that different groups visit the same feeding trees that are located in overlapping areas. However, they mostly visited during them during different times, although we documented few instances when groups coincided in the same observation. These observations suggest that the overlap of these group ranges is mostly spatial, and not temporal. Owl monkey groups may attempt to maximize access to clumped high-quality feeding resources such as fig trees, while minimizing the possibility of inter-group encounters that could lead to competition with same-sex individuals.
It is also possible that overlapping areas are important for dispersing individuals. When individuals move into new areas, they lack knowledge of important resources such as location of food and shelter. Dispersing red howlers (Alouatta seniculus), for instance, had a poorer diet than resident ones (Pope 1989 in Isbell and van Vuren
individuals with the possibility to explore new social opportunities while, at least for some time, staying in a familiar area. In owl monkeys, all individuals of both sexes disperse, when they are ca. 3 yr of age. The cost of dispersal is apparently high, given that it is the life stage when most animals die or disappear (Fernandez-Duque2009). During dispersal some individuals were observed to linger in areas close to range boundaries (Fernandez-Duque2009), which would indicate a gradual dispersal process away from the natal range. However, more detailed analyses are needed of movement paths of dispersing individuals with respect to group ranges to make inferences about the spatial aspects of the dispersal process in owl monkeys.
In conclusion, we have shown that owl monkey occupy home ranges of 6 ha and core areas of 2 ha. The variability was high both within and between groups, but neither rainfall as an environmental variable nor group size as a social variable was a statistically significant predictor of this variation. Because we found no evidence that larger groups occupy larger areas than smaller groups, this indicates that food availability might be above a critical threshold for owl monkeys so that larger groups do not need to extend their foraging areas to meet their energy requirements. These results notwithstanding, we speculate that environmental and social factors might still have an influence, but that this influence occurs at temporal and spatial scales that we were unable to detect with our methods. Future studies could analyze these effects on ranging during smaller time periods, for instance, during wet and dry seasons. We found that owl monkeys occupy ranges that stay stable over several years, which supports the prediction that in the absence of severe social or ecological pressure, owl monkey groups keep visiting the same locations of fruit trees within their range. We found considerable overlap between neighboring groups and showed that this overlap occurs in the outer, less frequently used parts of their ranges. However, the overlap is more spatial than temporal, which maxi-mizes access to clumped feeding resources in overlapping areas that are used at distinct times, while excluding other males from access to females in exclusively used areas.
Acknowledgments The Ministerio de la Producción, Subsecretaría de Ecología y Recursos Naturales from Formosa Province and the Dirección de Fauna Silvestre de la Nación Argentina authorized the fieldwork. The authors thank Fundación ECO of Formosa, Argentina for logistical support and Estancia Guaycolec for permission to work on their premises. We acknowledge the efforts of all researchers, students, and volunteers who contributed to data collection, especially Victor Dávalos and Marcelo Rotundo. E. Fernandez-Duque thanks Anthony Di Fiore for early discussions that influenced the collection and organization of ranging data. We thank Anthony Di Fiore and Maren Huck for valuable comments on a previous version of this manuscript and Kathleen Woodhouse-Ledermann for proofreading. F. M. Wartmann is grateful for financial support by the Forschungskredit of the University of Zurich, grant no. FK-13-104 and for the hospitality and support received from Anastacia Gimenez and Rodrigo Flores during her stays in Formosa. E. Fernandez-Duque acknowledges the financial support during all these years from the Wenner-Gren Foundation, the L. S. B. Leakey Foundation, the National Geographic Society, the National Science Foundation (BCS- 0621020), the University of Pennsylvania Research Foundation, and the Zoological Society of San Diego. We thank the editors and two anonymous reviewers for their comments which helped to improve the manuscript.
References
Agostini, I., Holzmann, I., & Di Bitetti, M. S. (2010). Ranging patterns of two syntopic howler monkey species (Alouatta guariba and A. caraya) in Northeastern Argentina. International Journal of Primatology, 31, 363–381.
Babb, P., McIntosh, A., Fernandez-Duque, E., Di Fiore, A., & Schurr, T. (2011). An optimized microsatellite genotyping strategy for assessing genetic identity and kinship in Azara’s owl monkeys (Aotus azarai). Folia Primatologica, 82, 107–117.
Barg, J. J., Jones, J., & Robertson, R. J. (2005). Describing breeding territories of migratory passerines: Suggestions for sampling, choice of estimator, and delineation of core areas. Journal of Animal Ecology, 74, 139–149.
Benadi, G., Fichtel, C., & Kappeler, P. (2008). Intergroup relations and home range use in Verreaux’s sifaka (Propithecus verreauxi). American Journal of Primatology, 70, 956–965.
Beyer, H. L. (2004). Hawth’s analysis tools for ArcGIS. Available athttp://www.spatialecology.com/htools
(Accessed April 1, 2014).
Biebouw, K. (2009). Home range size and use in Allocebus trichotis in Analamazaotra Special Reserve, Central Eastern Madagascar. International Journal of Primatology, 30, 367–386.
Boesch, C., & Boesch-Ackermann, H. (2000). The chimpanzees of the Taï Forest: Behavioral ecology and evolution. Oxford: Oxford University Press.
Boitani, L., & Fuller, T. K. (2000). Research techniques in animal ecology: Controversies and consequences. New York: Columbia University Press.
Börger, L., Franconi, N., de Michele, G., Gantz, A., Meschi, F., Manica, A., Lovari, S., & Coulson, T. (2006). Effects of sampling regime on the mean and variance of home range size estimates. Journal of Animal Ecology, 75, 1393–1405.
Brockman, D. K., & van Schaik, C. (2005). Seasonality in primates. Studies of living and extinct human and non-human primates. Cambridge and New York: Cambridge University Press.
Buij, R., Wich, S. A., Lubis, A. H., & Sterck, E. H. M. (2002). Seasonal movements in the Sumatran orangutan (Pongo pygmaeus abelii) and consequences for conservation. Biological Conservation, 107, 83–87. Burgman, M. A., & Fox, J. C. (2003). Bias in species range estimates from minimum convex polygons:
Implications for conservation and options for improved planning. Animal Conservation, 6, 19–28. Burt, W. H. (1943). Territoriality and home range concepts as applied to mammals. Journal of Mammalogy,
24, 346–352.
Buzzard, P. J. (2006). Ranging patterns in relation to seasonality and frugivory among Cercopithecus campbelli, C. petaurista, and C. diana in the Taï Forest. International Journal of Primatology, 27, 559–573. Clutton-Brock, T. H., & Harvey, P. H. (1977a). Primate ecology and social organization. Journal of Zoology,
183, 1–39.
Clutton-Brock, T. H., & Harvey, P. H. (1977b). Species differences in feeding and ranging behavior in primates. In T. H. Clutton-Brock (Ed.), Primate ecology. London: Academic Press.
Clutton-Brock, T. H., & Harvey, P. H. (1981). Primate home range size and metabolic needs. Behavioral Ecology and Sociobiology, 8, 151–155.
Corley, M., Spence-Aizenberg, A., Morucci, K., Rotundo, M., Di Fiore, A., Fernandez-Duque, E. (2014). The function of scent-marking in territorial owl monkeys. American Journal of Physical Anthropology, 153(S58), 98.
Cowlishaw, G. (1992). Song function in gibbons. Behaviour, 121, 131–153.
Dias, L. G., & Strier, K. B. (2003). Effects of group size on ranging patterns in Brachyteles arachnoides hypoxanthus. International Journal of Primatology, 24, 209–221.
Di Bitetti, M. S. (2001). Home-range use by the tufted capuchin monkey (Cebus apella nigritus) in a subtropical rainforest of Argentina. Journal of Zoology, 253, 33–45.
Dobson, F. S., Way, B. M., & Baudoin, C. (2010). Spatial dynamics and the evolution of social monogamy in mammals. Behavioral Ecology, 21, 747–752.
Dunbar, R. I. M. (1988). Primate social systems. London: Croom Helm.
Erkert, H. G., Fernandez-Duque, E., Rotundo, M., & Scheideler, A. (2012). Seasonal variation of temporal niche in wild owl monkeys (Aotus azarai azarai) of the Argentinean Chaco: A matter of masking? Chronobiology International, 29, 702–714.
Fashing, P. (2001). Male and female strategies during intergroup encounters in guerezas (Colobus guereza): Evidence for resource defense mediated through males and a comparison with other primates. Behavioral Ecology and Sociobiology, 50, 219–230.
Fernandez-Duque, E. (2002). Environmental determinants of birth seasonality in night monkeys (Aotus azarai) of the Argentinean Chaco. International Journal of Primatology, 23, 639–656.
Fernandez-Duque, E. (2009). Natal dispersal in monogamous owl monkeys (Aotus azarai) of the Argentinean Chaco. Behaviour, 146, 583–606.
Fernandez-Duque, E. (2011a). Rensch’s rule, Bergmann’s effect and adult sexual dimorphism in wild monogamous owl monkeys (Aotus azarai) of Argentina. American Journal of Physical Anthropology, 146, 38–48.
Fernandez-Duque, E. (2011b). The Aotinae: Social monogamy in the only nocturnal Haplorhynes. In C. J. Campbell, A. Fuentes, K. C. MacKinnon, S. Bearder, & R. Stumpf (Eds.), Primates in perspective (2nd ed., pp. 139–154). New York: Oxford University Press.
Fernandez-Duque, E., Di Fiore, A., & Carrillo-Bilbao, G. (2008a). Behavior, ecology, and demography of Aotus vociferans in Yasuní National Park, Ecuador. International Journal of Primatology, 29, 421–431. Fernandez-Duque, E., Juárez, C., & Di Fiore, A. (2008b). Adult male replacement and subsequent infant care
by male and siblings in socially monogamous owl monkeys (Aotus azarai). Primates, 49, 81–84. Fernandez-Duque, E., La Iglesia, H., de Erkert, H. G., & Gursky-Doyen, S. (2010). Moonstruck primates: Owl
monkeys (Aotus) need moonlight for nocturnal activity in their natural environment. PLoS ONE, 5, e12572.
Fernandez-Duque, E., Rotundo, M., & Sloan, C. (2001). Density and population structure of owl monkeys (Aotus azarai) in the Argentinean Chaco. American Journal of Primatology, 53, 99–108.
Fernandez-Duque, E., Valeggia, C. R., & Mendoza, S. P. (2009). The biology of paternal care in human and nonhuman primates. Annual Review of Anthropology, 38, 115–130.
Fernandez-Duque, E., van der Heide, G., Fernandez-Duque, E., & Heide, G. (2013). Dry season resources and their relationship with owl monkey (Aotus azarae): Feeding behavior, demography, and life history. International Journal of Primatology, 34, 752–769.
Fietz, J., Zischler, H., Schwiegk, C., Tomiuk, J., Dausmann, K. H., & Ganzhorn, J. U. (2000). High rates of extra-pair young in the pair-living fat-tailed dwarf lemur, Cheirogaleus medius. Behavioral Ecology and Sociobiology, 49, 8–17.
Garber, P. A., Pruetz, J. D., & Isaacson, J. (1993). Patterns of range use, range defense, and intergroup spacing in moustached tamarin monkeys (Saguinus mystax). Primates, 34, 11–25.
García, J. E., & Braza, F. (1987). Activity rhythms and use of space of a group of Aotus azarae in Bolivia during the rainy season. Primates, 28, 337–342.
Gitzen, R. A., Millspaugh, J. J., & Kernohan, B. J. (2006). Bandwidth-selection for fixed-kernel analysis of animal utilization distributions. Journal of Wildlife Management, 70, 1334–1344.
Hemson, G., Johnson, P., South, A., Kenward, R., Ripley, R., & MacDonald, D. (2005). Are kernels the mustard? Data from global positioning system (GPS) collars suggests problems for kernel home-range analyses with least-squares cross-validation. Journal of Animal Ecology, 74, 455–463.
Herbinger, I., Boesch, C., & Rothe, H. (2001). Territory characteristics among three neighboring chimpanzee communities in the Taï National Park, Cote d’Ivoire. International Journal of Primatology, 22, 143–167. Horne, J. S., & Garton, E. O. (2006). Likelihood cross-validation versus least squares cross-validation for choosing the
smoothing parameter in kernel home-range analysis. Journal of Wildlife Management, 70, 641–648. Huck, M., & Fernandez-Duque, E. (2012). Children of divorce: Effects of adult replacements on previous
offspring in Argentinean owl monkeys. Behavioral Ecology and Sociobiology, 66, 505–517.
Huck, M., & Fernandez-Duque, E. (2013). When dads help: Male behavioral care during primate infant development. In K. B. H. Clancy, K. Hinde, & J. N. Rutherford (Eds.), Building babies: Primate development in proximate and ultimate perspective. Developments in primatology: progress and prospects (Vol. 37, pp. 361–385). New York: Springer Science+Business Media.
Huck, M., Rotundo, M., & Fernandez-Duque, E. (2011). Growth and development in wild owl monkeys (Aotus azarai) of Argentina. International Journal of Primatology, 32, 1133–1152.
Isbell, L. A., Cheney, D. L., & Seyfarth, R. M. (1990). Costs and benefits of home range shifts among vervet monkeys (Cercopithecus aethiops) in Amboseli National Park, Kenya. Behavioural Ecology and Sociobiology, 27, 351–358.
Isbell, L. A., Pruetz, J. D., & Young, T. P. (1998). Movements of vervets (Cercopithecus aethiops) and patas monkeys (Erythrocebus patas) as estimators of food resource size, density, and distribution. Behavioral Ecology and Sociobiology, 42, 123–133.
Isbell, L. A., & van Vuren, D. (1996). Differential costs of locational and social dispersal and their consequences for female group-living primates. Behaviour, 133, 1–36.
Janmaat, K. R. L., Olupot, W., Chancellor, R. L., Arlet, M. E., & Waser, P. M. (2009). Long-term site fidelity and individual home range shifts in Lophocebus albigena. International Journal of Primatology, 30, 443– 466.
Jolly, A., & Pride, E. (1999). Troop histories and range inertia of Lemur catta at Berenty, Madagascar: A 33-year perspective. International Journal of Primatology, 20, 359–373.
Juárez, C. P. (2012). Demografía e historia de vida del mono mirikiná (Aotus a. azarai) en el Chaco Húmedo Formoseño. Doctoral dissertation, Universidad Nacional de Tucumán, Tucumán, Argentina
Juárez, C., Kowaleski, M., Baldovino, C., & Fernandez-Duque, E. (2012). Los primates de Argentina: Ecología y conservación. In G. Porini & D. Ramadori (Eds.), Manejo de Fauna Silvestre en Argentina: Programas de Especies Amenazadas. Buenos Aires: Fundación de Historia Natural Félix de Azara.
Kernohan, B. J., Gitzen, R. A., & Millspaugh, J. J. (2001). Analysis of animal space use and movements. In J. J. Millspaugh & J. M. Marzluff (Eds.), Radio tracking and animal populations (pp. 125–166). San Diego: Academic Press.
Komers, P. E., & Brotherton, P. N. M. (1997). Female space use is the best predictor of monogamy in mammals. Proceedings of the Royal Society B: Biological Sciences, 264, 1261–1270.
Laver, P. N., & Kelly, M. J. (2008). A critical review of home range studies. Journal of Wildlife Management, 72, 290–298.
Lazaro-Perea, C. (2001). Intergroup interactions in wild common marmosets, Callithrix jacchus: territorial defence and assessment of neighbours. Animal Behaviour, 62, 11–21.
Lehman, S. M., Nargolwalla, M., Faulkner, A., Taylor, N., & Lundy, R. (2007). Test of the optimal body size model for strepsirhines. International Journal of Primatology, 28, 211–230.
Lowen, C., & Dunbar, R. I. M. (1994). Territory size and defendability in primates. Behavioral Ecology and Sociobiology, 35, 347–354.
Lukas, D., & Clutton-Brock, T. H. (2013). The evolution of social monogamy in mammals. Science, 341, 526–529.
Markham, A. C., Alberts, S. C., & Altmann, J. (2012). Intergroup conflict: Ecological predictors of winning and consequences of defeat in a wild primate population. Animal Behaviour, 84, 399–403.
Mertl-Millhollen, A. S. (2000). Tradition in Lemur catta behavior at Berenty Reserve, Madagascar. International Journal of Primatology, 21, 287–297.
Milton, K., & May, M. (1976). Body weight, diet and home range in primates. Nature, 259, 459–462. Mitani, J. C., & Rodman, P. S. (1979). Territoriality: The relation of ranging pattern and home range size to
defendability, with an analysis of territoriality among primate species. Behavioral Ecology and Sociobiology, 5, 241–251.
Mitani, J. C., & Watts, D. P. (2005). Correlates of territorial boundary patrol behaviour in wild chimpanzees. Animal Behaviour, 70, 1079–1086.
Newton-Fisher, N. E. (2003). The home range of the Sonso community of chimpanzees from the Budongo Forest, Uganda. African Journal of Ecology, 41, 150–156.
Nievergelt, C. M., Mutschler, T., & Feistner, A. T. C. (1998). Group encounters and territoriality in wild Aloatran gentle lemurs (Hapalemur griseus alaotrensis). American Journal of Primatology, 46, 251–258.
Palombit, R. (1994). Dynamic pair bonds in hylobatids: Implications regarding monogamous social systems. Behaviour, 128, 65–101.
Placci, L. (1995). Estructura y funcionamiento fenológico en relación a un gradiente hídrico en bosques del este de Formosa. Doctoral dissertation, Universidad de La Plata, La Plata, Argentina.
Ramos-Fernandez, G., Smith Aguilar, S. E., Schaffner, C. M., Vick, L. G., Aureli, F., & Gursky-Doyen, S. (2013). Site fidelity in space use by spider monkeys (Ateles geoffroyi) in the Yucatan Peninsula, Mexico. PLoS ONE, 8, e62813.
Rodgers, A. R., Carr, A. P., Beyer, H. L., & Kie, J. G. (2007). HRT: home range tools for ArcGIS. Version 1.1. Edited by Ontario Ministry of Natural Resources Centre for Northern Forest Ecosystem Research. Thunder Bay, Ontario, Canada.
Savagian, A., Twitchell-Heyne, A., Corley, M., Rotundo M., Di Fiore, A., Fernandez-Duque, E. (2014). Resource utilization and home range overlap in territorial owl monkeys of Argentina. American Journal of Physical Anthropology, 153(S58), 230.
Steenbeek, R., & van Schaik, C. P. (2001). Competition and group size in Thomas’s langurs (Presbytis thomasi): The folivore paradox revisited. Behavioral Ecology and Sociobiology, 49, 100–110. Sterling, E. J., Nguyen, N., & Fashing, P. J. (2000). Spatial patterning in nocturnal Prosimians: A review of
methods and relevance to studies of sociality. American Journal of Primatology, 21, 3–19.
Sylviane, M., Volampeno, N., Masters, J. C., & Downs, C. T. (2011). Home range size in the blue-eyed black lemur (Eulemur flavifrons): A comparison between dry and wet seasons. Mammalian Biology, 76, 157–164. Swihart, R. K., & Slade, N. A. (1985). Testing for independence of observations in animal movements.
Ecology, 1176–1184.
Tattersall, I. (2006). The concept of cathemerality: History and definition. Folia Primatologica, 77, 7–14. Teichroeb, J. A., & Sicotte, P. (2009). Test of the ecological-constraints model on ursine colobus monkeys
(Colobus vellerosus) in Ghana. American Journal of Primatology, 71, 49–59.
van der Heide, G., Fernandez-Duque, E., Iriart, D., & Juárez, C. P. (2012). Do forest composition and fruit availability predict demographic differences among groups of territorial owl monkeys (Aotus azarai)? International Journal of Primatology, 33, 184–207.
Wartmann, F. M., Purves, R. S., & van Schaik, C. P. (2010). Modelling ranging behaviour of female orang-utans: A case study in Tuanan, Central Kalimantan, Indonesia. Primates, 51, 119–130.
Watts, D. P. (1998). Long-term habitat use by mountain gorillas (Gorilla gorilla beringei): Consistency, variation and home range size and stability. International Journal of Primatology, 19, 651–680. Williams, J. M., Pusey, A. E., Carlis, J. V., Farm, B. P., & Goodall, J. (2002). Female competition and male
territorial behaviour influence female chimpanzees’ ranging patterns. Animal Behaviour, 63, 347–360. Wilson, M. L., Hauser, M. D., & Wrangham, R. W. (2001). Does participation in intergroup conflict depend on
numerical assessment, range location, or rank for wild chimpanzees? Animal Behaviour, 61, 1203–1216. Worton, B. J. (1989). Kernel methods for estimating the utilization distribution in home-range studies.
Ecology, 70, 164–168.
Wrangham, R., Crofoot, M., Lundy, R., & Gilby, I. (2007). Use of overlap zones among group-living primates: A test of the risk hypothesis. Behaviour, 144, 1599–1619.
Wray, S., Cresswell, W., White, P., & Harris, S. (1992). What, if anything, is a core area? An analysis of the problems of describing internal range configurations. In I. G. Priede & S. M. Swift (Eds.), Wildlife telemetry: Remote monitoring and tracking animals (pp. 257–271). New York: Ellis Horwood. Wright, P. C. (1978). Home range, activity pattern, and agonistic encounters of a group of night monkeys
(Aotus trivirgatus) in Peru. Folia Primatologica, 29, 43–55.
Wright, P. C. (1994). The behavior and ecology of the owl monkey. In J. F. Baer, R. E. Weller, & I. Kakoma (Eds.), Aotus: The owl monkey (p. 95). San Diego: Academic Press.
Zhang, S.-Y. (1995). Activity and ranging patterns in relation to fruit utilization by brown capuchins (Cebus apella) in French Guiana. International Journal of Primatology, 16, 489–507.
Zhou, Q., Tang, X., Huang, H., & Huang, C. (2011). Factors affecting the ranging behavior of white-headed langurs (Trachypithecus leucocephalus). International Journal of Primatology, 32, 511–523.