HAL Id: hal-02001834
https://hal.archives-ouvertes.fr/hal-02001834
Submitted on 31 Jan 2019HAL is a multi-disciplinary open access archive for the deposit and dissemination of sci-entific research documents, whether they are pub-lished or not. The documents may come from teaching and research institutions in France or abroad, or from public or private research centers.
L’archive ouverte pluridisciplinaire HAL, est destinée au dépôt et à la diffusion de documents scientifiques de niveau recherche, publiés ou non, émanant des établissements d’enseignement et de recherche français ou étrangers, des laboratoires publics ou privés.
Drying of thin porous disks from pore network
simulations
Nicole Vorhauer, Evangelos Tsotsas, Marc Prat
To cite this version:
Nicole Vorhauer, Evangelos Tsotsas, Marc Prat. Drying of thin porous disks from pore
network simulations. Drying Technology, Taylor & Francis, 2017, 36 (6), pp.651-663. �10.1080/07373937.2017.1319853�. �hal-02001834�
OATAO is an open access repository that collects the work of Toulouse
researchers and makes it freely available over the web where possible
Any correspondence concerning this service should be sent
to the repository administrator:
[email protected]
This is an author’s version published in:
http://oatao.univ-toulouse.fr/21461
To cite this version:
Vorhauer, Nicole and Tsotsas, Evangelos and Prat, Marc
Drying of Thin Porous Disks from Pore Network Simulations.
(2018) Drying Technology, 36 (6). 651-663. ISSN 0737-3937
Official URL:
https://doi.org/10.1080/07373937.2017.1319853
Drying of thin porous disks from pore network simulations
N. Vorhauera, E. Tsotsasa, and M. Pratb,c
aThermal Process Engineering, Otto von Guericke University, Magdeburg, Germany; bINPT, UPS, IMFT (Institut de Mécanique des Fluides de
Toulouse), Université de Toulouse, Toulouse, France; cCNRS, IMFT, Toulouse, France
ABSTRACT
Thin porous media (TPM) are porous layers that are characterized by a small thickness, usually orders of magnitude smaller than the lateral dimensions. We present pore network simulation revealing that drying of TPM is substantially different from drying of thicker porous media because of the impact of the small thickness of only a few pore layers on the liquid phase structure during drying. The small thickness limits the long-distance connectivity within the liquid clusters and thus causes the formation of smaller clusters characterized by shorter residence times. As a result of this stronger and earlier liquid phase fragmentation the drying of TPM is shown to be significantly more sensitive to the distribution of the evaporation flux at the surface. It is also shown that the drying behavior transition from thin to thick porous media is progressive. Moreover, it is discussed how an imposed temperature distribution can be used to control the evolution of the liquid cluster distribution in a TPM and thereby the evolution of the evaporation rate.
KEYWORDS
3D pore network model; drying; nonisothermal; temperature gradient; thin porous disk
Introduction
Pore network models (PNM) are discrete pore scale models well appropriate to analyze the link between the discrete phenomena taking place at the pore scale and the macroscopic behavior at the sample scale. In drying, PNM shed light on the dependency of the macroscopically observed drying rate and overall drying time on pore structure,[1–3] capillary number or Bond number,[4,5] wettability,[6–8] and thermal gradients[9–12] which naturally develop since the evaporation of liquid is basically a nonisothermal process. Exemplarily, Metzger et al.[1] revealed the impact of the presence and interconnection of macropores in drying of capil-lary porous media. They showed that the occurrence and duration of the first drying period can be controlled by adapting the ratio, pore scale interconnection, and arrangement of micro- and macropores in the pore network (PN). The work of Metzger et al.[1] can also be seen as step toward understanding the role of capillary wetting liquid films which are likely to remain in the geometrical singularities of the pore space during drying of porous media. According to Chauvet et al.[8] and Vorhauer et al.[13] the geometrical singularities, such as corners, crevices, etc., can be interpreted as a sub-network of small capillaries with a capillary pressure which can be orders of magnitude higher than the capillary pressure associated with the main pores. If
the macro and micro pores are well interconnected (as also expected in the presence of liquid films) a distinct period of constant drying rates can be simulated with the PNM. Besides this, Yiotis et al.[6] and Prat[7] contributed to the understanding and the prediction of drying in presence of liquid films as they proposed PNM incorporating the film effect based on the studies of corner flow by Ransohoff and Radke.[14] In addition, Vorhauer et al.[13] discussed that the pore scale morphology of the evolving wetting liquid films strongly depends on the pore structure. These authors revealed that liquid film rings can develop in systems with heterogeneous wetting properties and limited interconnection of the solid, such as in a 2D microflui-dic device (as investigated in Vorhauer et al.[13]) or 3D glass bead packings.[2,15] The specific strength of the pore scale model is also revealed in face of the nonisothermal drying experiments studied in Vorhauer et al.,[12] where the pore network is simultaneously invaded by the gas-phase (as a result of evaporation) and the liquid phase (as a result of condensation). This phenomenon is also expected in a wide range of other applications, such as the simultaneous drainage and imbibition in gas diffusion layers (GDL), in fuel cells usually affected by thermal gradients.[16]
Independent of this, thin porous media (TPM) are a particular example for which PNM are, generally, well
adapted because they can simulate the pore scale effects over representative regions covering the full height of the porous medium (which is characterized by a very small expansion over only a few pore layers), without being accompanied by the often mentioned disadvantage of computational time limitation of discrete modeling.[17] Examples of TPM are papers, coatings, membranes, self-assembled layers, self-disposing layers, such as salt crusts or filter cakes and biofilms, or also the fibrous GDL of a proton exchange membrane (PEM) fuel cell.
In this article, we present and discuss isothermal and nonisothermal drying of a thin porous disk. First, we show that for isothermal conditions the nonuniform distribution of the evaporation rate at the surface has a great impact on the drying process if the disk height spans over only a few pore layers. Then we show that the impact of the nonuniform distribution of evapor-ation rate becomes increasingly less important with increasing number of porous layers. The transition from TPM, where the drying process is highly dependent on the local structure of the external mass transfer, to thick porous medium, where the drying process is much less sensitive to the detail of the external mass transfer at the surface, is progressive under isothermal conditions.
Second, we study how the situation changes in pres-ence of a thermal gradient. For this, different in-plane thermal gradients are imposed on the pore networks. We show that, due to the temperature dependency of liquid and vapor transport, presence of a temperature gradient has a significant impact on liquid phase distribution during drying. Comparison of these results to the isothermal drying simulations presented in Vorhauer et al.[18] show that although similar macro-scopic drying rate curves can be expected in the presence of thermal gradients, significant different liquid structures are found when temperature gradients are imposed on the TPM: It is shown that the thermal gradients control the distribution of liquid in this situation. This can be instrumental in case of drying of dispersions, for example, where the thermal gradient could affect the particle distribution of the dispersed solid after drying. Or, if one thinks of the production of the aforementioned GDL, wettability of the porous layer basically depends on the drying step involved in the production process.[19] Control of the homogenous wettability properties is crucial for the operation of the GDL because efficiency of these devices is highly affected by the transfer of reactants and products through the GDL. Thus, understanding the temperature dependency of liquid and vapor migration already during the production of the GDL can, therefore, be seen as a step toward higher operation performances of fuel cell or electrolyzers.
In summary, two different situations shall be discussed in what follows: (i) isothermal drying of a thin porous disk constituted of varying pore layers with the aim to show the dependence of the macroscopic drying process on the length scale to study the transition from TPM to conventional thick porous media and (ii) drying of the thin disk in the presence of radial and lateral thermal gradients with the focus on the impact of thermal gradients on the liquid phase distribution.
3D pore network model of the thin porous disk Pore network structure
The thin porous medium under investigation is represented by a thin disk of diameter ddisk and height
hdisk (Fig. 1) with one open interface found at the top
of the disk; interfaces at the periphery of the disk as well as the disk bottom are impermeable for mass exchange.[18] The void space is represented by cylindri-cal throats, with normal distribution of throat radii, connected by nodes without volume.
Total volume and porosity of the disk, generally, depend on the disk diameter, the disk height, and the lattice spacing. Height of the disk is dictated by the number of pore layers Nk and the vertical lattice spacing
Lv (the vertical lattice spacing is the distance between
two neighbor pores in the vertical direction). Length of a chord Lc in a circular disk layer i, j as well as the
disk diameter depend on the horizontal lattice spacing
Lh instead. More precisely, the total number of nodes
Figure 1. Schematic representation of the pore network disk,
indicating coordinates and geometrical parameters. Note that in most cases studied hdisk �ddisk.
found on a chord of coordinate j, k is computed from: Nið Þ ¼j f ffiffiffiffiffiffiffiffiffiffiffiffiffiffi 1 j2 j j p � � : ð1Þ
The chord length Lc and position z(i, j) of
computational nodes located along the chord in plane
i, j follow from, Lcð Þ ¼j 2 ffiffiffiffiffiffiffiffiffiffiffiffiffiffiffiffiffiffiffiffiffiffiffiffiffiffiffiffiffiffiffiffiffiffiffiffiffiffiffiffiffiffiffiffiffiffiffiffiffiffiffiffiffiffiffiffiffiffiffiffiffiffiffiffiffiffi 2 Nj 1 � j 1 ð ÞL2 h ððj 1ÞLhÞ2 q ð2Þ and z i; jð Þ ¼ Lcð Þj Nið Þj 1 : ð3Þ
Note that an asymmetric structure of the pore space is obtained from Eqs. (1)–(3). The total number of nodes as well as the number of node connections (i.e., the throats) follow from the discretization of network slices in a plane i, j (Fig. 1) at a given disk diameter ddisk.
Mass transfer model
Isothermal and nonisothermal simulation of liquid and vapor transport through the bulk porous medium is basically based on the model presented in Vorhauer et al.[20] with temperature dependent capillary invasion,
Pl rij;Tij � ¼P Pc rij;Tij � ¼P 2r Tij � rij ð4Þ
and nonlinear diffusive vapor transport[21]:
_ Mv;ij¼ prij2 d Tij � Lij ~ MvP ~ RTij ln P Pv;i P Pv;j � � : ð5Þ
Liquid and vapor transport are basically coupled at the gas–liquid interface as illustrated in Fig. 2. The meniscus can remain stationary as long as liquid can be pumped at the current evaporation rate,
_
Ml¼ M_ev: ð6Þ
However, according to the assumption of capillary controlled liquid transfer[20] pumping of liquid is not explicitly computed here. Instead the order of invasion follows the rules of invasion percolation,[22–25], i.e., the throats are invaded in the order of decreasing throat radii. In nonisothermal simulations lateral and radial temperature gradients of varying ΔT are imposed on the discrete layers of the TPM (Fig. 3) affecting the order of emptying according to Eqs. (4) and (5). The temperature dependent parameters in Eqs. (4) and (5), i.e., surface tension σ(Tij), vapor diffusivity δ(Tij) and
saturation vapor pressure P�
vð Þ, are computed from:Ti
ln P � vð ÞTi 133:32 Pa½ �¼18:5848 3984:92 233:426 þ Ti½�C� ; ð7Þ r Tij � ¼ 1:704 � 10 4Tij½�C� þ7:636 � 10 2; ð8Þ d Tij � ¼22:6 � 10 6 Tij½ �K 273 � �1:81 : ð9Þ
From this follows, that in the capillarity controlled drying process the order of emptying can change due to the variation of the surface tension with temperature, if the temperature gradient is high enough (as in the example discussed below). Second, a saturation vapor pressure profile evolves according to the imposed temperature field, leading to vapor pressure gradients significantly different from the ones found in an isothermal drying process. In isothermal drying it is assumed that the vapor pressure is uniform and constant throughout the 2-phase zone of the drying front. It is thus expected that firstly the partially saturated zone screens the saturated zone from evaporation and second that vapor diffuses essentially in one direction from the front toward the open surface of the TPM, where Pv¼P1v ∼ 0. In contrast, in the
nonisothermal situation, vapor diffusion is expected to occur inside the 2-phase zone due to the temperature dependent saturation vapor pressure variation (Eq. 7). This can lead to situations where the vapor diffusion toward a liquid cluster can become higher than the evaporation rate of this cluster. Then, condensation of liquid with refilling of the already dried neighborhood of the liquid cluster can occur. However, condensation of liquid is only partly taken into account in the presented simulations, because the refilling of partially
Figure 2. Balance around the gas–liquid interface of a meniscus
throat ij. Liquid phase in blue and gas phase in white. Although the liquid transport is indicated here by _Ml, liquid flow is not computed; emptying of the TPM is instead computed in the order of decreasing throat radius.
saturated or empty throats is not computed. Instead, the sum of the local cluster evaporation rates P
ij
_
Mev;ij
(and also the evaporation rates of single meniscus throats) is reduced by the sum of the local cluster condensation rates P ij _ Mcond;ij: _ Mev;cl¼ X ij _ Mev;ijþ X ij _ Mcond;ij; ð10Þ with P ij _ Mcond;ij<0. Thus, if X ij _ Mev;ij � � � � � � � � � �< X ij _ Mcond;ij � � � � � � � � � �; ð11Þ
clusters grow at the current condensation rate. Since the cluster growth mechanism is not implemented in this study, _Mev;cl¼0 in this situation.
Finally, vapor diffusivity is increased inside warmer regions, thus it can be expected that these regions can dry out faster.
A key aspect of the drying of the TPM is the coupling between the external vapor transfer in the boundary layer above the open side of the pore network and the internal moisture transfer. Here, several external vapor transfer configurations are possible depending on the particular system considered. In this study, we assume a pure diffusive vapor transfer between the surface of the disk and the external bulk gas phase (with constant air temperature Tair). As reported in Beyhaghi et al.[26]
the diffusive vapor mass flow rate from a wetted disk surface lying on a solid wall can be computed from:
_ Mev¼ X ij 4 ~MvdairL2hPvð Þi p~RTairddisk 1 2r ið Þ ddisk � �2! 1=2 ; ð12Þ
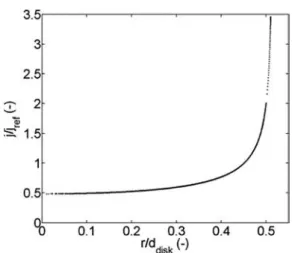
with radial coordinate r(i) of throat ij, horizontal lattice spacing Lh and disk diameter ddisk. As will be shown
in what follows, solution of Eq. (12) yields locally dependent evaporation rates (Fig. 7) at the disk surface, with minimum evaporation rates in the disk center and maximum rates at the periphery.
Pore network simulations
Focus of the numerical investigation is on the impact of two different effects on the drying behavior: (i) the effect of the scale transition from a thin porous disk to a (tra-ditional) thick porous disk at constant disk temperature and (ii) the effect of lateral and radial temperature gradients along the disk layers (Fig. 3) and constant temperature Tair of the bulk air phase above the
TPM.[18] For obvious reasons, vertical temperature gradients can usually be excluded when the porous medium is thin enough. Both investigations involve different parameter settings as specified in Table 1.
The pore size distribution of the TPM is given in Fig. 4. The (radial and lateral) temperature distributions
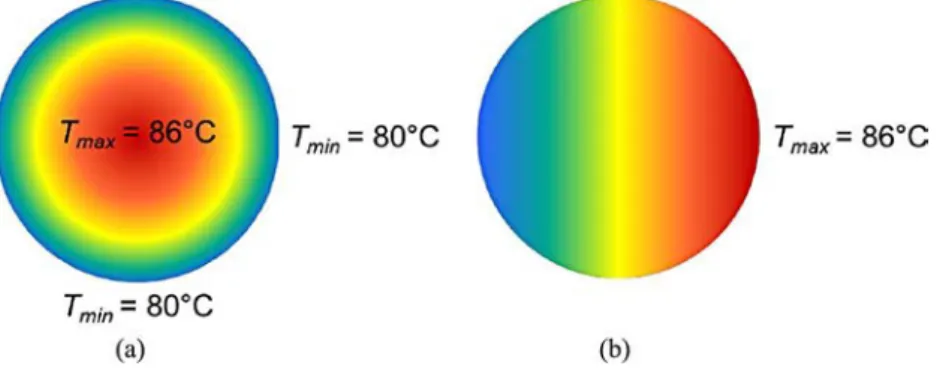
Figure 3. Graphical representation of (a) radial and (b) lateral temperature field (by a representative TPM layer). The temperature varies horizontally between T ¼ 80°C and T ¼ 86°C in both situations (i- and j-direction) leading to a temperature gradient of ∼2.5°C mm 1 in the simulation with lateral temperature gradient and ∼5°C mm 1 in the simulation with radial temperature gradient.
The temperature remains constant in vertical direction (k-direction).
Table 1. Set of parameters for the study of length scale
transition and the study of the temperature effect. Study of pore
scale transition
Study of temperature effect
Pore network geomentry Size of PN, Nmax
i �Nj max 99 � 99
Number of surface pores 4901 Pore size distribution, rij 5 � 0.3 µm
Total number of nodes 24,505–196,040 24,505 Total number of throats 58,028–565,773 58,028 Vertical lattice spacing, Lv 25 µm 25, 250 µm
Horizontal spacing, Lh 25 µm
Disk diameter, ddisk 2.45 mm
Disk height, hdisk 75 µm–975 mm 100, 1000 µm
Temperature ranges Isothermal pore network 80°C
Radial temperature field – 80–86.125°C Lateral temperature field – 80–86.37°C Air temperature, Tair 80°C 82°C (radial T-field)
83.17°C (lateral T-field) Pressure
Total pressure P 1 bar Bulk vapor pressure, P1
applied in the study of non-isothermal drying are given in Fig. 3. In both situations, temperature varies linearly with coordinate i (lateral temperature field) and j (radial temperature field) (Fig. 1). It must be remarked that the air temperature did not vary in non-isothermal drying
simulations, instead it was kept constant at T ¼ 82°C in the simulation with radial temperature field and
T ∼ 83.17°C in the simulation with lateral temperature
field.
It must, furthermore, be noted that the number of pores in horizontal planes was kept constant. But, as can be seen, two different approaches were applied to increase the disk height. In the study of the scale tran-sition, the vertical lattice spacing was kept constant at
Lv ¼25 µm but the number of pore layers was
succes-sively increased from Nk ¼4 to Nk ¼40, thus increasing
the disk height from hdisk ¼75 µm (thin disk) to
hdisk ¼975 µm (thick disk). In contrast to this, the
distinct disk heights investigated in case (ii), i.e., drying under imposed nonisothermal conditions, were obtained for constant number of pore layers (Nk ¼5)
but two distinct values of the vertical lattice spacing (Lv ¼25 µm and Lv ¼250 µm).[18] Independent of the
choice of the approach, the increase of the disk height has a direct impact on the aspect ratio of the porous disk (Fig. 5a) as well as on the total volume of the void space (Fig. 5b, c). In the nonisothermal simulation with
Lv ¼[25, 250] µm additionally porosity is affected by
the increase of the height of the disk (Fig. 5d); while a constant porosity of around φ ¼ 24.25% is achieved in
Figure 4. Pore size distribution for total number of throats
Nt ¼565773 (i.e., referring to the pore network with Nk ¼40). In simulations with less throats (Nk ¼[4, 5, 10, 20, 30]) a representative part is extracted from this distribution without violating the pore size distribution.
Figure 5. Dependency of (a) aspect ratio, (b), (c) total void volume, and (d) porosity on disk height hdisk. Notice that different
functions are obtained for the total void volume depending on the approach: (b) shows the function for Lv ¼const. and Nk ¼2–40 (study of the scale transition), (c) shows the function for Lv ¼0–245 µm and Nk ¼5 (adapted from Ref.[18]). The intercept of the function with the ordinate in (c) is related to the total volume contained in horizontal throats with length Lh. Porosity in (d), however, varies with Lv but is constant for varying Nk (φ ¼ 24.25% ¼ const. in the study of the scale transition).
the isothermal simulation with Lv ¼25 µm ¼ const. if
length (and volume) of throats are kept constant in the simulations.
As a consequence of the functions presented in Fig. 5b, c the total void volume must increase with increasing disk height. This affects again the overall drying time, since more liquid must be removed from the network with greater number of throats at else constant throat radius distribution. Moreover, as will be discussed below, the diffusion resistance increases with increasing distance of meniscus throats from the disk surface which impacts on the overall dying rate.
Dependence of the overall evaporation rate on the disk diameter is given in Fig. 6, for both, the numerical solution of Eq. (12) and the analytical solution assuming a fully saturated disk surface[27]:
_
M0ev¼2M~v~dairddisk
RTair
P�v: ð13Þ
It is found that the ratio of _Mev= _M 0
ev is constant at
0.5041. This is explained with the discrete nature of the TPM model and the approximate representation of the disk shape with the TPM model (compare, e.g., with Suzuki and Maeda[28]). As indicated in Fig. 7, where the dimensionless local evaporation flux is plotted against the dimensionless lateral position at the disk surface, the ratio of _Mev= _M
0
ev could be increased
by adding additional interfacial throats at the disk periphery, where the highest local evaporation rates are found, since this would increase the overall evaporation rate _Mev as computed from Eq. (12).
However, although this would directly affect the ratio _
Mev= _M 0
ev, an impact on the overall drying phenomenon
is not expected. More clearly, from the evaporation profile given in Fig. 7 it must be expected that more liquid can be evaporated from the periphery of the disk then compared to the disk center (where the evaporation rate is lower) independent of the ratio _Mev= _M
0
ev. This is
one of the main issues discussed in this paper. As will be shown, the imposed profile on external vapor transfer rates dominates invasion of the pore space during the complete drying process, if the disk is sufficiently thin. However, with increasing thickness of the disk (in terms of pore network layers) this impact is lost.
Simulation results
Study of the length scale transition
In this section, simulation results for varying disk height assuming constant and uniform temperature of 80°C are presented and discussed. In this study, vertical and horizontal lattice spacing are kept constant at Lv ¼Lh ¼
25 µm (Table 1). The disk diameter is ddisk ¼2.45 mm
and the height of the disk is varying between hdisk ¼75
and 975 µm according to the number of disk layers
Nk (Nk ¼4–40). Drying of the disk with Nk ¼10 is
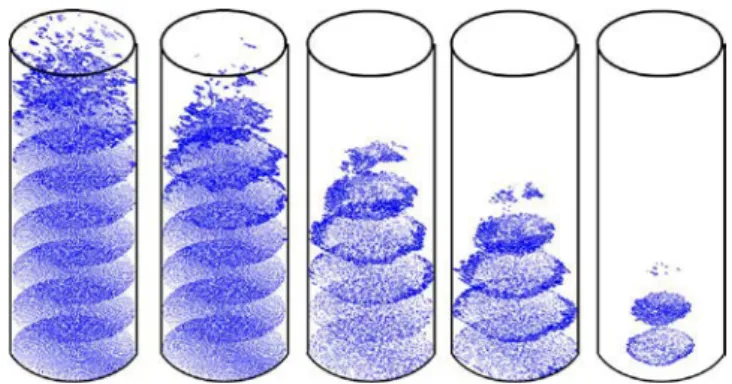
illustrated in Fig. 8. In Fig. 8, only the in-plane liquid saturated network throats are illustrated for the purpose of comprehensibility. Figure 8 shows that two types of drying fronts can be distinguished in drying of the TPM: (i) the drying front penetrating the TPM from the surface toward the bottom and (ii) the in-plane drying fronts that penetrate each layer of the TPM from the periphery toward the center. While the first type of drying front is typically expected for the drying of
Figure 7. Position dependent dimensionless evaporation
flux from the disk surface, with j ¼ ð _Mev=L2hÞ and
jref¼2
dairddiskM~vP�vðTairÞ ~
RTairp4ddisk2 . Note that the curve is also tempera-ture independent if _Mev (Eq. 12) is computed for the assumption
of Pv¼P�v¼const.
Figure 6. Dependence of initial overall evaporation rate on
porous media, the second type is related to the impact of the external vapor transfer conditions. According to the profile shown in Fig. 7, drying rates are higher at the periphery of the TPM. More precisely, disconnection of the liquid phase, naturally evolving from the invasion of the TPM, leads to the interruption of capillary mass transfer. The developing disconnected liquid clusters are evaporated and moisture is transferred in the vapor phase instead. However, according to the high external vapor transfer rates at the periphery, disconnected clusters at the periphery dry out earlier than clusters in the center of the disk. This leads to a macroscopic retreat of liquid from the periphery to the center of the disk. This is similar to the drying of a free liquid surface lying on a plate, which would also retreat from its maximal lateral extension at the beginning of drying toward the center at the end of the drying process. As will be discussed in what follows, this effect is only found in a TPM. If the height of the disk is increased, a continuous transition toward the classical thick porous medium is observed and the radial evolution of the liquid phase seen in TPM progressively vanishes (Fig. 9).
Figure 10 compares the top view of the phase distributions at network saturation of S ∼ 0.1 for the varying disk heights with Nk ¼[4, 10, 20, 30, 40]. Fully
saturated throats are shown in blue and empty throats are not plotted in Fig. 10. The striking difference between the phase distributions in Fig. 10 is the saturation of the disk periphery. In the thin disks with
Nk ¼4 and Nk ¼10, invasion is primarily observed at
the disk periphery resulting in a radial drying front which penetrates the disk from the periphery to the disk center. This is explained with higher evaporation rates at the periphery (according to Fig. 7) and also the stron-ger fragmentation of the liquid phase in small clusters due to the fact that the gas phase invasion in the depth of the medium rapidly stops owing to the small number
of pores over the medium thickness. Consistently, Figs. 9 and 10 reveal that a different situation must be expected in the thick porous disks. The disks with
Nk ≥ 20 dry out at the west and east periphery before
the drying front recedes into the disk center. This obser-vation cannot be explained with the local evaporation rate variation presented in Fig. 7. Instead, the asym-metry of the disk pore structure (Eqs. 1–3) affects the order of emptying. Less computational nodes are found at the west and east periphery than in the north and south. Thus, drying of the west and east periphery can be faster than throughout the disk layer.
Comparison of the saturation profiles in Fig. 11 (for
Nk ¼[4, 10, 20, 40]) illustrates the progressive scale
transition from the TPM to a thick porous medium. While the liquid saturation decreases almost linearly in case of the TPM with Nk ¼4, a liquid plateau evolves
in the thicker networks. It must be noticed that these saturation profiles are typical for drying processes with initial constant drying period.[1] The continuous tran-sition from the TPM to drying of a (traditional) thick porous medium with distinct drying periods becomes more clearly when regarding the drying rate curves in Fig. 12a. Figure 12a illustrates that invasion of the thick disk is affected by the external vapor transfer structure primarily at the beginning of drying, when the surface of the disk is invaded. The profile in Fig. 7 allows for a distinct first drying period when Nk ≥ 20. This is in
con-trast to the situations discussed in Vorhauer et al.[18] where the number of nodes was kept constant and instead the height of the disk was increased by increasing the vertical lattice spacing, i.e., the vertical distance between the PN nodes. Although an impact on the dry-ing rates could be shown, no first drydry-ing period could be
Figure 8. In-plane gas–liquid phase distributions for drying of the TPM with Nk ¼10. Liquid phase in blue, gas phase in white. The vertical connection throats between the layers are not shown, S ¼ [0.6, 0.48, 0.32, 0.21, 0.035].
Figure 9. In-plane gas–liquid phase distributions for drying
of the TPM with Nk ¼40 (S ¼ 0.1). Only the ten wet layers are shown in this image; all other layers are completely dry. The in-plane drying front is not circular (as in the TPM) but drying occurs from the sides (east and west), where due to asymmetry of the porous disk less computational nodes are found (Eqs. 1–3).
Figure 12. Normalized drying rate curves _Mev= _MevðS ¼ 1Þ (a) and drying curves (b) for varying disk height (hdisk ¼[75, 225, 475,725,
975] µm).
Figure 10. Gas–liquid phase distributions at the end of drying (top view). Shown are the results for S ∼ 0.1 and hdisk ¼[75, 225, 475,
725, 975] µm. Fully saturated throats in blue and empty throats are not shown.
Figure 11. Saturation profiles through the TPM, hdisk ¼[75, 225, 475, 975] µm in (a)–(d), respectively. The profiles are shown for
overall TPM saturations S ∼ [0.9, 0.8, 0.7, 0.6, 0.5, 0.4, 0.3, 0.2, 0.1] for each realization of disk height. Note that the position is made dimensionless (h/hdisk) allowing direct comparison of the saturation for distinct percentage of hdisk. (Note that S ¼ 0 in completely dry
computed in Vorhauer et al.[18] This is associated with the constant number of PN layers. However, an overall agreement of drying phenomena can be found for both situations, i.e., with constant number of disk layers and increasing vertical lattice spacing Lv (as in
Vorhauer et al.[18]) and with constant lattice spacing but increasing number of disk layers as presented here. Both investigations reveal that high drying rates over the longest period of drying are found when the thin disks are dried. Half of the initial drying rate is reached at S ∼ 0.1. By contrast, drying of a thicker porous medium shows earlier drop of drying rates. This is explained with the increase of the internal diffusion resistance (longer internal diffusion path up to the TPM surface), which is much less in the case of a thinner disk. However, increase of the drying time in Fig. 12b must not only be associated with the decreasing evaporation rates but also with the increasing overall void volume of the porous disk, with,
V ¼
X
ij
prij2Lij: ð14Þ
Investigation of the pure diffusion effect would imply constant void volume and virtually relocation of computational nodes.
In summary it is concluded, that the external vapor transport conditions dominate drying of the thin disk during the complete drying process while internal structural properties (such as the in-plane asymmetric distribution of pores and pore throats) have a minor impact. In contrast in the thick disks, the structural parameters dominate the invasion process and the external mass transfer conditions play a minor role for the evolving gas–liquid phase distributions. This is explained by the greater and more rapid fragmentation of the liquid phase in smaller clusters in TPM compared to thicker porous media. Secondly, from the saturation profiles and the drying rate curves it is concluded that the transition from TPM to thick porous media is progressive. While no distinct drying periods can be distinguished in case of a TPM, a period of initial con-stant drying rate emerges if the height of the disk is increased.
Study of the thermal impact of invasion
Since drying is usually a nonisothermal process it is worth investigating the impact of thermal gradients on the invasion of the TPM because the transport of vapor and liquid is principally temperature controlled and thus might be an instrument to control the pore level moisture transfer in a TPM. It is highlighted that
thermal gradients are also expected in the above- mentioned example of a GDL.
Two different temperature gradients have been imposed on the TPM. A gradient with temperature increasing from the periphery toward the center of the TPM (also referred to as the radial temperature gradi-ent) and a gradient with temperature increasing from the west periphery toward the east periphery of the disk (also referred to as the lateral temperature gradient). In both cases temperature increases linearly from T ¼ 80°C to T ∼ 86°C (as in Wang et al.[15]) leading to a tem-perature gradient of ∼2.5°C mm 1 (in i-direction) in the simulation with lateral temperature gradient and ∼5°C mm 1
(in i- and j-direction) in the simulation with radial temperature gradient. Simulations have been repeated for varying disk height (with Nk ¼5
and Lv ¼[25, 250] µm) (Table 1).
As expected and shown in Fig. 13, the liquid distri-bution is influenced by the direction of the imposed temperature gradients. As can be seen from Fig. 13, both the radial and the lateral temperature fields, lead to phase distributions significantly different from isothermal drying where the invasion process is controlled by the imposed external vapor flux distribution (Fig. 10). According to Eqs. (4) and (8) liquid pressure increases with increasing temperature. This has a major impact on the order of invasion in the capillarity controlled drying regime. Since the order of invasion is computed from the order of decreasing liquid pressure, liquid menisci that can be associated with the highest liquid pressure are invaded. From Eqs. (4) and (8) follows that either the menisci with the greatest radius or the menisci with the greatest temperature can produce the highest liquid pressure. Consequently, in the system with randomly distributed throat size, the TPM starts drying in regions with higher temperatures. Thus, liquid recedes from the center to the periphery in case of the radial temperature gradient and from east to west in case of the lateral temperature gradient. In addition to the temperature dependency of capillarity, saturation vapor pressure (Eq. 7) as well as the vapor diffusivity (Eq. 9) grow with increasing temperature. Accordingly, the vapor flow rates computed from Eq. (5) are higher in regions with increased temperature. This contributes to the preferential evaporation of liquid in warmer TPM regions. When disconnection of the liquid phase leads to interruption of capillary pumping, then evaporation (and condensation) of isolated clusters and single menisci dominate the evolving phase distributions. This is a completely different situation than in the isothermal simulation where the evolution of the liquid distribution in the TPM is controlled by the external vapor mass transfer structure. According to discussions in
Vorhauer et al.[12] it is strongly expected that thickness of the annular traveling zone (in case of a radial thermal gradient) depends on the magnitude of the temperature gradient and the overall evaporation rate as well. This is highlighted in Fig. 14, where the top view of the phase distributions are given for overall higher temperature variation (T ¼ 50°C to T ∼ 86°C).
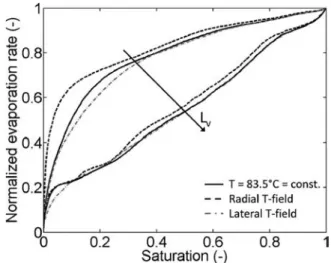
Nevertheless, although pore level moisture migration is completely different in the thermal affected drying processes, comparison of the normalized evaporation rates in Fig. 15 indicate that this impact might likely be overseen in the macroscopic analysis of the drying process. Figure 15 illustrates that the impact of the disk thickness in the temperature affected drying simulation appears overall very similar to the isothermal drying simulation (with Nk ¼5, Lv ¼[25, 250 µm] and
T ¼ 83.5°C).
It must be highlighted that the direction of liquid migration is important in drying processes incorporat-ing crystallization effects[29] or transport of dispersed particles, because the final distribution of particles
inside the solid matrix depends on liquid pumping effects and the order of emptying of the pore space.[30] Imposing of thermal gradients might thus be instrumental to control the pore level transport in TPM. Moreover, temperature affected mass transfer plays a role in the example of the GDL during operation—here one would like to obtain optimum water and gas saturation to allow for continuous transportation of reactants and products.
Conclusion and outlook
Owing to the small thickness of TPM compared to the typical length scale of external mass transfer (the disk diameter in our example), drying of TPM is distinct from drying of conventional samples. In contrast to the
Figure 14. Gas–liquid phase distributions at the end of drying
(top view). Simulations with lateral and radial temperature field (T ¼ 50–86.75°C) but higher thermal gradients than presented in Figure 13 (7.35°C mm 1 in the simulation with lateral
temperature gradient and 15°C mm 1 in the simulation with radial temperature gradient) (Lv ¼25 µm).
Figure 15. Comparison of normalized evaporation rates
ð _Mev= _MevðS ¼ 1ÞÞ. Simulations with lateral and radial
tempera-ture field (T ¼ 80–86°C) and T ¼ 83.5°C ¼ const. (Lv ¼25 µm and 250 µm). Note that the radial temperature field positively affects drying rates in case of the distribution of evaporation rates as shown in Figure 7.
Figure 13. Gas-liquid phase distributions at the end of drying (top view). Simulations with lateral and radial temperature field (with
parameter setting according to Table 1 and the temperature field specified in Figure 3) and Lv ¼25 µm. Comparison to isothermal simulation with T ¼ 83.5°C ¼ const. The phase distributions are shown for S ∼ 0.15 (non-isothermal drying) and S ∼ 0.18 (isothermal drying).
classical description of the drying kinetics in three main phases where the external mass transfer dictates the evaporation rate essentially in the first phase of drying (corresponding to the classical constant rate period), the coupling between the external and internal mass transfer is expected to be strong all along the drying of a TPM. This effect was shown on the example of a porous disk with length scale transition from TPM (number of pore layers Nk �10) to thick porous disks
with a greater number of pore layers. Comparison of drying rate curves from pore networks with increasing disk height evidenced a progressive transition from the TPM (without distinct drying periods) to drying of traditional porous media with distinct first drying periods. Furthermore, illustration of the in-plane gas– liquid phase distributions clearly evidenced formation of two different drying fronts: a front penetrating the TMP from the surface (as in a classical invasion process) and in-plane drying fronts, penetrating the sublayers of the TMP from the periphery. This drying behavior was explained by the combined effect of the earlier and more significant fragmentation of the liquid phase in small clusters and the imposed evaporation profile at the top of the TPM. By increasing the disk height, it could be shown that the coupling of the external vapor transfer and the distribution of gas and liquid phase diminishes in thicker disks. Instead, it could be shown (by appli-cation of in-plane asymmetric pore structure) that with the transition from a TPM to a thick porous medium the structural parameter control the drying process. These findings imply to develop efficient coupling strat-egy between the evolution of the phase distribution within the TPM and the modeling of the external mass transfer. In this respect, the presented rather simple approach of coupling pore network simulations and an analytical formula corresponding to the evaporation from a wetted disk in a half-space, needs to be improved. It is proposed to use instead the concept of the equivalent wetted disk so as to take into account the shrinking of the wetted zone within the PN model. Still more challenging but more accurate would be to numerically recompute the external mass transfer after each pore/throat invasion. Another aspect that has been disregarded in our simulations is the role of wetting liquid films in TPM. However, it is expected that due to the small expansion of the TPM, liquid films are likely to cover the TPM in the through-plane direction over most of the drying process. It is thus proposed to investigate the dependence of the extent of the film region and the impact of the film transport on the height of the TPM.
The presented simulations have also illustrated the fact that the structure of the evaporation flux distri-bution at the TPM surface has a significant impact
because the formation of disconnected liquid clusters is facilitated in a system with much less pores in the through-plane direction compared to the in-plane direc-tions. As a result, the disconnected clusters will evapor-ate faster where the evaporation revapor-ate is greevapor-ater. This was at the periphery of the system in our example. As shown in Veran-Tissoires et al.[31] it is possible to make the evaporation flux much more uniform at the disk surface by placing the disk in a shallow cavity. This offers a sim-ple mean for controlling the liquid distribution evolution during drying. Another possibility, well-illustrated by some of our simulations, is to play with the in-plane temperature distributions. For example, a traveling annular liquid ring was predicted when imposing a radial thermal gradient while the drying front travels laterally in the case of a lateral thermal gradient. These findings are instrumental in controlling the drying process of TPM and could be useful to better control the drying of salt solutions and dispersions, as the final particle distribution inside the solid matrix depends on the evolution of gas–liquid distributions during drying.[29,30]
Nomenclature
i,j,k PN coordinates
ddisc disk diameter (m)
hdisc disk height (m)
j evaporation flux (kg m 2 s 1)
Lc chord length of disk (m)
Lij length of throat (m)
Lh length of horizontal throats (m)
Lv length of vertical throats (m)
_
Mcond condensation rate (kg s 1)
_
Mev evaporation rate (kg s 1)
_
Ml liquid flow rate (kg s 1)
~
Mv molar mass (kg kmol 1)
_
Mv;ij local diffusion rate (kg s 1)
Ni, j, k number of nodes
P total pressure (Pa)
Pc capillary pressure (Pa)
Pv, i, j local vapor pressure (Pa)
P�
v saturation vapor pressure (Pa)
Pl liquid pressure (Pa)
r radial coordinate (m) ~
R universal gas constant (kJ K 1 mol 1)
rij throat radius (m)
S liquid saturation
T temperature (K)
Tair temperature of bulk air (K)
Ti, ij throat and pore temperature (K)
V volume (m3)
Greek letters
φ porosity (%)
δ diffusion coefficient (m2 s 1)
σ surface tension (N m 1)
σ0 standard deviation (m) Subscripts and superscripts
cl cluster
i, j, k, ij pore and throat index
i, j, k PN coordinates
max maximum (temperature) min minimum (temperature)
0 reference
∞ bulk phase
Abbreviations
GDL gas diffusion layer
PEM proton exchange membrane
PN pore network
PNM pore network model TPM thin porous media
References
[1] Metzger, T.; Irawan, A.; Tsotsas, E. Influence of Pore Structure on Drying Kinetics: A Pore Network Study.
AIChE J. 2007, 53(12), 3029–3041.
[2] Wang, Y.; Kharaghani, A.; Metzger, T.; Tsotsas, E. Pore Network Drying Model for Particle Aggregates: Assessment by X-ray microtomography. Drying Technol.
2012, 30, 1800–1809.
[3] Rahimi, A.; Metzger, T.; Kharaghani, A.; Tsotsas, E. Interaction of Droplets with Porous Structures: Pore Network Simulation of Wetting and Drying. Drying
Technol. 2016, 34, 1129–1140.
[4] Prat, M.; Bouleux, F. Drying of Capillary Porous Media with a Stabilized Front in Two Dimensions. Phys. Rev. E
1999, 60(5, Part B), 5647–5656.
[5] Metzger, T.; Irawan, A.; Tsotsas, E. Isothermal Drying of Pore Networks: Influence of Friction for Different Pores Structures. Drying Technol. 2007, 25, 49–57.
[6] Yiotis, A. G.; Boudouvis, A. G.; Stubos, A. K.; Tsimpanogiannis, I. N.; Yortsos, Y. C. Effect of Liquid Films on the Drying of Porous Media. AIChE J. 2004,
50, 2721–2731.
[7] Prat, M. On the Influence of Pore Shape, Contact Angle and Film Flows on Drying of Capillary Porous Media.
Int. J. Heat Mass Transf. 2007, 50, 1455–1468.
[8] Chauvet, F.; Duru, P.; Geoffroy, S.; Prat, M. Three Periods of Drying of a Single Square Capillary Tube.
Phys. Rev. Lett. 2009, 103, 124502.
[9] Huinink, H. P.; Pel, L.; Michels, M. A. J.; Prat, M. Drying Processes in the Presence of Temperature Gradients -Pore-Scale Modelling. Eur. Phys. J. E 2002, 9, 487–498. [10] Plourde, F.; Prat, M. Pore Network Simulations of Drying of Capillary Porous Media. Influence of Thermal Gradients. Int. J. Heat Mass Trans. 2003, 46, 1293–1307. [11] Surasani, V.; Metzger, T.; Tsotsas, E. Drying Simulations of Various 3D Pore Structures by a Non-Isothermal Pore Network Model. Drying Technol. 2010, 28, 615–623.
[12] Vorhauer, N.; Tsotsas, E.; Prat, M. Temperature Gradient Induced Double Stabilization of the Evaporation Front Within a Drying Porous Medium. submitted. 2017.
[13] Vorhauer, N.; Wang, Y. J.; Kharaghani, A.; Tsotsas, E.; Prat, M. Drying with Formation of Capillary Rings in a Model Porous Medium. Transport in Porous Media
2015, 110(2), 197–223.
[14] Ransohoff, T. C.; Radke, C. J. Laminar Flow of Wetting Liquid along the Corners of a Predominantly Gas-Occupied Noncircular Pore. J. Coll. Interface Sci. 1988,
121, 392–398.
[15] Wang, Y. J.; Kharaghani, A.; Tsotsas, E. Pore-scale Visualization and Simulation of Liquid Films for Drying Particle Packing. In Proceedings of EuroDrying, 2–4 October 2013. Paris/France, 2013.
[16] Straubhaar, B.; Pauchet, J.; Prat, M. Pore Network Modelling of Condensation in Gas Diffusion Layers of Proton Exchange Membrane Fuel Cells. Int. J. Heat Mass
Trans. 2016, 102, 891–901.
[17] Prat, M.; Agaësse, T. Thin Porous Media. In Handbook
of Porous Media, Vafai, K. ed.; CRC Press, 2015; pp.
89–112.
[18] Vorhauer, N.; Rahimi, A.; Tsotsas, E.; Prat, M. Non-isothermal Drying of Thin Porous Disks. In Pro-ceedings of the 20th International Drying Symposium (IDS 2016), 7–10 August 2016. Gifu/Japan, 2016. [19] Inoue, G.; Ishibe, N.; Matsukuma, Y.; Minemoto, M.
Understanding Mechanism of PTFE Distribution in Fibrous Porous Media. ECS Trans 2013, 50(2), 461–468. [20] Vorhauer, N.; Tran, Q. T.; Metzger, T.; Tsotsas, E.; Prat, M. Experimental Investigation of Drying in a Model Porous Medium: Influence of Thermal Gradients.
Drying Technol. 2013, 31, 920–929.
[21] Tsotsas, E.; Metzger, M.; Gnielienski, V.; Schluender, E. U. Drying of Solid Materials. In Ullmann’s
Encyclopedia of Industrial Chemistry, Wiley-VCH Verlag
GmbH & Co. KGaA: Weinheim, 2012, pp. 581–619. [22] Wilkinson, D.; Willemsen, J. F. Invasion Percolation:
A New Form of Percolation Theory. J. Phys. A: Math.
Gen. 1983, 16, 3365–3376.
[23] Yiotis, A. G.; Tsimpanogiannis, I. N.; Stubos, A. K. Fractal Characteristics and Scaling of the Drying Front in Porous Media: A Pore Network Study. Drying
Technol. 2010, 28, 981–990.
[24] Vorhauer, N.; Metzger, T.; Tsotsas, E. Empirical Macroscopic Model for Drying of Porous Media Based on Pore Networks and Scaling Theory. Drying Technol.
2010, 28, 991–1000.
[25] Prat, M.; Veran-Tissoires, S.; Vorhauer, N.; Metzger, T.; Tsotsas, E. Fractal Phase Distribution and Drying: Impact on Two-Phase Zone Scaling and Drying Time Scale Dependence. Drying Technol. 2012, 30, 1129–1135. [26] Beyhaghi, S.; Geoffroy, S.; Prat, M.; Pillai, K. M. Wicking and Evaporation of Liquids in Porous Wicks: A Simple Analytical Approach to Optimization of Wick Design.
AIChE J. 2014, 60(5), 1930–1940.
[27] Picknett, R. G.; Bexon, R. The Evaporation of Sessile or Pendant Drops in Still Air. J. Colloid Interfac Sci 1977,
61, 336–350.
[28] Suzuki, M.; Maeda, S. On the Mechanism of Drying of Granular Beds. J. Chem. Engng Japan 1968, 1, 26–31.
[29] Eloukabi, H.; Sghaier, N.; Nasrallah, S. B.; Prat, M. Experimental Study of the Effect of Sodium Chloride on Drying of Porous Media: The Crusty–Patchy Efflorescence Transition. Int. J. Heat Mass Trans. 2013,
56(1), 80–93.
[30] Boernhorst, M.; Walzel, P.; Rahimi, A.; Kharaghani, A.; Tsotsas, E.; Nestle, N.; Besser, A.; Kleine Jaeger, F.;
Metzger, T. Influence of Pore Structure and Impregnation–Drying Conditions on the Solid Distribution in Porous Support Materials. Drying
Technol. 2016, 34, 1964–1978.
[31] Veran-Tissoires, S.; Marcoux, M.; Prat, M. Discrete Salt Crystallization at the Surface of a Porous Medium. Phys.


![Figure 11. Saturation profiles through the TPM, h disk ¼ [75, 225, 475, 975] µm in (a)–(d), respectively](https://thumb-eu.123doks.com/thumbv2/123doknet/14310145.495193/10.890.180.684.818.1054/figure-saturation-profiles-tpm-h-disk-µm-respectively.webp)