HAL Id: hal-03033069
https://hal.archives-ouvertes.fr/hal-03033069
Submitted on 1 Dec 2020HAL is a multi-disciplinary open access
archive for the deposit and dissemination of sci-entific research documents, whether they are pub-lished or not. The documents may come from teaching and research institutions in France or abroad, or from public or private research centers.
L’archive ouverte pluridisciplinaire HAL, est destinée au dépôt et à la diffusion de documents scientifiques de niveau recherche, publiés ou non, émanant des établissements d’enseignement et de recherche français ou étrangers, des laboratoires publics ou privés.
New insights into the physics of rotating spokes in
partially magnetized E x B plasmas
Jean-Pierre Boeuf, M. Takahashi
To cite this version:
Jean-Pierre Boeuf, M. Takahashi. New insights into the physics of rotating spokes in partially mag-netized E x B plasmas. Physics of Plasmas, American Institute of Physics, 2020, 27 (8), pp.083520. �10.1063/5.0014357�. �hal-03033069�
1
New insights into the physics of rotating spokes
in partially magnetized
𝑬 × 𝑩
plasmas
J.P. Boeuf
1,a, M. Takahashi
21LAPLACE, Université de Toulouse, CNRS, INPT, UPS, 118 Route de Narbonne, 31062 Toulouse, France 2Department of Aerospace Engineering, Tohoku University, Sendai, 980-8579, Japan
ABSTRACT
Regions of enhanced light emission rotating in the azimuthal direction (“rotating spokes”) have been observed in different types of partially magnetized 𝐸 × 𝐵 plasma devices such as magnetron discharges and Hall thrusters. A two-dimensional Particle-In-Cell Monte Carlo Collisions (PIC MCC) model is used to study the formation of these rotating structures. The model shows that these current driven rotating structures are the results of a Simon-Hoh instability evolving into an ionization instability. The spoke is sustained by local electron heating induced by 𝛁𝐵 drift along a double layer separating the cathodic presheath from the plasma at a potential close to the anode potential. The PIC MCC simulations predict that spoke rotation can take place in the +𝐸 × 𝐵 direction as well as in the −𝐸 × 𝐵 direction depending on the magnetic field intensity.
I. INTRODUCTION
Magnetron discharges used in plasma processing, e.g. in sputtering-deposition reactors (HiPIMS, High Power Impulse Magnetron Sputtering) have been the subject of many research works and publications in the last ten years. In these devices, electrons are strongly magnetized by a transverse magnetic field while the practically collisionless ions are accelerated in the cathode sheath toward the cathode and sputter atoms from the cathode surface.
The magnetic configuration of Hall thrusters shares some similarities with that of magnetrons discharges but the purpose here is not to accelerate ions toward a surface but rather to produce thrust by ejecting ions at high speed away from the thruster. An electron emissive cathode is used in order to allow ion acceleration and extraction through a quasineutral plasma as well as to neutralize the ion beam space charge.
The large electron drift and negligible ion drift (ions are practically not magnetized) in the azimuthal, 𝐸 × 𝐵 direction of magnetrons and Hall thrusters tend to create a charge separation and trigger instabilities. Instabilities at a variety of wavelengths and frequencies rotating in the azimuthal direction have been observed in these devices. A number of recent papers have been devoted to the study of the Electron Cyclotron Drift Instability (ECDI), a micro-instability that seems to develop in the region of increasing magnetic field between the cathode and the channel entrance of a Hall thruster1-9 and evolves into an ion acoustic instability4, 6, 8. In the present paper we focus on another type of instability, qualified as “rotating spoke”, that is much easier to observe experimentally. This type of instability tends to develop in the region of decaying magnetic field between cathode and anode in a magnetron discharge and between the channel entrance and the anode in Hall thrusters.
a Electronic mail: [email protected]
We show in this paper that two-dimensional (2D) PIC MCC simulations taking into account, self-consistently, plasma sustainment predict the formation of rotating regions of enhanced ionization that are very similar to the rotating spokes observed in the experiments. As in the experiments, these rotating spokes can rotate in the direct or retrograde 𝐸 × 𝐵 direction, depending on the conditions, and at velocities typically less than 10 km/s in argon. We show that electron heating associated with 𝛁𝐵 drift in the bulk plasma plays an essential role in the formation and sustainment of the ionization instability that controls the spoke motion. The spoke front is located at the boundary between a quasi-equipotential plasma and a region of larger electric field. Under some conditions (large enough magnetic field on the anode) this boundary can form a double layer where electron vortices develop and move at a velocity on the order of the average 𝐸 × 𝐵 drift velocity.
The paper is organized as follows. Section II summarizes a non-exhaustive selection of previous papers describing rotating spokes in magnetrons and Hall thrusters. The conditions of the simulations and the 2D PIC MCC model are briefly described in section III. Section IV presents simulations under conditions “similar” (in the sense of discharge similarity laws) to those of the experiments of Ito et al.10 on a miniature dc magnetron discharge and discusses the physics of the formation of the instability leading to the development of rotating spokes. In these simulations we observe the formation of a spoke rotating in the −𝐸 × 𝐵direction (as in the experiments). In section V we illustrate the fact that rotation in the −𝐸 × 𝐵 as well as in the +𝐸 × 𝐵 direction is possible. The direction of rotation changes from −𝐸 × 𝐵 to +𝐸 × 𝐵 in the simulations if the magnetic field at the cathode surface is decreased.
2
II. ROTATING SPOKES IN MAGNETRONS AND HALL THRUSTERS
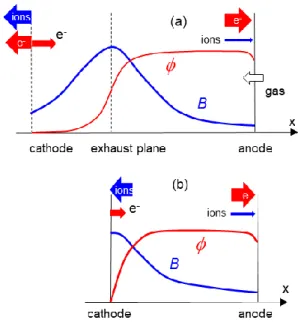
The similarities between Hall thrusters11, 12 and dc magnetron or pulsed magnetron discharges13-15 are illustrated in Figure 1, which shows typical axial distributions of the imposed radial magnetic field and of the electric potential in both devices. In a magnetron discharge (Figure 1b), electrons are emitted by the cathode under ion bombardment and are accelerated toward the plasma by the sheath electric field. In a Hall thruster (Figure 1a), electrons are injected in the discharge from a hot cathode, neutralize the ion beam extracted from the plasma, and are accelerated toward the plasma by the large axial electric field resulting from the drop of electron conductivity in the magnetic barrier. In both devices, the electron current must cross a region of large and decaying, perpendicular magnetic from the exhaust plane to the anode in a Hall thruster, and from cathode to anode in a magnetron discharge. The classical, collisional electron mobility 𝜇∥= 1 𝐵ℎ⁄ (𝐵 is the magnetic field and ℎ = 𝜔𝑐𝑒⁄𝜈𝑒𝑁 is the Hall parameter, ratio of the electron cyclotron frequency to the electron collision frequency) parallel to the applied electric field is in general not sufficient to allow cross-field electron transport to the anode and “anomalous” electron transport must be invoked to explain the observed electron current across the magnetic field. We studied in Ref.16 anomalous electron transport across the magnetic field associated with the development of instabilities in the near-anode region, assuming a given ionization rate profile, and showed that Simon-Hoh instabilities17, 18 were likely to form for sufficiently large magnetic fields. In the present paper we present a self-consistent study of plasma transport in conditions typical to a magnetron discharge (Figure 1b) and show that the Simon-Hoh instability evolves into an ionization instability. We expect that some of the conclusions concerning cross-field plasma transport and rotating spokes in the magnetron discharge will also apply to the anode region of Hall thrusters.
Rotating spokes, i.e. regions of enhanced light emission rotating in the azimuthal direction, were first observed in Hall thrusters by Janes and Lowder 19. The term “rotating spoke”, now commonly used by the Hall thruster and magnetron communities, was originally introduced by these authors. Janes and Lowder identified the rotating spoke as a mechanism contributing to anomalous cross-field transport in this device. Instabilities are likely to develop in the 𝐸 × 𝐵 direction because of the charge separation resulting from the large 𝐸 × 𝐵 electron drift (ions are only weakly magnetized, i.e. their Larmor radius is not small with respect to the characteristic dimensions of the device and their 𝐸 × 𝐵 drift is therefore negligible). Ellison et al.20 measured the currents on a segmented anode in a cylindrical Hall thruster and showed that as much as 50% of the discharge current was conducted by the spoke. McDonald and Gallimore21 presented images showing the clear presence of coherent rotating spoke structures in more recent and more
Figure 1: Axial distribution of the potential,
, and radial magnetic field intensity, B, in, (a) a Hall thruster, and (b) a magnetron discharge.conventional Hall thrusters, with velocities of a few hundred meters per second. Sekerak et al.22 measured spoke velocities between 1500 and 2000 m/s in a 6 kW Hall thruster operating at different voltages and mass flow rates in xenon. In this thruster, mode transitions were shown by Sekerak et al.23 to be induced by varying the magnetic field intensity while holding all other operating parameters constant. They defined a global and a local mode of oscillations, the transition between the two occurring at higher relative magnetic field strengths for higher mass flow rate or higher discharge voltage. The global mode was characterized by large current oscillations with a small or absent spoke contribution, and seemed to correspond to the “breathing mode” of oscillations that had been well documented in the Hall thruster literature11, 12. The local mode, at higher magnetic fields, was characterized by smaller amplitude current oscillations and by the clear presence of spokes rotating in the 𝐸 × 𝐵 direction. Finally, rotating spokes have also been observed recently in low power, permanent magnet Hall thrusters operating in standard and in wall-less configurations24. Localized zones of ionization, called “spokes” by analogy to the spokes of Hall thrusters are also observed in pulsed magnetrons (HiPIMS)25-28 as well as in dc magnetrons10, 29, 30 (see the reviews by Anders14 and Hecimovic and von Keudell15). In planar magnetrons, the magnetic field is generated in front of the cathode by ring magnets. The radial magnetic field is maximum on the cathode surface and decreases away from the cathode (Figure 1b). For relatively low magnetic fields, a magnetron discharge could be considered as a regular glow discharge that can operate at low pressure because of the reduced electron mobility due to the presence of a transverse magnetic field. In such discharges, electrons emitted by the cathode under ion bombardment are
3 accelerated in the cathode sheath and gain enough energy to generate sufficient ionization to sustain the plasma. However, for large magnetic fields that are typical to magnetron sputtering, it has been shown that heating of secondary electrons in the cathode sheath is not sufficient to explain discharge sustainment and that an alternative “energization” mechanism must be invoked14, 31-33. This electron energization is supposed to take place not in the positive space charge cathode sheath, but in the quasineutral presheath adjacent to the cathode sheath and is termed as “Ohmic heating” in some papers31, 33. Moreover, it has been assumed that electron heating in the presheath is not azimuthally uniform and is strongly correlated with the formation of spokes. Measurements on cathode segments34 (“target inserts”) and with triple probes35 exhibit a modulation of the target current density and of the electron density and temperature in the spoke region that is consistent with the spoke dynamics. It has been proposed that the spokes are associated with ionization zones where the electric potential is locally enhanced (potential “humps”)36, 37, and that electrons are energized14, 32, 38 in a double layer around these regions of higher potential. The precise mechanism of electron heating is however not fully understood and we propose, in the present paper, a new insight in this mechanism and, more generally, in the formation and properties of rotating spokes, with the help of results from PIC MCC simulations.
In the rest of this paper we will consider the simple conditions of a dc magnetron discharge in a pure gas (argon) with a constant gas density. In practical applications of magnetrons and especially in high power pulsed magnetrons, the situation can be far more complex because of the presence of sputtered neutral atoms and ions, metastable states, and of possible neutral depletion or rarefaction induced by the strong ionization and gas heating. Nevertheless rotating spokes are also observed under low power dc conditions where these features are not present or are negligible10, 30. In the case of Hall thrusters the situation is yet more complex because of the presence of a region, between cathode and exhaust plane (Figure 1a), where the magnetic field increases and where instabilities and anomalous transport are different from those in the decaying magnetic field region between exhaust plane and anode. The conductivities of these two regions are different, depend on complex instability phenomena or electron-wall interactions and control the distribution of electric potential in each region. This is a very non-linear system where anomalous electron transport is strongly coupled with the distribution of a large electric field in the quasineutral plasma, with ionization and with gas depletion12. A large part of the gas injected at the anode is ionized in the exhaust region but the ionization region may move axially (breathing oscillations) or azimuthally (rotating spokes). The regime of rotating spokes, which has been shown to be dominant above a given value of the magnetic field intensity23, appears to be very similar to that observed in magnetron discharges.
III. PIC MCC MODEL AND SIMULATION CONDITIONS
A. Simulation conditions
In this paper we consider conditions that are similar (in the sense of discharge similarity laws) to those of the magnetron discharge experiment of Ito et al.10 at Stanford University. The conditions of the experiments of Ito et al. were simulated in a recent letter 39. In this relatively simple experiment, Ito et al. observed, with the help of a fast CCD camera, very nice and well-defined, self-organized structures rotating in the azimuthal direction of a miniature magnetron. These experiments were performed in a small, 2 mm gap dc magnetron discharge at a pressure of 20 Pa (0.15 torr) in argon, and with a magnetic field decaying from about 1 T at the cathode surface to 0.1 T at the anode surface. In this miniature magnetron discharge, several regions of enhanced luminosity were seen to rotate in the −𝐸 × 𝐵 direction at velocities on the order of 10 km/s. The number of rotating structures (or mode number) was 5 for an applied voltage of 260 V and decreased to 3 for an applied voltage of 274 V. We consider here discharge dimensions and pressure that are closer to those used in practical applications of magnetrons than in the discharge of Ito et al.10. The dimensions are multiplied by a factor of 10 with respect to those of the discharge of Ito et al. , and the pressure and magnetic field are divided by 10. According to the classical similarity laws, gas discharges with same pd product (pressure times dimensions) and same B/p ratio (magnetic field over pressure) are “similar”, i.e., the distribution of n/p2 , j/p2 (ratio of charged particle densities and current densities to pressure squared), E/p (electric field strength over pressure) as a function a px, py (product of pressure and spatial coordinates, x and y coordinates) are identical. The relation between the time scales in two similar discharges is such that the product pt (pressure x time) is conserved. The different velocities (thermal, drift, etc…) and the particle energy are identical in similar discharges.
In this paper we present simulation results for three cases. The simulations in sections IV.A, B, and C , correspond to the conditions of Ito et al. with a similarity factor of 10. They are performed in argon, at a pressure of 2 Pa (15 mtorr), for a cathode-anode gap of 2 cm, and for magnetic field intensity varying from 0.1 T at the cathode surface to 0.01 T at the anode surface. The net secondary electron emission coefficient due to ion impact on the cathode (see below) is 0.005. These conditions correspond to CASE 1. In section IV.D the simulations are performed with a longer gap as (3 cm) and with a magnetic field close to zero in the anode region (CASE 2). The other conditions are the same as in CASE 1. In section V (CASE 3) the conditions are the same as in CASE 1 except that the magnetic field at the cathode surface is 0.05 T instead of 0.1 T, the pressure is 1.3 Pa (10 mtorr) instead of 2 Pa and the net secondary emission coefficient is 0.008. This is to illustrate the possibility of change in the direction of rotation of the spokes.
4
Figure 2: 2D axial-azimuthal simulation domain. Simulations are performed in argon at a pressure of 2 Pa (CASE 1 and CASE 2) or 1.3 Pa (CASE 3) and for an anode voltage of 260 V. Periodic boundary conditions are used in the azimuthal direction (azimuthal length 4 cm). The gap length is 2 cm (CASE 1 and CASE 3) except in section IV.D where it is 3 cm (CASE 2). The net secondary electron emission due to ion impact is given in Table 1 (“net” means that the flux Γ𝑒 of electrons emitted by the
cathode under ion bombardment is related to the incoming ion flux Γ𝑖 by |Γ𝑒| = 𝛾|Γ𝑖| and that electrons coming back to the
cathode are re-emitted). The magnetic field is perpendicular to the simulation domain and its direction is indicated on the figure. The 𝐸 × 𝐵 drift (where 𝐸 is the applied field) is directed downward, i.e. toward negative y.
Finally we note that although the dimensions, pressure and magnetic field intensities considered in the present simulations are closer to those of magnetron sputtering experiments than those of the experiment of Ito et al., the discharge power and plasma densities that we consider in the simulations are much smaller than in dc or pulsed magnetron sputtering experiments. The plasma density in magnetron sputtering experiments can be quite large (up to 1019 m-3) and simulating such conditions would require extremely large computing power. We will consider plasma densities closer to those of magnetron discharges or Hall thrusters in future publications.
B. PIC MCC model
The 2D PIC MCC model is similar to the one used in previous papers8, 39-44.
Simulation domain
The simulations are performed in a 2D domain shown in Figure 2, which includes the axial and azimuthal directions (the azimuthal direction must be described since instabilities develop preferentially in this direction). Radial gradients and mirror effects associated with the real magnetic field distribution of magnetron discharges are therefore not included in this model. To keep the computation time within reasonable limits, the length of the azimuthal dimension in the simulations (4 cm) is shorter than in a magnetron discharge (it would be about 15 cm for a discharge “similar”
to that of Ito et al.). Periodic boundary conditions are used in the azimuthal direction and it is clear that the wavelengths of the instabilities that can be described by the model are limited by the azimuthal dimension of the simulation domain. The dimensions (x,y) of the simulation domain are 2 cm x 4 cm (Figure 2) and a 128 x 256 grid is used, except in section IV.D where the gap length is 3 cm and the grid is 192 x 256. The number of particles per cell is around 200. Since the grid spacing must be smaller than the Debye length in a PIC simulation, these computational parameters are suitable for simulating plasmas with charged particle number densities up to about 0.5x10¹⁶ m-3 (for electron temperatures larger than 2 eV).
Secondary electron emission
Each ion reaching the cathode causes the emission of an average of 𝛾 electrons, i.e. the flux of electron leaving the cathode, Γ𝑒, is related to the flux of ions hitting the cathode, Γ𝑖 , by |Γ𝑒| = 𝛾|Γ𝑖| . We also assume that each electron coming back to the cathode is re-emitted. Thus, 𝛾 is a “net” emission coefficient that takes into account secondary electron emission by ion impact and reflection of electrons coming back to the cathode on their cyclotron trajectory or because of collisions. This net emission coefficient has been adjusted (see Table 1) to get results that give plasma densities not larger than the maximum density allowed by the grid spacing and that are consistent with the experimental results of Ito et al. (taking into account the similarity laws). The electrons are emitted or re-emitted from the cathode according to a semi-Maxwellian distribution at 2 eV. The combination of electron emission due to ion bombardment at the cathode and ionization in the discharge volume is a very non-linear process leading to discharge sustainment. In order to simplify and accelerate the convergence to steady state, we have used, in some cases, the following procedure. The total, net secondary electron emission current I𝑒 at the cathode is fixed. The secondary electron emission is adjusted at given time intervals to satisfy the relation 𝛾 = |I𝑒| |I⁄ 𝑖| where I𝑖 is the ion current at the cathode surface at the previous time step (or averaged over a small interval) deduced from the simulation. The flux of emitted electrons is still given by |Γ𝑒| = 𝛾|Γ𝑖| but with a 𝛾 coefficient that varies in time until steady state is reached (i.e. the ion current at the cathode surface I𝑖 reaches a constant value). At each time step the emitted electron current is fixed, i.e. I𝑒= ∫ Γ𝑒𝑑𝑠 where the integral is performed over the cathode surface. The emitted electron current I𝑒 is chosen so that the value of the 𝛾 coefficient at steady state is “reasonable” or close to an expected value. We found that it is much easier and faster to reach steady state using this procedure.
Argon cross-sections
The electron-neutral cross-sections used in the Monte Carlo module are those of the Phelps LXcat database45. A constant ion-neutral, charge-exchange collision cross-section of 4x10-19 m2 has been used for collisions between argon ions and neutral atoms.
5
Figure 3: Axial profiles of the magnetic field for the 3 cases considered in this paper. CASE 1: standard case, sections IV.A, B, C. CASE 2: gap length 3 cm, zero B field in anode region, section IV.D. CASE 3: smaller B field at the cathode surface (0.05 T instead of 0.1 T), section V.
Magnetic field
The magnetic field is perpendicular to the simulation domain and directed inward (Figure 2) so the 𝐸 × 𝐵 drift (where 𝐸 is the applied electric field) is in the negative y direction. The axial profiles of the magnetic field intensity in the three cases considered in this paper are shown in Figure 3 and correspond to the expression:
𝐵(𝑥) = 𝑎𝑒−𝑥 2
2𝜎2+ 𝑏
The constants 𝑎 and 𝑏 are calculated so that 𝐵(0) and 𝐵(𝑑) have given values. The parameters 𝜎, 𝑑, 𝐵(0), and 𝐵(𝑑), used for the three cases are given in Table 1.
𝜎 𝑑⁄ 𝑑 𝐵(0) 𝐵(𝑑) 𝑝
CASE 1 0 . 3 5 2 c m 0 . 1 T 0 .0 1 T 2 P a 0.005 CASE 2 0 . 2 6 3 c m 0 . 1 T 0 2 P a 0.005 CASE 3 0 . 3 5 2 c m 0.05 T 0 .0 1 T 1.3 Pa 0.008
Table 1: Parameters defining the magnetic field profiles, the gas pressure and the net secondary emission coefficient for the three cases considered in this paper. Note that if the net secondary emission coefficient is = and if the probability that an electron coming back to the cathode be reemitted is 0.1, the real secondary emission would be 0.05, which is an usual value for argon ions.
Initial conditions
The simulations were started with a uniform initial plasma density of 5x10¹⁴ m-3. In these conditions steady state was reached in less than 200 s and the maximum plasma density at steady state was around 0.5 x 10¹⁶ m-3.
IV. SPOKE ROTATION IN THE −𝑬 × 𝑩 DIRECTION
In this section we focus on conditions “similar” to those of Ito et al.10 with dimensions 10 times larger, pressure and magnetic field ten times lower. In these conditions the PIC MCC simulations predict the formation of a spoke that rotates in the −𝐸 × 𝐵 direction. We present the general properties of this rotating spoke in section IV.A. The mechanism of
electron heating in the spoke is described in section IV.B. The formation of a double layer and electron vortices in the spoke region is discussed in section IV.C and IV.D.
A. General properties of the retrograde rotating spoke In the conditions defined above, the simulated plasma presents a coherent azimuthal non-uniformity that moves in the −𝐸 × 𝐵 direction at a velocity of about 10 km/s. The wavelength of the non-uniformity is as large as the azimuthal dimension of the domain, i.e. 4 cm, but simulations performed with an azimuthal dimension of 8 cm show the presence of two similar non-uniformities.
Figure 4 shows the axial-azimuthal distributions of the electron density, ion density, electric potential, electron mean energy, ionization rate, and ion mean energy. The plasma non-uniformity is associated with a distortion of the electric potential that allows some electrons to reach the anode across the magnetic field. Keeping in mind that the 𝐸 × 𝐵 electron drift is parallel to the equipotential lines we see that some electrons can be driven close to the anode along the AB and DE segments of the ABCDE line represented on the potential contours of Figure 4c.
Figure 4: Axial-azimuthal distributions at a given time, of the (a), electron density 𝑛𝑒 , and (b), ion density 𝑛𝑖 (unit 0.4x10¹⁶ m-3)
(c) electric potential 𝜙 (unit 260 V), (e), electron mean energy 𝜀𝑒
(unit 15 eV) , ionization rate 𝑆 = 𝑛𝑒𝜈𝑖 (unit 1.6x10²² m-3s-1), (f)
ion mean energy 𝜀𝑖 (unit 30 eV; the ion energy in the cathode
sheath is much larger than 30 eV). The white line on (f) is a contour of constant ion energy equal to 15 eV. CASE 1: argon, 2 Pa (15 mtorr), anode voltage 260 V, net secondary emission coefficient 𝛾 = 0.005 . 0.0 0.5 1.0 1.5 2.0 2.5 3.0 0.00 0.02 0.04 0.06 0.08 0.10 CASE 3 CASE 2 CASE 1 Magnetic fiel d intens ity (T) Axial position x (cm) B(x)
6 The ABCDE line marks the boundary between a quasi-equipotential region (lighter color in Figure 4c) close to the anode potential and a quasineutral region of larger electric field (a presheath). We will see below that a large part of the ABCDE line is a double layer where the electric field drops abruptly. This line is an interface between two quasineutral plasma regions with different properties. We call this line “the interface” or “the double layer” in the following. We see on Figure 4 that local maxima of the potential, associated with maxima of the electron mean energy and ionization rate, and with minima of the electron density are present along the double layer (along the BC segment). These structures correspond to electron vortices moving along the double layer at a velocity close to the average 𝐸 × 𝐵 drift velocity in the double layer. This is discussed in more detail in section IV.C. In the experiments the spoke is a region of enhanced light emission that rotates in the azimuthal direction. This corresponds, in the simulation, to the region of enhanced ionization rate, which is apparent in Figure 4e. This region is located on the BC segment of the double layer (see Figure 4c), where the 𝐸 × 𝐵 drift has a component directed from anode to cathode (as indicated in Figure 4d). It is interesting to note that in the conditions considered here, most of the ionization takes place in the spoke. Very little ionization (not visible in the linear scale of Figure 4e) takes place in the cathode region, i.e. electrons emitted by the cathode and accelerated in the sheath do not play an important role in ionization, in contrast with usual, unmagnetized glow discharges. The question of the role of the cathode sheath and of the adjacent quasineutral plasma or presheath in electron heating has been the subject of several papers in the context of magnetron discharges31-33, 46. From the analysis of experimental observations and semi-empirical models described in these papers, it seems to be now admitted that electron heating in “the electric field of the magnetic presheath is dominant over heating by secondary electrons”32. This is fully consistent with the results from our PIC MCC simulations displayed in Figure 4. The increase of the electron mean energy (Figure 4d) in the bulk plasma is responsible for the enhanced ionization rate in the spoke region. The simulations presented here provide a completely new insight in the mechanisms controlling electron heating in the spoke. This is discussed in detail in section IV.B where we show that electron drift due to the axial variations of the magnetic field (𝛁𝐵 drift) plays an essential role in this electron heating. The −𝐸 × 𝐵 motion of the spoke is illustrated in Figure 5. Figure 5a shows the distribution of ion density (color scale) and a contour of constant ionization rate at three different times during the spoke rotation. The spoke velocity that can be deduced from this figure is around 10 km/s (in agreement with the experimental result of Ito et al.10, as discussed in Ref.39). We note that a large part of the ionization (black contours in Figure 5a) takes place on the upper side of the region of maximum plasma density, i.e. in the −𝐸 × 𝐵 direction with respect to this maximum.
Tha the refe than the
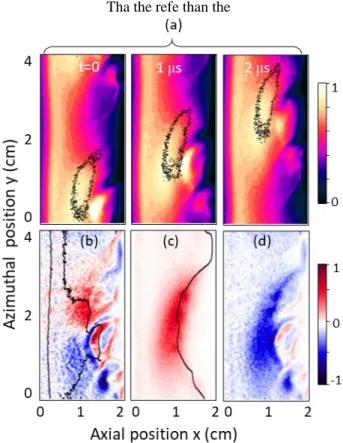
Figure 5: (a) Axial-azimuthal distribution of the ion density at three different times showing the motion of the plasma non-uniformity at a velocity of about 10 km/s (about 2 cm in 2 s). The unit is 0.4x10¹⁶ m-3. The black line indicates a contour of
constant ionization rate (0.5x10²² m-3s-1) and shows the motion of
the rotating spoke together with the plasma non-uniformity; (b), (c), (d) axial-azimuthal distributions at time t=1 s of the different terms of the ion continuity equation, respectively, time derivative of the ion density, 𝜕𝑡𝑛𝑖= 𝑆 − ∇Γ𝑖 (unit x1022 m -3s-1), ionization rate, 𝑆 = 𝑛
𝑒𝜈𝑖 (unit 1022 m-3s-1), and
divergence term, −∇Γ𝑖 (unit 1022 m-3s-1). The black contour in
(b) is a contour of constant ion density (0.25x10¹⁶ m-3) and the
black contour in (c) corresponds to the 255 V potential contour (i.e. close to the ABCDE line of Figure 4c). Same conditions as Figure 4 (CASE 1).
This explains the motion of the spoke in the positive y direction, i.e. in the −𝐸 × 𝐵 direction (see the arrows in Figure 4). In order to understand more quantitatively the reason for the rotation of the spoke in the −𝐸 × 𝐵 direction, we have plotted in Figure 5b, c, d, the distributions of the different terms of the ion continuity equation 𝜕𝑡𝑛𝑖= 𝑆 − ∇Γ𝑖 at the intermediate time of Figure 5a. The time derivative of the ion density, 𝜕𝑡𝑛𝑖 , is positive on the upper side of the plasma non-uniformity because the ionization term 𝑆 = 𝑛𝑒𝜈𝑖 is larger than the transport term −∇Γ𝑖 , while the opposite is true on the lower side. We can therefore conclude that in these conditions, the apparent motion of the plasma non-uniformity and spoke is due to the generation of new charged particles by ionization on the −𝐸 × 𝐵 side of the region of maximum plasma density.
7
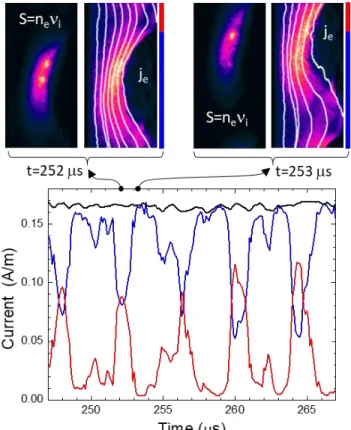
Figure 6: Time evolution of the electron current (bottom), in the conditions of Figure 4 (CASE 1), on two segments of the anode in the azimuthal direction, of length 1 cm (red line) and 3 cm (blue line). The black line is the ion current on the cathode. The top figures show the axial-azimuthal distributions of the ionization rate and the electron current density at two different times corresponding to the maximum (left) and minimum (right) current on the small anode segment. The two anode segments are shown on the right of the electron current density plots (short segment in red, long segment in blue). The color scale for je
indicates the intensity of the electron current density and the white lines correspond to the current stream lines.
In several experimental works on rotating spokes in Hall thrusters20, 21, 47, the discharge current is measured on a segmented anode. This provides useful information on the rotating plasma non-uniformities that are complementary to fast camera imaging. We see on the potential contours of Figure 4c that the electron current density on the anode is likely to be maximum in the AB and DE regions, i.e. where the 𝐸 × 𝐵 drift guides the electrons to the anode. This indicates that the current on an anode segment will be modulated in time at the same frequency as the spoke rotation frequency. In the simulations, we measured separately the currents on two segments of the anode, one of 1 cm length, the other one of 3 cm length in the azimuthal direction. The time evolution of the electron current on the two anode segments and of the ion current collected by the cathode is shown in Figure 6, together with plots of the ionization rate and electron current density distributions at two different times corresponding to a maximum and a minimum of the
current on the small segment. The discharge current is on the order of 0.17 A/m, which corresponds to a current density of 4 A/m2, i.e., using the similarity laws, to a current density of 400 A/m2 in the conditions of the experiment of Ito et al. (not far from the current density of 1000 A/m2 estimated by Ito et al.). Note also that the 0.4x10¹⁶ m-3 plasma density of Figure 4 corresponds to a plasma density of 0.4x10¹⁸ m-3 in the experiments of Ito et al. (See Ref.39).
There is clearly a dominant frequency of the current oscillations corresponding to a period around 4 s. Since the azimuthal length of the simulation domain is 4 cm, this confirms the spoke velocity of 10 km/s deduced from the spoke motion in Figure 5. The color plots of the electron current density (top of Figure 5) show that the electron current follows the 𝐸 × 𝐵 direction, i.e. is parallel to the equipotential lines and that electrons are lost to the anode around the AB and DE segments of Figure 4c. The current modulation is large since about 50% of the current reaches the small anode segment when the current on this segment is maximum. Note the phase-shift between the location of the spoke and the location of maximum current on an anode segment. B. Mechanisms of electron heating. Role of 𝛁𝑩 drift. We have seen in Figure 4d that the electron mean energy is maximum on the BC segment (Figure 4c) along the interface ABCDE separating the quasi-equipotential region from the presheath region of non-zero electric field. We show in this section that electrons flowing downward along the ABCDE line undergo heating on the BC segment and cooling on the CD segment of this line, due to 𝛁𝐵 drift. Because of the axial variations of the magnetic field, the electrons undergo a drift, the 𝛁𝐵 drift48, perpendicular to 𝑩 and 𝛁𝐵.
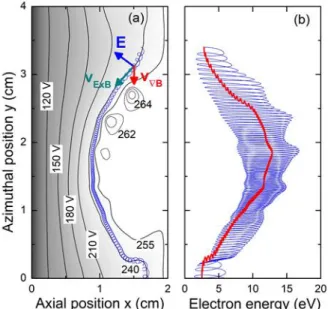
Figure 7: Axial-azimuthal distributions of (a), the azimuthal electric field 𝐸𝑦 and (b), the energy gain per electron per unit
time, −𝒗∇𝐵. 𝑬 due to the 𝛁𝐵. drift. The units are, respectively,
104 V/m, and 8x10⁸ eV/s. The black lines in (b) correspond to two
equipotential contours at 255 V and 262 V, indicating respectively the positions of the double layer and of the electron vortices. Same conditions as Figure 4 (CASE 1).
8 The 𝛁𝐵 electron drift velocity is given by 𝒗𝛁𝐵= −1 2⁄ 𝜌𝑒𝑣⊥𝑩 × 𝛁𝐵/𝐵2= −𝜀⊥𝑩 × 𝛁𝐵/𝐵3 where 𝑣⊥ is the electron velocity and 𝜀⊥ the electron energy in eV, perpendicular to the magnetic field. 𝒗𝛁𝐵 is directed in the azimuthal direction downward. Along the BC segment of Figure 4c, this drift pushes the electrons across the magnetic field toward higher potential regions, while the opposite is true along the CD segment. This leads to electron heating along BC and electron cooling along CD. The variations of the electron perpendicular energy due to this drift can be written as 𝜕𝑡𝜀⊥= −𝒗𝛁𝐵. 𝑬 = 𝜀⊥𝐸𝑦⁄(𝐵𝐿) where 𝐿 = |𝐵 𝜕⁄ 𝑥𝐵|. 𝒗𝛁𝐵 is directed in the negative y direction, while 𝐸𝑦 is positive along BC and negative along CD so electron heating takes place along BC and electron cooling along CD. The electron heating along the BC segment and cooling along the CD segment are of course consistent with conservation of the first adiabatic invariant 𝜀⊥⁄ . This can be written 𝐵 𝜕𝑡(𝜀⊥⁄ ) = 0 , leading to 𝜕𝐵 𝑡𝜀⊥= 𝜀⊥⁄ 𝜕𝐵 𝑡𝐵 = 𝜀⊥⁄ 𝐵 𝜕𝑥𝐵𝑣̅̅̅ = 𝐸𝑥 𝑦𝜀⊥⁄ |𝜕𝐵 𝑥𝐵| (𝑣̅̅̅ = − 𝐸𝑥 𝑦⁄ is the x component 𝐵 of the 𝐸 × 𝐵 drift), which is equivalent to 𝜕𝑡𝜀⊥ = −𝒗𝛁𝐵. 𝑬. This is illustrated in Figure 7. The y component of the electric field, 𝐸𝑦, is shown in Figure 7a, while Figure 7b displays the spatial distribution of the energy gain term 𝜕𝑡𝜀⊥ per electron per unit time calculated for the average perpendicular energy, at a given time of the simulation.
Figure 8: (a) Example of electron trajectory (blue line) in the vicinity of the double layer. The black line and grey color correspond to electric potential contours. The directions of the electric field E, of the 𝐸 × 𝐵 drift velocity and 𝛁𝐵 drift velocity are indicated at one point of the trajectory; (b) Electron energy along the same trajectory, as a function of azimuthal position. The initial electron velocity, at x=1.6 mm, y=3.4 mm, is 𝑣𝑥=
106m/s, 𝑣
𝑦= 0. The red line is the average energy calculated
assuming electron heating due to ∇𝐵 drift using the expression 𝜀⊥= 𝜀⊥0− ∫ 𝒗𝛁𝐵. 𝑬𝑑𝑡. Same conditions as Figure 4 (CASE 1).
The calculated value of 𝜕𝑡𝜀⊥ along BC is several 108 eV/s. Since the 𝐸 × 𝐵 electron drift velocity along BC is on the order of 2x10⁵ m/s, the electrons move along BC in a time 𝜏 around 0.5x10⁻⁷ s, and can therefore gain several eV along their trajectory. The maximum ionization frequency 𝜈𝑖 in the spoke is on the order of 4x10⁶ s-1 (can be deduced from the plasma density and ionization rate in Figure 4). The probability of ionization during electron heating in the spoke is therefore high since 𝜈𝑖 𝜏 can be as large as 0.2.
Electron heating and cooling along the double layer can also be illustrated by integrating a single electron trajectory in the vicinity of the double layer as shown in Figure 8. We see on Figure 8a that the electron trajectory slightly deviates from the equipotential line due to 𝛁𝐵 drift. Since the azimuthal electric field is large on the left of the boundary layer this deviation from the equipotential line corresponds to a significant energy gain or loss along the trajectory as shown in Figure 8b. The red line in Figure 8b is the electron mean energy calculated by integrating the expression above along the electron trajectory (blue line): 𝜀⊥= 𝜀⊥0− ∫ 𝒗𝛁𝐵. 𝑬𝑑𝑡 where 𝜀⊥0 is the initial perpendicular electron energy. Finally, we see in Figure 8 that electron heating is enhanced at the locations of electron vortices. We discuss in the next sub-section the development of electron vortices along the double layer and their role in electron heating.
C. Double layer and electron vortices
As said above, the line separating the quasi-equipotential region from the non-zero electric field region in Figure 4 (ABCDE line of Figure 4c) is a relatively sharp boundary of several electron Debye lengths resulting from the formation of a double layer. This can be clearly seen in Figure 9a, which shows the spatial distribution of the space charge (𝑛𝑖− 𝑛𝑒) at a given time, and the axial distribution of the charged particle densities, electric field and electron mean energy at two azimuthal locations. Electrons flow along the ABCDE interface or double layer of Figure 4c due to 𝐸 × 𝐵 drift and a fraction of these electrons reach the anode on the AB and DE segments of this line. This creates a deficit of electrons along the line, which is only partially balanced by ionization, hence the positive space charge seen in Figure 9a along the BCD segment. Note the sharp decrease of the electric field in the double layer at the azimuthal position y=2.4 cm in Figure 9b, and the significant increase of the electron mean energy due to the 𝛁𝐵 drift. The positive space charge region is surrounded by a negative space charge distributed over a longer length. We note on Figure 9b, that along the azimuthal position y=3.5 cm (in the AB segment of the ABCDE line), the axial electric field stays negative up to the anode. Some of the electrons present in the anode region along the AB segment are therefore extracted to the anode due to collisional cross-field transport parallel to the electric field.
9
Figure 9: (a) Distribution, at a given time, of the space charge density (𝑛𝑖− 𝑛𝑒), unit 1015 m-3; (b) axial profiles of the charged
particle densities, electron mean energy, and axial electric field at two azimuthal positions, y=2.4 cm, and y=3.5 cm, indicated on (a). The units are respectively 1015 m-3, eV, and 104 V/m. Same
conditions as Figure 4 (CASE 1).
The 𝐸 × 𝐵 velocity shear in the double layer creates conditions favorable to the development of a diocotron instability, similar to the Kelvin-Helmholtz instability. The simulations predict the formation of electron vortices that are apparent in most of the figures above. In Figure 4a and Figure 4c , we see that the electron vortices correspond to local holes in the electron density and local maxima of the electric potential. The holes in the electron density at the vortex locations is also clearly apparent in the space charge plot of Figure 9. The electron mean energy and ionization rate (Figure 4d and Figure 4e) also exhibit some maxima at the vortex locations. These electron vortices are generated at the beginning of the BC segment, move along the double layer at a velocity close the average 𝐸 × 𝐵 velocity in the double layer while rotating around the local potential maxima. This is illustrated in Figure 10a, which shows the space distribution of the mean electron energy at four different times. The color map of Figure 10b shows the sharp variation and change of sign of the 𝐸 × 𝐵 drift velocity in the double layer.
The diocotron instability is a type of Kelvin-Helmholtz instability that occurs in low density strongly magnetized (𝜔𝑝𝑒< 𝜔𝑐𝑒), non-neutral plasma regions such as electron beams in cross-field configurations49, cross-field discharges at low pressures41, 50-52, or in pure electron plasmas generated in Penning-Malmberg traps53-55. In pure electron plasma, electron columns are confined radially by an axial magnetic field, and axially by an electric potential. Electron vortices form because a perturbation of the plasma density results in
an electric field, which causes an 𝐸 × 𝐵 drift of the plasma which in turns self-consistently generates the density perturbation54. Vortex “clumps” or “holes” can be generated by injecting or removing electrons locally from a quiescent electron column 56, 57 in a Penning-Malmberg trap. In our conditions the situation is different since there is a positive ion background in the double layer, but the decrease of the electron density due to losses at the anode creates the conditions for the formation of vortex holes in the double layer. The motion of the electron vortices along the double layer is due to the fact that the average electric field in the double layer is non-zero due to the applied voltage (in contrast with the general situation of electron vortices in pure electron plasmas).
One can see on Figure 4 and Figure 10 that the electron mean energy presents local maxima at the location of the vortex holes. Even the ionization rate has local maxima at the vortex location in spite of the decrease of the electron density in the vortex hole. The plot of the energy gain per electron per unit time of Figure 7b indicates that electrons gain energy on the upper side of the vortex and lose energy on the other side. A possible interpretation of this feature is that 𝛁𝐵 drift also plays a role in the electron heating and cooling of electron moving around the vortex and along the double layer.
Figure 10: (a) Axial-azimuthal distribution of the electron mean energy at 4 different times showing the motion of the electron vortices along the double layer with a velocity on the order of 2x10⁵ m/s (1 cm in 50 ns). The unit is 20 eV. The white circle
identifies one of the electron vortices; (b) Distribution of the E/B drift velocity in the conditions of (a) at t=0. The unit is 105 m/s.
The blue colors correspond to drift velocities directed downward (toward negative y, i.e. 𝐸 × 𝐵 direction for the applied electric field) and the red colors to velocities directed upward. Same conditions as Figure 4 (CASE 1).
D. Results in the absence of electron vortices
Electron vortices generated by the diocotron instabilities develop under conditions where the electron plasma frequency is smaller than the electron cyclotron frequency (𝜔𝑝𝑒< 𝜔𝑐𝑒). This condition is satisfied in our simulations and also probably in the experiment of Ito et al.10. Such structures would be difficult to see in the experiments because
10 the double layer thickness is only a few electron Debye lengths and because the vortices move at relatively high speed.
In high power pulsed magnetron discharges used in plasma processing (HiPIMS) the plasma density can be up to two or three orders of magnitude larger than in the simulations reported here. It is therefore unlikely that electron vortices develop in these conditions. We show below that the role of electron vortices is actually not essential in the spoke formation and sustainment. Since PIC MCC simulations for plasma densities two or three orders of magnitude larger than those considered here would be quite cumbersome, we consider in this sub-section conditions similar to those described above, but where electron vortices do not develop. These conditions correspond to CASE 2 defined in section III. The argon pressure is 2 Pa, the azimuthal length is 4 cm, as above, but the cathode-anode gap is now 3 cm and the magnetic field is close to zero in the anode region (Figure 3, CASE 2). The magnetic field profile is close to the magnetic field of the simulations above (CASE 1) up to 𝑥 = 1.5 cm, and is practically zero for 𝑥 larger than 2.3 cm. The plasma is therefore practically unmagnetized from 𝑥 = 2 cm (position of the anode in the previous simulations) to 𝑥 = 3 cm (position of the anode in the simulations of this sub-section). In these conditions, the simulations predict the formation of a spoke similar to the spoke obtained with a shorter electrode gap, moving in the −𝐸 × 𝐵 direction. Figure 11 shows the axial-azimuthal distributions of the space charge density, ionization rate, and electron current density in these conditions. Some electric potential contours are also displayed on Figure 11.
Figure 11: Distribution of the (a) space charge density (unit
0.5x10¹⁵ m-3), (b) ionization rate (unit 0.15x10²³ m-3s-1), and (c)electron current density for an electrode gap of 3 cm and for the magnetic profile of CASE 2 (see Figure 3). The lines on (b) are equipotential contours (120, 150, 180, 210, 240, and 255 V). The lines on (c) are current density stream lines. Argon, 2 Pa, net secondary emission coefficient 𝛾 = 0.005.
Figure 12: Time evolution of the electron current in the conditions of Figure 11, on two segments of the anode in the azimuthal direction, of length 1 cm (red line) and 3 cm (blue line). The positions of the two segments are the same as in Figure 6). The black line is the ion current on cathode.
As expected, the unmagnetized region between 𝑥 = 2 cm and 𝑥 = 3 cm is equipotential at a potential slightly above the anode potential. The spoke is located at the same location with respect to the distorted potential as in the results of CASE 1 above, and ionization rate is maximum at this location. So the results are similar to those of CASE 1 except that there are no electron vortices (compare, for example the space charge density of Figure 11a with that of Figure 9a). The double layer is still present but is less sharp than in the previous example. The reason for this less sharp double layer and for the absence of electron vortices is that the electron losses from the magnetized region to the anode region are now much more diffuse, as can be seen on the distribution of the electron current density of Figure 11c. Another evidence of the more diffuse electron losses is the time evolution of the electron currents collected on two segments of a segmented anode shown in Figure 12 (to be compared with the currents of Figure 6). The currents are modulated at a frequency slightly larger than that of the previous simulations, but the modulation of the current is now much less important. This suggests that it is actually difficult to deduce from the modulation of the current on segmented electrodes some quantitative information about the importance of anomalous transport associated with the spoke. The importance of anomalous transport in the magnetized region is about the same in both cases considered above, but the modulation of the current is much less important in the second case because of the presence of the unmagnetized region close to the anode. We can conclude from this sub-section that the double layer is sharper when the magnetic field on the anode is larger and electron vortices may develop in some regions of the double layer if the electron plasma frequency is smaller than the electron cyclotron frequency.
150 160 170 180 0.0 0.1 0.2 Current ( A/m) Time (s)
11
Figure 13: Axial-azimuthal distributions at a given time, of the (a), electron density 𝑛𝑒 , and (b), ion density 𝑛𝑖 (unit 0.4x10¹⁶ m -3) (c) electric potential 𝜙 (unit 260 V), (e), electron mean energy
𝜀𝑒 (unit 15 eV) , ionization rate 𝑆 = 𝑛𝑒𝜈𝑖 (unit 2x10²³ m-3s-1),
(f) ion mean energy 𝜀𝑖 (unit 30 eV) for CASE 3. The while line
on (f) is a contour of constant ion energy equal to 15 eV. Argon, 1.3 Pa (10 mtorr), anode voltage 260 V, net secondary emission coefficient 𝛾 = 0.008 .
V. ROLE OF THE MAGNETIC FIELD; ±𝑬 × 𝑩 ROTATION
The purpose of this section is to show that spoke rotation can occur in the +𝐸 × 𝐵 direction as well as in the −𝐸 × 𝐵 direction, depending on some parameters. In HiPIMS experiments, it has been shown that the direction of rotation changes from −𝐸 × 𝐵 to +𝐸 × 𝐵 when the power is increased. Since PIC MCC simulations at the high power and plasma densities of HiPIMS would be very cumbersome (we leave this to future studies), we illustrate here the change of rotation direction when the magnetic field is decreased, the other conditions being similar to the ones of the previous section.
In this section, the simulations conditions are those of CASE 3. The simulation domain is the same as in Figure 2 (cathode-anode gap 2 cm, azimuthal length 4 cm), the gas is argon at a pressure of 1.3 Pa (0.1 mtorr) and the magnetic profile has the same analytical expression as in section IV.A, B, C,
except that the magnetic field on the cathode surface is 0.05 T instead of 0.1 T (see Figure 2, CASE 3).
Since the magnetic field is lower than in the previous sections, electron confinement is less effective, and the net secondary electron emission was set to 𝛾 =0.008 instead of 0.005 to have plasma densities at steady state on the same order as above.
In these conditions the simulations predict the formation of a spoke with similar properties as above, but rotating in the +𝐸 × 𝐵 direction instead of −𝐸 × 𝐵. The mechanism of electron heating in the spoke is the same as before, i.e. is due to 𝛁𝐵 electron drift. Figure 13 shows the space distributions of the electron and ion density, electric potential, electron mean energy, ionization rate, and ion mean energy. This figure is to be compared with Figure 4 of the previous section (corresponding to a spoke rotating in the −𝐸 × 𝐵 direction). Most properties of the plasma are qualitatively comparable to those of the previous section. However some apparently small differences can be noticed: the ABCDE line is closer to the cathode (Figure 13c), i.e. the sheath-presheath region from cathode to the region around C is smaller, the electron heating and ionization region (spoke) is also closer to the cathode (Figure 13d and Figure 13e), the ionization rate is distributed below, i.e. toward negative y with respect to the maximum plasma density, and the azimuthal, upward acceleration of ions away from the spoke is more important (compare Figure 13f with Figure 4f). The +𝐸 × 𝐵 rotation in the conditions of Figure 13 is due to the fact that ionization is now more important below the plasma density maximum and that ions are accelerated upward out of the spoke
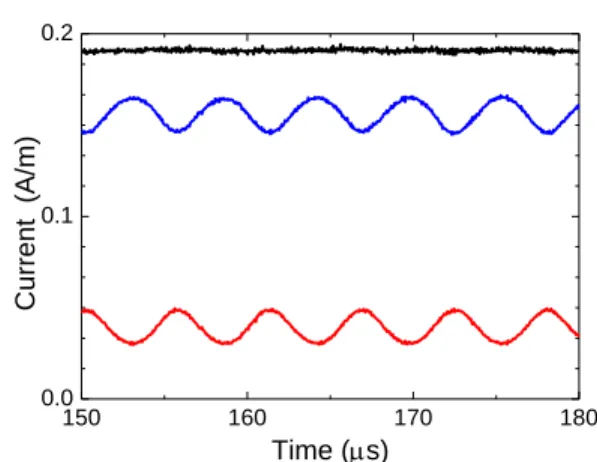
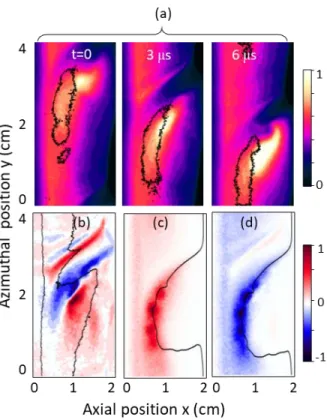
To better understand the reasons for the +𝐸 × 𝐵 rotation, we have plotted in Figure 14 the ion density at different times, and the different terms of the ion continuity equation as was done in Figure 5 in the conditions of the present section. We see on Figure 14a the motion of the rotating spoke in the +𝐸 × 𝐵 direction at a velocity of around 3 km/s (about 2 cm in 6 s), i.e. significantly lower than the velocity of 10 km/s in the −𝐸 × 𝐵 direction in the previous case (see Figure 5 and Figure 6).
This is consistent with the time evolution of the electron current on two segments of the anode, shown in Figure 15, which exhibits 15 s oscillations, corresponding to a spoke velocity of 2.7 km/s. Figure 14b, c, d display the distributions of the different terms of the ion continuity equation 𝜕𝑡𝑛𝑖= 𝑆 − ∇Γ𝑖 at the intermediate time of Figure 14a. In contrast with the case of section I.A (Figure 5), the time derivative of the ion density, 𝜕𝑡𝑛𝑖 , is now positive on the lower side of the plasma non-uniformity because the ionization term 𝑆 = 𝑛𝑒𝜈𝑖 is larger than the transport term −∇Γ𝑖 , while the opposite is true on the upper side.
12
Figure 14: (a) Distribution of the ion density (unit 0.4x10¹⁶ m-3)
at three different times showing the motion of the plasma non-uniformity at a velocity around 3 km/s. The black line indicates a contour of constant ionization rate (unit 0.5x10²² m-3s-1) and
shows the motion of the rotating spoke together with the plasma non-uniformity; (b), (c), (d) Distributions at the intermediate time, t=3 s , of the different terms of the ion continuity equation, respectively, 𝜕𝑡𝑛𝑖= 𝑆 − ∇Γ𝑖 (unit 0.2x10²² m-3s-1), ionization
rate, 𝑆 = 𝑛𝑒𝜈𝑖 (unit 1022 m-3s-1), and −∇Γ𝑖 (unit 1022 m-3s-1).
The black line in (b) is a contour of constant ion density (0.15x10¹⁶ m-3) and the black line in (c) and (d) corresponds to
the 255 V potential contour (i.e. close to the ABCDE line of Figure 13c). CASE 3, same conditions as Figure 13.
Figure 15: Time evolution of the electron current in the conditions of Figure 14, on two segments of the anode in the azimuthal direction, of length 1 cm (red line) and 3 cm (blue line). The positions of the two segments are the same as in Figure 6. The black line is the ion current on cathode.
VI. CONCLUSION
We have used a 2D PIC MCC simulation to study the long wavelength plasma non-uniformities that form in the region of decaying magnetic field between cathode and anode in magnetron discharges and Hall thrusters. These non-uniformities, called “rotating spokes”, are regions of enhanced light emission that rotate in the azimuthal direction of these 𝐸 × 𝐵 plasma devices and can be observed with high speed camera imaging. They are present in most conditions of dc and pulsed magnetron discharges and have also been observed in Hall thrusters when the magnetic field is sufficiently large.
Recent experimental work on magnetron discharges has led to the conclusion that rotating spokes are regions of intense ionization located in the quasineutral plasma presheath (and not in the large electric field of the cathode sheath) and where electrons are heated due to a particular local structure of the plasma potential. Although the detailed mechanism of electron heating has not been elucidated, it has been concluded from experiments that38 “the leading edge of the ionization zone is characterized by an electric double layer, energizing drifting electrons, which can further cause ionization and excitation”. An interesting and intriguing feature of the rotating spokes revealed by the experiments is that, depending on the conditions, the direction of rotation can be the +𝐸 × 𝐵 direction (generally in high power, pulsed conditions) or the retrograde, −𝐸 × 𝐵 direction (generally at low power or in dc conditions).
The simulations presented in this paper are in qualitative agreement with the experiments, confirm the recent interpretation of the experimental results, shed some light on the mechanisms leading to electron energization in the spoke, and provide some explanations of the possibility of ±𝐸 × 𝐵 rotation.
The main results can be summarized as follows.
1) For sufficiently large magnetic fields, the modified Simon-Hoh instability17 is likely to develop40 in the region of decaying magnetic field between cathode and anode in magnetron discharges or between channel exhaust and anode in Hall thrusters. When self-consistent ionization is taken into account in the model, the PICC MCC simulation results show that the Simon-Hoh instability evolves into an ionization instability that rotates in the azimuthal direction.
2) The distortion of the electric potential due to the Simon-Hoh instability is such that some equipotential lines oscillate between cathode and anode regions. 𝐸 × 𝐵 electron drift along these lines allows cross-field electron transport between cathode and anode.
3) A double layer where the electric field drops abruptly forms between a quasineutral plasma with large electric field (presheath), on the cathode side, and a quasi-equipotential region at a potential close to the anode potential. This sharp boundary oscillates azimuthally between cathode and anode
150 160 170 180 190 200 0.00 0.05 0.10 0.15 Current ( A/m) Time (s)
13 regions. The double layer is generated by the loss of electron to the anode region along this line.
4) Electrons flowing back from the anode side to the cathode side along the double layer and in its vicinity undergo some heating due to 𝛁𝐵 drift. Conversely, electrons returning to the anode side along this line are cooled due to 𝛁𝐵 drift. Electron heating due to 𝛁𝐵 drift is an essential feature of the formation of the ionization zone defining the spoke. The Simon-Hoh instability becomes an ionization instability. In some magnetron conditions, electron heating due to 𝛁𝐵 drift in the spoke may be the dominant mechanism of electron energization that allows discharge sustainment (i.e. heating of secondary electrons emitted by the cathode in the cathode sheath electric field only plays a minor role, in contrast with the case of un-magnetized or weakly magnetized glow discharges).
5) Electron vortices associated with a diocotron instability can form in the double layer under conditions where the electron plasma frequency is smaller than the electron cyclotron frequency. They move along the double layer at a velocity around the average 𝐸 × 𝐵 drift velocity in this region. These vortices may contribute to electron heating, but their contribution is not essential, and they are probably not present in the high-density plasmas of HiPIMS.
6) The simulations show that spoke rotation can take place in the +𝐸 × 𝐵 direction or in the −𝐸 × 𝐵 direction, depending on the conditions. The direction of rotation is controlled by the position of the ionization zone with respect to the region of maximum plasma density and by the importance of the azimuthal ejection of ions from the spoke front.
We end this conclusion with a few remarks on the limits of the model used in this paper and on possible directions for future work.
The model used in this paper is a 2D axial-azimuthal model and does not take into account the radial direction. Curvature effects, mirror effects, or radial losses and electron wall interaction (in Hall thrusters) are therefore not considered. The length of the periodic azimuthal length was limited to 4 cm in the simulations so the model could not describe instability wavelengths longer than 4 cm. Simulations with longer azimuthal directions should be performed to properly study the number of modes of the instability and its dependence on the different parameters. The plasma density considered in the simulations is consistent with the plasma density that can be estimated in the experiments of Ito et al.10, taking into account the similarity laws. This plasma density is much smaller than in magnetron sputtering experiments (two to three orders of magnitude smaller than in HiPIMS experiments). It is clear that the detailed structure of the electric potential at much higher plasma density would be different but the principle of ionization instability associated with electron heating by 𝛁𝐵 drift revealed by the model at relatively low plasma densities should still apply at higher density. Simulations at higher plasma densities should be
performed in the future to study the transition between −𝐸 × 𝐵 and +𝐸 × 𝐵 rotation that is observed in experiments when the plasma density is increased. Also, the possible contribution of small scale fluctuations to anomalous transport in these conditions need further studies. Small scale density fluctuations attributed to an Electron Cyclotron Drift Instability58 have been observed in magnetron discharges. Such instabilities have not been observed in our conditions of relatively low plasma densities and large Debye length, but they could play a more important role at high densities. 𝛁𝐵 drift plays an essential role in electron heating and in the spoke formation and stabilization in the simulations reported here. It would be useful and interesting to check experimentally this model prediction. The presence of a rotating spoke in a uniform magnetic field has been shown previously in 2D PIC MCC simulations41, 42 but the ionization intensity in the spoke in these simulations was much less important than in the present results and much smaller than ionization due to electron heating in the cathode sheath (and would therefore be more difficult to observe experimentally). Another issue is the relation between the simulated rotating spoke and the Critical Ionization Velocity (CIV) concept. The common points between the CIV model of Piel et al.59 and the present results are the presence of a double layer at the spoke front and the enhanced electron heating and ionization in that region but the reason for the formation of a double layer, the mechanism of electron heating, and the spoke velocity are distinct from those invoked in the CIV model. One can deduce from the present simulations that the azimuthal spoke velocity can take different values (positive as well as negative) depending on the conditions, which is in contradiction with the very principle of the CIV concept. Finally the simulations in this paper have been performed in argon in the conditions of magnetron discharges. Although we can suspect that the physics of rotating spokes in Hall thrusters and magnetron discharges share common characteristics, Hall thrusters operate in xenon and at significantly smaller magnetic fields. It seems therefore useful to develop a simplified model of instabilities in the region between the exhaust plane and the anode of a Hall thruster under standard conditions of magnetic field, dimensions, and xenon density.
DATA AVAILABILITY
The data that support the findings of this study are available from the corresponding author upon reasonable request.
REFERENCES
1 J. C. Adam, A. Héron, and G. Laval, Study of stationary plasma
thrusters using two-dimensional fully kinetic simulations, Phys. Plasmas 11, 295 (2004).