HAL Id: hal-02163842
https://hal.archives-ouvertes.fr/hal-02163842
Submitted on 15 May 2021
HAL is a multi-disciplinary open access
archive for the deposit and dissemination of sci-entific research documents, whether they are pub-lished or not. The documents may come from teaching and research institutions in France or abroad, or from public or private research centers.
L’archive ouverte pluridisciplinaire HAL, est destinée au dépôt et à la diffusion de documents scientifiques de niveau recherche, publiés ou non, émanant des établissements d’enseignement et de recherche français ou étrangers, des laboratoires publics ou privés.
Evidence of active dinitrogen fixation in surface waters
of the eastern tropical South Pacific during El Niño and
La Niña events and evaluation of its potential nutrient
controls
J. Dekaezemacker, Sophie Bonnet, O. Grosso, T. Moutin, M. Bressac, D.G.
Capone
To cite this version:
J. Dekaezemacker, Sophie Bonnet, O. Grosso, T. Moutin, M. Bressac, et al.. Evidence of active dinitrogen fixation in surface waters of the eastern tropical South Pacific during El Niño and La Niña events and evaluation of its potential nutrient controls. Global Biogeochemical Cycles, American Geophysical Union, 2013, 27 (3), pp.768-779. �10.1002/gbc.20063�. �hal-02163842�
Evidence of active dinitrogen
fixation in surface waters of the eastern
tropical South Paci
fic during El Niño and La Niña events
and evaluation of its potential nutrient controls
J. Dekaezemacker,1,2S. Bonnet,1O. Grosso,1T. Moutin,1M. Bressac,3,4and D.G. Capone5
Received 2 November 2012; revised 19 June 2013; accepted 8 July 2013; published 18 August 2013.
[1] Biological N2fixation rates were quantified in the Eastern Tropical South Pacific (ETSP) during both El Niño (February 2010) and La Niña (March–April 2011) conditions, and from Low-Nutrient, Low-Chlorophyll (20°S) to High-Nutrient, Low-Chlorophyll (HNLC) (10°S) conditions. N2fixation was detected at all stations with rates ranging from 0.01 to
0.88 nmol N L 1d 1, with higher rates measured during El Niño conditions compared to La Niña. High N2fixations rates were reported at northern stations (HNLC conditions) at the oxycline and in the oxygen minimum zone (OMZ), despite nitrate concentrations up to 30μmol L 1, indicating that inputs of new N can occur in parallel with N loss processes in OMZs. Water-column integrated N2fixation rates ranged from 4 to 53 μmol N m 2d 1at northern stations, and from 0 to 148μmol m 2d 1at southern stations, which are of the same order of magnitude as N2fixation rates measured in the oligotrophic ocean. N2fixation rates responded significantly to Fe and organic carbon additions in the surface HNLC waters, and surprisingly by concomitant Fe and N additions in surface waters at the edge of the subtropical gyre. Recent studies have highlighted the predominance of heterotrophic diazotrophs in this area, and we hypothesize that N2fixation could be directly limited by inorganic nutrient availability, or indirectly through the stimulation of primary production and the subsequent excretion of dissolved organic matter and/or the formation of micro-environments favorable for heterotrophic N2fixation.
Citation: Dekaezemacker, J., S. Bonnet, O. Grosso, T. Moutin, M. Bressac, and D. G. Capone (2013), Evidence of active dinitrogen fixation in surface waters of the eastern tropical South Pacific during El Nin˜o and La Nin˜a events and evaluation of its potential nutrient controls, Global Biogeochem. Cycles, 27, 768–779, doi:10.1002/gbc.20063.
1. Introduction
[2] Nitrogen (N) is an essential macronutrient for marine
productivity [Falkowski et al., 1998], and most of the surface ocean is depleted in dissolved inorganic N (DIN). In these areas, planktonic N2 fixing organisms referred to as
“diazotrophs” may have an ecological advantage because they are able to reduce dissolved N2gas to ammonia (NH3)
and assimilate it, alleviating their need for another external source of N. N2fixation represents one of the major sources
of new N to the surface oligotrophic ocean [Capone et al., 2005]. N2 fixation is thought to primarily occur in warm
(>24°C) [Breitbarth et al., 2007; Webb et al., 2009] and N-depleted oligotrophic tropical and subtropical areas of the ocean [Karl et al., 1992; Capone et al., 1997; Karl and Letelier, 2008].
[3] The reverse processes that remove N from the ocean,
denitrification [Goering, 1968] and anammox [Kuypers et al., 2003], primarily occur in oxygen-deficient sediments and, to a lesser extent, in the water column of oxygen mini-mum zones (OMZs). Biogeochemical modeling [Deutsch et al., 2007] and remote sensing [Westberry and Siegel, 2006] studies have recently predicted that N2fixation might
occur at significant rates in surface waters overlying regions of N losses such as the Eastern Tropical South Pacific (ETSP). Biological N2fixation has been poorly investigated
in OMZs in general and in the Eastern South Pacific [Luo et al., 2012] in particular. The paucity of observations and the few direct measurements of N2 fixation rates in this
region [Raimbault and Garcia, 2008; Moutin et al., 2008; Fernandez et al., 2011] make it difficult to draw conclusions concerning the biogeochemical importance of diazotrophy in the ETSP, which motivated this work.
[4] The N budget for the global ocean is poorly constrained
[Codispoti et al., 2001; Brandes and Devol, 2002; Codispoti,
Additional supporting information may be found in the online version of this article.
1Aix Marseille Université, CNRS/INSU, IRD, Mediterranean Institute of
Oceanography, Marseille, France.
2Now at Max Planck Institute for Marine Microbiology, Bremen,
Germany.
3ACRI-ST, Sophia-Antipolis, France. 4
CNRS-INSU, Université Pierre et Marie Curie-Paris 6, Laboratoire d’Océanographie de Villefranche/Mer, Observatoire Océanologique, Villefranche-sur-Mer, France.
5Department of Marine and Environmental Biology, University of
Southern California, Los Angeles, California, USA.
Corresponding author: J. Dekaezemacker, Max Planck Institute for Marine Microbiology, DE-28195 Bremen, Germany. (jdekaeze@mpi-bremen.de) ©2013. American Geophysical Union. All Rights Reserved.
2007], partly because most in situ studies on N2fixation are
performed on cyanobacterial diazotrophs in N-depleted warm areas [Capone et al., 1997; Zehr et al., 2001]. Another explanation is that potential N2fixation fluxes
attrib-uted to other prokaryotes and/or in N-rich waters are not included in global N budgets.
[5] The ETSP is an interesting case study for studying N2
fixation as it is composed of contrasting biogeochemical provinces. In addition, atmospheric iron deposition to this ocean area is amongst the lowest in the world [Jickells et al., 2005], and Fe availability appears to be limiting for pri-mary production in the region [Bonnet et al., 2008]. Due to the high Fe requirements for nitrogenase [Berman-Frank et al., 2001; Kustka et al., 2003a, 2003b], it is also suspected to control N2fixation [Paerl et al., 1994; Mills et al., 2004;
Saito et al., 2011], but this process and its controlling factors have been very poorly studied in this area.
[6] Finally, the El Niño-Southern Oscillation (ENSO)
sub-jects the ETSP to interannual climate variability, which impacts the strength of the upwelling and modifies the bio-geochemical functioning of this ecosystem. During El Niño events, marine productivity usually decreases [Arntz et al., 1988] compared to“normal” years due to the weaker upwell-ing of nutrient-rich waters, and waters are warmer than usual. In contrast, during La Niña years, the upwelling is stronger than“normal” years, leading to colder waters and higher pri-mary productivity [Behrenfeld et al., 2001]. The effect of this climatic interannual variability on N2fixation has never been
studied in the ETSP.
[7] We performed two cruises in the ETSP during both El
Niño and La Niña conditions and measured N2fixation rates
along a 5700 km transect exhibiting strong oxygen and nutri-ent gradinutri-ents. The objectives of this study were (1) to quantify N2 fixation rates across those gradients during
contrasted climatic and therefore upwelling conditions, and (2) to determine which nutrients control N2fixation rates in
surface waters.
2. Material and Methods
[8] Two research cruises took place in the ETSP in
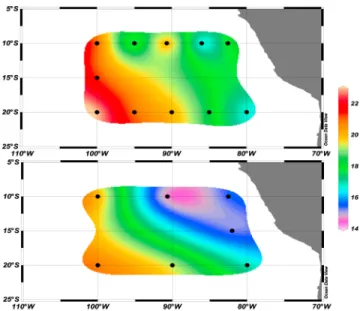
February 2010 and in March–April 2011. The 2010 cruise was carried out onboard the R/V Atlantis (Woods Hole Oceanographic Institution) during an El Niño event (Multivariate ENSO index: 1.52, developed at NOAA’s Climate Diagnostics Center and computed by Wolter and Timlin [1993, 1998], taken from the web site http://www. esrl.noaa.gov/psd/enso/mei.table.html), and the 2011 cruise was performed onboard the R/V Melville (Scripps Institution of Oceanography) during a La Niña event (Multivariate ENSO index: 1.49). The southern transect (stations 1 to 5) started at 20°S, 80°W and proceeded along 20°S to 100°W (Figure 1) in Nutrient, Low-Chlorophyll waters associated with the South Pacific Gyre [Claustre and Maritorena, 2003]. Surface waters exhibited nitrate (NO3) concentrations close to detection limit, which
is known to be favorable for N2fixation. The northern
tran-sect (including stations 7 to 11, Figure 1) started at 10°S, 100°W and extended along 10°S to 82.5°W, in upwelled rich waters. These conditions create High-Nutrient, Low-Chlorophyll (HNLC) conditions in surface [Martin et al., 1994; Blain et al., 2008] with relatively high phosphate (PO43 ) and NO3 concentrations (Table 1) and an OMZ at
depth [Ulloa and Pantoja, 2009]. Experiments were performed at 11 stations in 2010 and at 6 stations in 2011 (Figure 1 and Table 1).
2.1. Sampling Procedures 2.1.1. Vertical Profiles
[9] Seawater was sampled using a CTD-rosette equipped
with 12 L Niskin bottles. During the 2010 cruise, individual samples for N2fixation rate determination were collected in
the euphotic zone at 6 depths between the upper 10 m and 200 m for the southern transect, and within the upper 150 m for the northern transect. During the 2011 cruise, triplicate samples were collected at 4 or 5 depths within and just below the euphotic zone. N2fixation rates (nmol L 1d 1) were
de-termined according to Montoya et al. [1996] (further details are given in the supporting information). However, the method to measure N2fixation is currently in debate, and it has been
noted that the method we used may underestimate rates due to incomplete equilibration of15N
2gas in the water [Mohr
et al., 2010]. Therefore, the results presented in the present study should be considered as minimum rates, and in the con-text of the unbalanced N budget [Codispoti et al., 2001; Brandes and Devol, 2002; Codispoti, 2007], they prove that N2fixation can occur in unexpected areas of the Ocean.
[10] At some stations on the northern transect, the OMZ was
shallow. For samples from the hypoxic-anoxic depths, care was made to avoid O2contamination and to perform
incuba-tions under strict anoxic condiincuba-tions as described in Hamersley et al. [2011]. Bottles werefilled with milli-Q water, thenflushed with Argon and filled with the seawater sample by tubing into the bottom of the Argon-filled bottles to minimize aeration.
[11] At each depth, samples for DIN (NO3+ NO2) and
PO43 concentrations determination were collected in
acid-washed 20 mL polyethylene flasks, immediately poisoned with HgCl2 (i.e., final concentration of 20 μg mL 1)
[Kirkwood, 1992] and stored at 4°C until analysis. Figure 1. Location of stations during the cruises in (a)
February 2010-El Niño conditions and in (b) March–April 2011-La Niña conditions on a map of seawater temperature (°C) at 75 m depth.
2.1.2. Nutrient Sensitivity Assays of N2Fixation
in Euphotic Zone
[12] All N2fixation sensitivity assays were performed
un-der strict trace metal clean conditions [Bruland et al., 1979]. Seawater was sampled at ~15 m depth using a trace metal-clean Teflon pump system connected to a PVC tube. The 4.5 L bottles (washed with trace metal grade acid) were rinsed andfilled with 200 μm-prefiltered seawater. In a lam-inarflow hood, the bottles were then amended with individ-ual nutrients or in combination: +Fe (at all the stations of both cruises), +N (or +FeN), +P, and +Glucose (Glc), (at three stations of the 2010 cruise) to reachfinal concentrations of 4 nmol L 1FeCl3, 4μmol L 1NaNO3(99.99% Suprapur,
Merck), 1μmol L 1 NaH
2PO4(99.99% Suprapur, Merck),
and 10μmol L 1 chelexed Glucose (Chelex®100 Molecular Biology Grade Resine 200–400 Mesh, Sodium Form, BioRad, activated using HCl trace metal grade, Fisher Scientific and NaOH; neither HNO3 nor NH4OH
was used to avoid N contaminations, which could affect N2
fixation). Each nutrient amendment was performed in tripli-cates, and triplicate bottles were kept unamended as controls. Bottles were then incubated at 50% ambient light in an on-deck incubator with circulating surface seawater. After 24 h, all bottles were spiked with stable isotopes (15N
2), and
incubated under the same conditions for another 24 h. After incubation, the three replicates of each treatment were used in order to measure N2fixation rates and nutrient
concentra-tions. Nutrient concentrations were also measured just after the fertilization in order to confirm the nutrient additions (data not shown).
[13] Samples were also collected at time zero (T0) at the
depth of the experiments in order to characterize initial bio-geochemical conditions at every station (Table 1). N2fixation
and macronutrient samples were collected as described above. For dissolved iron (DFe) concentrations, samples were collected in triplicates using the Teflon pump by in-line filtration performed through a 0.2 μm cartridge (Sartorius Sartrobran-P-capsule 0.45μm prefilter and 0.2 μm final fil-ter) and immediately acidified to pH < 2 with ultrapure HCl (Ultrapur, Merck).
2.2. Analyses
2.2.1. Mass Spectrometry
[14] The isotopic enrichment analyses were performed by
continuous flow isotope ratio mass spectrometry using an Integra-CN mass spectrometer using the procedure described in Bonnet et al. [2011]. The accuracy of the system was verified regularly using reference material (International Atomic Energy Agency (IAEA), Analytical Quality Control Services). The isotopic enrichment was calibrated using IAEA reference material (IAEA-N-1) every 10–15 samples. The linearity of15N atom % as a function of increasing
par-ticulate nitrogen mass was verified on both natural and15N enriched material since it is critical, especially for samples from ultra-oligotrophic environments.15N atom % was linear (Fisher test, p<0.01) between 0.20 and 39 μmol N, which is within the range of particulate nitrogen measured in all of our 4.5 L incubations (minimum quantities of N per sample var-ied from 0.21 to 0.66 and maximum varvar-ied from 1.68 to 8.68μmol N, depending on the station). Quantification limits for N2 fixation rates were 0.01 nmol L 1 d 1. N2 fixation
Table 1. Initial Characteristics for the Nutrient Enrichment Experiments a Stat ion 1 Station 2 S tation 3 Station 4 S tation 5 Station 6 19 .99°S 79.98° W 20°S 85°W 20 °S 90°W 20°S 95°W 20 °S 10 0°W 15 °S 10 0°W Lat itude Lon gitude 20 10 (Atlantis) 20 11 (Melville) 20 10 (Atlantis) 2010 (At lantis) 20 10 (Atlantis) 20 10 (Atlantis) 20 11 (Melville) 20 10 (Atlanti s) NO 3 (μ mol L 1 ) 0.10 ± 0.08 0.08 ± 0.0 5 < 0.0 8 0.88 ± 0.1 2 1.36 ± 0.22 0.08 ± 0.08 < 0.01 2.00 ± 0.23 PO 4 3 (μ mol L 1 ) 0.44 ± 0.04 0.46 ± 0.0 7 0.38 ± 0.04 0.42 ± 0.0 4 0.42 ± 0.04 0.39 ± 0.04 0.38 ± 0.0 5 0.60 ± 0.04 DF e (nmo lL 1 ) 0.16 ± 0.005 1.57 ± 0.0 9 0.1 4 ± 0.003 0.16 ± 0.0 3 0.16 ± 0.01 0.15 ± 0.03 1.57 ± 0.1 6 0.18 ± 0.03 P*, rP/N = 1/16 (μ mol L 1 ) 0.4 4 0.45 0.38 0.37 0.33 0.39 0.36 0.47 Fe* , rFe/P = 0.47 (n mol L 1 ) 0.05 1.35 0.0 4 0.04 0.0 3 0.03 1.39 0.1 0 N2 fi xation (nmol L 1 d 1 ) 0.74 ± 0.11 0 0 0 0 0.23 ± 0.06 0.02 ± 0.002 0 station 7 statio n 8 station 9 statio n 1 0 station 11 statio n 1 2 10 °S 10 0°W 10°S 95°W 10 °S 90.67 °W 10°S 86°W 10 °S 82.5°W 15 °S 82 °W Lat itude Lon gitude 20 10 (Atlantis) 20 11 (Melville) 20 10 (Atlantis) 20 10 (Atlantis) 20 11 (Melville) 20 10 (Atla ntis) 20 10 (Atlantis) 20 11 (Melvill e) 2011(L a Nin a) NO 3 (μ mol L 1 ) 5.60 ± 0.60 6.73 ± 0.6 9 5.40 ± 0.60 < 0.06 6.98 ± 0.556 1.88 ± 0.20 0.36 ± 0.07 3.13 ± 0.1 9 0.37 ± 0.07 PO 4 3 (μ mol L 1 ) 0.71 ± 0.05 0.67 ± 0.0 5 0.65 ± 0.05 0.43 ± 0.04 0.67 ± 0.0 6 0.75 ± 0.05 0.36 ± 0.04 0.42 ± 0.0 8 0.49 ± 0.03 DF e (nmo lL 1 ) 0.14 ± 0.04 1.56 ± 0.0 5 0.15 ± 0.05 0.13 ± 0.002 1.81 ± 0.3 6 0.26 ± 0.11 0.17 ± 0.02 1.89 ± 0.4 2 1.95 ± 0.48 P*, rP/N = 1/16 (μ mol L 1 ) 0.3 6 0.25 0.31 0.4 2 0.23 0.63 0.34 0.23 0.47 Fe* , rFe/P = 0.47 (n mol L 1 ) 0.20 1.24 0.1 5 0.07 1.50 0.0 9 0.003 1.69 1.71 N2 fi xation (nmol L 1 d 1 ) 0 0 0 0 0.59 ± 0.4 8 0 0.13 ± 0.05 0 0.05 ± 0.01 an.a., not availa ble.
measurements were depth-integrated between 0 and 150 or 200 m in order to determine areal rates (μmol m 2d 1). 2.2.2. Macronutrients, Dissolved Fe Analyses, and Biogeochemical Tracers
[15] DIN (NOx= NO3+ NO2) and PO43 samples were
ana-lyzed using an AutoAnalyzer 3 Digital Colorimeter (Bran Luebbe) according to standard automated colorimetric methods [Aminot and Kerouel, 2007]. The respective lower detection limits were 5 and 9 nmol L 1. For better readability, the sum
of the NO3 and NO2 will hereafter be referred to as NO3.
[16] Dissolved Fe analyses were performed in a clean
room by flow injection with online preconcentration and chemiluminescence detection (FIA-CL) according to Bonnet and Guieu [2006]. The mean detection limit was 4 pmol L 1, and the mean blank was 0.07 ±
0.01 nmol L 1. The calibration curve has been realized by using 0.2μm filtered DFe-poor water, enriched with a standard solution of Fe (III), with at least five points. For each run of analyses, the precision and the stability of the measurements have been controlled with an internal standard, but also with SAFe-D1 and SAFe-D2 standards. The reliability of the method was assessed by analyzing the SAFe-D1 (0.676 ± 0.059 nM; consensus value = 0.65 ± 0.01 nM) and D2 (0.937 ± 0.029 nM; consensus value = 0.923 ± 0.029 nM).
[17] Based on these concentrations measurements and
on the common stoichiometry of nutrient needs for phyto-plankton (N:P ratio = 16:1) [Redfield et al., 1963], two tracers were considered in order to describe the biogeochemical en-vironment before nutrient additions.
[18] Thefirst one was P*, defined as P* = [PO43 ] - [NO3]/
16 [Deutsch et al., 2007]. P* informs about the relative changes of NO3 and PO43 concentrations in oceanic waters.
Decreases in surface ocean PO43 that are unaccompanied by
concomitant Redfield-ratio decreases in NO3 (P* decreases)
are interpreted as the result of N2fixation.
[19] The second one was the Fe*, defined as Fe* = [DFe]
0.47 mmol mol 1× [PO 4
3 ] which determines the possible
degree of Fe limitation [Parekh et al., 2005] assuming afixed Fe:P ratio of 0.47 mmol mol 1 during uptake, export and
remineralization [Anderson and Sarmiento, 1994]. 2.2.3. Uncertainties and Statistics
[20] For nutrient concentrations, uncertainties were
calcu-lated using partial derivation as propagation of uncertainties [Hydes et al., 2010]. The expanded measurement uncertainty was used, with a coverage factor k = 2 (i.e., confidence inter-val of 95%). Uncertainties were calculated as the standard de-viation calculated for triplicates assays for N2fixation rates
from the nutrient enrichment experiments and from the pro-files of the 2011 cruise.
Figure 2. Depth distribution (a and b) N2fixation (nmol L 1d 1), (c and d) O2concentrations (μmol
kg 1), and (e and f) NO3 and (g and h) PO43 concentrations (μmol L 1) along the southern transect
[21] To compare the effect of nutrient addition on N2
fixa-tion rates, we calculated the relative change (%) for each var-iable as 100 × (E C)/C, where E and C are the mean value of the variable in the enrichment and the control treatments, respectively. For each variable, we calculated the standard deviation of the relative change by propagating the standard deviation of the measurements in both conditions. The differ-ences between treatments for each variable were analyzed using the non-parametric Mann-Whitney, one-tailed test.
3. Results
3.1. In Situ N2Fixation Rates and Biogeochemical
Conditions in the ETSP
3.1.1. N2Fixation Rates During the 2010 Cruise
[22] N2fixation rates across the 20°S transect were highest
at the western and eastern ends of the transect (Figure 2a). At station 1 (80°W), a maximum value of 0.80 nmol N L 1 d 1was measured at 60 m depth, and at station 5, at the edge
of the subtropical gyre (100°W), a rate of 0.88 nmol N L 1d 1 was measured between 80 and 135 m depth. The three stations between 85 and 95°W exhibited rates<0.06 nmol N L 1d 1
(Figure 2a). The water column of the southern transect was well oxygenated (Figure 2c) with O2 concentrations> 190
μmol kg 1, except at station 1 below 120 m, where O 2
concentrations decreased with depth to reach a minimum value of 60μmol O2kg 1at 200 m depth. Surface NO3
con-centrations varied from 0.13 ± 0.06μmol L 1at stations 2 and
4 to 0.39 ± 0.07μmol L 1at station 3 (Figure 2e). Surface PO43 concentrations varied from 0.35 ± 0.04μmol L 1at
sta-tion 2 to 0.44 ± 0.04μmol L 1at stations 1 and 3 (Figure 2g).
NO3 and PO43 concentrations increased with depth to
20.8 ± 2.1μmol L 1and 1.79 ± 0.09μmol L 1for NO3 and
PO43 concentrations at 150 m at Station 1, respectively. The
depth of the nutricline shoaled to the east.
[23] On the northern transect (10°S), N2fixation rates were
maximum (0.08–0.57 nmol N L 1d 1) between 50 m and 150 m at all stations (from 85 to 100°W), except the one close to the coast (80°W), where the highest rate over the vertical was measured at 20 m (0.27 nmol N L 1d 1) (Figure 3a). At stations 9 (90°W) and 11 (82.5°W), measurable rates (0.40 and 0.27 nmol N L 1 d 1) were also detected shallower, at 20 and 25 m depth, respectively (Figure 3a). Surface waters were well oxygenated, and O2concentrations
decreased with depth, with a shallower oxycline shoaling eastward; suboxic conditions ([O2]< 20 μmol kg 1,
Paulmier and Ruiz-Pino [2008]) were reached at 124, 117, 109, 95, and 116 m depth, respectively, for stations 7, 8, 9, 10, and 11 (Figure 3c). Surface nutrients exhibited a strong gradient with NO3 concentrations varying from 5.89 ± 0.64
Figure 3. Depth distribution (a and b) N2fixation (nmol L 1d 1), (c and d) O2concentrations (μmol kg 1),
and (e and f) NO3 and (g and h) PO43 concentrations (μmol L 1) along the northern transect (10°S) between
to 0.46 ± 0.08 μmol L 1 and PO43 concentrations from
0.72 ± 0.05 to 0.38 ± 0.04μmol L 1, from the offshore sta-tion 7 (100°W) to the most coastal stasta-tion 11 (82.5°W) (Figures 3e and 3g). NO3 and PO43 concentrations increased
with depth to reach values from 28.0 ± 2.8 (station 7) to 30.8 ± 3.1 (station 8)μmol L 1, and from 2.41 ± 0.12 (station 8) to 3.73 ± 0.20 (station 11) μmol L 1 at 150 m, respec-tively. At station 11, NO3 concentrations of 29.80 ± 2.97
μmol L 1
and PO43 concentrations of 3.73 ± 0.20 μmol
L 1
were measured at 150 m. The NO3 isocline 10μmol
L 1was at 100 m at station 7, between 50 and 90 m at station 9, and between 20 and 35 m at station 11.
[24] The station 6 (15°S 100°W, Figure 1) was characterized
by N2fixation rates of 0.32 and 0.37 nmol N L 1d 1at 150
and 200 m depth (Figure 4a). O2concentrations were
homoge-neous and ≥75 μmol kg 1 from the surface to 200 m (Figure 4c). Surface concentrations of NO3and PO43 were,
re-spectively, 1.69 ± 0.28μmol L 1(Figure 4e) and 0.58 ± 0.05 μmol L 1
(Figure 4g) and increased with depth to reach 2.93 ± 0.35μmol L 1and 0.61 ± 0.05μmol L 1at 200 m. 3.1.2. N2Fixation Rates During the 2011 Cruise
[25] Only stations 1 and 5 were sampled along the southern
transect. The highest N2fixation rates (0.87 nmol N L 1d 1,
Figure 2b) were measured at station 1 at 80 m. At station 5, rates were low (<0.06 nmol N L 1d 1) or undetectable over the vertical profile. The water column was still well
oxygenated (Figure 2d) with O2concentrations> 200 μmol
kg 1, except at station 1 below 135 m, where O2
concentra-tions decreased with depth to reach 90μmol kg 1at 200 m depth. Surface NO3 and PO43concentrations at station 1 were
0.12 ± 0.09μmol L 1(Figure 2f) and 0.41 ± 0.04μmol L 1 (Figure 2h), respectively. Nutrient concentrations increased with depth to reach 22.7 ± 0.6 μmol L 1 for NO3 and
1.79 ± 0.07μmol L 1for PO43 at 200 m. At station 5, surface
nutrient concentrations were 0.06 ± 0.08μmol L 1for NO3
(Figure 2f), and 0.32 ± 0.05 μmol L 1 for PO43
(Figure 2h). NO3 concentrations increased with depth up to
1.71 ± 0.39 μmol L 1 at 150 m, but a minimum of 0.10 ± 0.06μmol L 1was found at 120 m. PO43
concentra-tions reached 0.37 ± 0.05μmol L 1at 200 m.
[26] Across the northern transect, N2fixation rates varied
from below the quantification limit to a maximum value of 0.59 ± 0.48 nmol L 1 d 1 at 15 m depth of station 9 (Figure 3b). The oxycline was shallow at the eastern end of the transect, and suboxic conditions were reached at 76, 38, and 36 m depth, respectively, at stations 7, 9, and 11 (Figure 3d). Surface NO3 and PO43 concentrations varied
from 6.77 ± 0.46 to 2.28 ± 0.28 μmol L 1, and from 0.60 ± 0.04 to 0.39 ± 0.08μmol L 1from the western to east-ern ends of the transect (Figures 3f and 3h), respectively. The nutriclines were also shallower on the eastern part of the tran-sect, and the NO3 isocline 10 μmol L 1was between 100
Figure 4. Depth distribution (a and b) N2fixation (nmol L 1d 1), (c and d) O2concentrations (μmol
kg 1), and (e and f) NO
3 and PO43 concentrations (μmol L 1) along the western transect (100°W) in El
Niño year (Figures 4a, 4c, 4e, and 4g) and along the eastern transect (82.5°W) in La Niña year (Figures 4b, 4d, 4f, and 4h).
and 150 m at station 7, between 25 and 35 m at station 9 and between 20 and 60 m at station 11.
[27] At Station 12 (15°S 82.5°W, Figure 1), N2fixation
rates varied from below the quantification limit at 85 m depth to 0.09 ± 0.04 nmol N L 1d 1at 30 m depth (Figure 4b). O2
concentrations decreased below 39 m depth and reached suboxic conditions at 101 m depth (Figure 4d). Surface NO3
and PO43 concentrations were 0.36 ± 0.07μmol L 1
(Figure 4f) and 0.52 ± 0.05μmol L 1(Figure 4h), respectively, and increased to 22.7 ± 0.3μmol L 1and 2.51 ± 0.06μmol L 1
at 150 m. At this station, NO3 concentrations were
interme-diate between those of stations 1 (20°S) and 11 (10°S). PO43 concentrations were the highest of the transect at
this station.
3.2. Nutrient Controls of N2Fixation
3.2.1. Initial Biogeochemical Conditions
[28] Experiments performed along the southern transect
(stations 1 to 5) were conducted under in situ conditions char-acterized by low NO3 (<1.4 μmol L 1) and PO43 (<0.4
μmol L 1
) concentrations during both cruises (Table 1). In contrast, DFe conditions exhibited a clear temporal variability,
with concentrations 10 times higher during the La Niña condi-tions experienced on the 2011 cruise (1.57 nmol L 1)
com-pared to the El Niño conditions experienced on the 2010 cruise (0.14 to 0.16 nmol L 1). The P* tracer was constant
be-tween the two years with value bebe-tween 0.33 and 0.45μmol L 1. The Fe* was negative but close to 0 nmol L 1during
the 2010 cruise and positive during the 2011 cruise.
[29] The biogeochemical conditions on the northern
tran-sect (stations 7 to 11) exhibited greater variability between the 2 years (Table 1). For example, surface NO3
concentra-tions were lower during the 2010 cruise than the 2011 cruise, i.e., ranging from detection limit to 5.60μmol L 1in 2010,
and from 0.37 to 6.73μmol L 1in 2011, with decreasing concentrations from west to east. The PO43 concentrations
were high across this transect (from 0.36 ± 0.04 to 0.71 ± 0.05μmol L 1). DFe concentrations were also higher
in 2011 compared to 2010. The P* tracer showed variations between stations and higher values (from 0.31 to 0.63μmol L 1) in 2010 compared to 2011 (from 0.23 to 0.25 μmol L 1). The Fe* was negative or equal to zero during El Niño
conditions (from 0.20 to 0 nmol L 1) and positive during La Niña conditions (from 1.24 to 1.69 nmol L 1).
Figure 5. Relative change (%) in N2fixation in nutrient-amended bottles as compared with the control
bottles for each station, after Fe addition in (a) 2010 and in (b) 2011, and after (c) N addition at station 1 and 9 or FeN addition at station 5 (dark gray), P addition (gray), Glc addition (light gray) in 2010. Relative change was calculated as 100 × ([mean in treatment mean in control] / mean in control). Error bars indicate: 1 SD. Value of 200% (Figures 5a–5c) and 450% (Figure 5b) are arbitrarily chosen and double asterisks are added for showing appearance of N2fixation after nutrient addition. Simple or
double asterisks denote the existence of significant differences in the mean between the control and the treatment bottles (Mann-Whitney test, one tailed; *: p< 0.05).
3.2.2. N2Fixation During Nutrient Sensitivity Assays
[30] In unamended triplicate controls, N2fixation rates on
the 2010 cruise were measurable at stations 1, 5, and 11 with respective rates of 0.74 ± 0.11, 0.23 ± 0.06, and 0.13 ± 0.05 nmol N L 1d 1(Table 1). After Fe additions, N2fixation
was significantly (Mann-Whitney test, one-tailed, p > 0.05) stimulated at station 11 (Figure 5a, see also supporting infor-mation Table S1), with rates reaching 0.26 ± 0.03 nmol N L 1d 1, corresponding to a 100 ± 30% increase. At stations 1 and 5 (Southern transect), N2fixation was not stimulated by
Fe additions. At stations 2, 3, 4, 6, 7, 8, 9, and 10, N2fixation
was not detectable (<0.01 nmol N L 1 d 1) in control
(unamended) treatments. After Fe additions, N2 fixation
was detectable at stations 8, 9, and 10, with respective rates of 0.53 ± 0.17, 0.17 ± 0.01, and 0.52 ± 0.20 nmol N L 1d 1 (Figure 5a), and rates remained undetectable at stations 2, 3, 4, 6, and 7 (Figure 5a). Moreover, concomitant Fe and N additions significantly stimulated (Mann-Whitney test, one-tailed, p> 0.05) N2fixation rates at station 5 by 61 ± 13%
(Figure 5c) with rates reaching 0.37 ± 0.02 nmol N L 1
d 1, while Fe alone did not stimulate N2fixation. At station
9, Glc additions resulted in appearance of measurable N2
fix-ation with rates of 0.25 ± 0.09 nmol N L 1d 1(Figure 5c). [31] On the 2011 cruise, N2fixation was measurable in
control treatments at stations 5, 9, and 12 with rates of 0.02 ± 0.002, 0.59 ± 0.48 and 0.05 ± 0.01 nmol N L 1 d 1
but not detected at stations 1, 7, and 11 (Table 1). Rates were significantly (Mann-Whitney test, p < 0.05) stimulated by Fe additions at station 9 by 296 ± 108% (Figure 5b), correspond-ing to rates of 2.34 ± 0.23 nmol L 1 d 1. At station 11
(Figure 5b), N2 fixation rates were undetectable, but after
Fe additions, they reached 1.48 ± 0.32 nmol N L 1d 1.
4. Discussion
[32] The positive P* tracer (Table 1) indicates that the ETSP
ocean is a location of strong N losses with upwelled denitrified waters. However the decrease of P* (Table 1) between some stations (e.g., from station 1 to station 3 in 2010 or from station 9 to station 7 in 2011) indicates that N2fixation probably
oc-curs in these waters, which is confirmed by our results. Finally, the high positive Fe* (Table 1) in 2011 indicates that there is enough iron to support the complete consumption of PO43 . Positive values of Fe* were also observed in the
up-welling region of the ETSP [Blain et al., 2008]. Fe* tracer sub-tracts the contribution of remineralization of organic matter to DFe, and this region is known to receive the lowest aeolian
deposition in the world [Jickells et al., 2005]; we can thus as-sume that most of the iron came from physical transport. 4.1. N2Fixation in the ETSP
4.1.1. N2Fixation in Oligotrophic Conditions
[33] During both cruises, N2fixation was detected along
the southern transect (Figures 2a and 2b). Rates measured at 100°W (station 5) and 80°W (station 1) during the 2010 cruise (Multivariate ENSO Index: 1.52) were in good agree-ment with those measured during another study in the same area [Raimbault and Garcia, 2008] during El Niño conditions (BIOSOPE cruise, October–November 2004, Multivariate ENSO Index: 0.78).
[34] On the 2011 cruise, which took place during La Niña
conditions, surface NO3 and PO43 concentrations were
higher, potentially due to the extension and the enhancement of the upwelling [Behrenfeld et al., 2001]. Similarly, eupho-tic zone DFe concentrations were ~10 times higher in 2011 compared to 2010 across the southern transect (Table 1). In spite of NO3 depletion, probably caused by phytoplankton
consumption, relatively high PO43 and Fe concentrations
remained (Table 1). These conditions are supposed to be the most favorable conditions for cyanobacterial N2fixation
[Sañudo-Wilhelmy et al., 2001; Berman-Frank et al., 2001; Mills et al., 2004], but N2fixation rates were very low at
the edge of the subtropical gyre (Station 5) during the 2011 cruise (Figure 2b), nor was stimulated by Fe additions (Figure 5b). N2fixation appears to be highly variable in space
and time [Goebel et al., 2007], and controlling factors may actually depend on the diazotroph species considered. A joint study to our measurements (K. A. Turk-Kubo et al., The par-adox of marine heterotrophic nitrogenfixation: Abundances of heterotrophic diazotrophs do not account for nitrogen fix-ation rates in the Eastern Tropical South Pacific, submitted to Environmental Microbiology) and recent investigations [Bonnet et al., 2008; Halm et al., 2012] have shown that het-erotrophic diazotrophs such as Proteobacteria are dominant in this region and contribute significantly to N2 fixation in
the ETSP. The physiology of these uncultivated heterotro-phic diazotrophs remains unknown, but their activity seems to be important. Areal rates (Table 2) of N2fixation varied
from 0 to 148μmol N m 2d 1during the 2010 cruise, and from 5 to 99 μmol N m 2 d 1 during the 2011 cruise.
These rates are comparable to those measured in other oligo-trophic areas of the ocean (Table 2) such as the North Pacific gyre [Montoya et al., 2004] or the tropical Atlantic [Voss et al., 2004; Capone et al., 2005].
Table 2. Range of Marine Areal Rates of N2Fixation in Contrasting Oceanic Environments
Location
Areal Rates Integration Depth
Source (μmol m 2d 1) (m)
Eastern North Pacific gyre 520 Mixed layer Montoya et al. [2004] North Atlantic 59–898 15 (Trichodesmium) Capone et al. [2005]
Tropical Atlantic 4–255 100 Voss et al. [2004]
Equatorial Pacific 18–358 Bonnet et al. [2009]
ETSP Coastal OMZ 7–190 120 Fernandez et al. [2011]
ETSP Subtropical gyre 12–190 150–200 Halm et al. [2012]
ETSP 10°S transect 2010 6–53 120–150 This study
ETSP 20°S transect 2010 0–148 150–200 This study
ETSP 10°S transect 2011 4–13 50–120 This study
4.1.2. Changes in the Common Concepts About N2Fixation
[35] In addition to N2fixation occurring in the euphotic zone
of the southern (20°S) transect, significant N2 fixation rates
were also measured in the northern transect (HNLC waters), exhibiting surface NO3 concentrations of up to
6.98μmol L 1. HNLC waters are unusual ecosystems for N2
fixation as these environments are characterized by cold wa-ters, rich in NO3 and limited by Fe availability. However,
few studies have already been reported this process [Moutin et al., 2008; Bonnet et al., 2009] in such environments.
[36] N2fixation was also active below the photic zone down
to 200 m, in the core of the OMZ, despite NO3 concentrations
are up to 40μmol L 1(Figures 3e and 3f). Significant rates
have been recently reported in the coastal Peruvian OMZ [Fernandez et al., 2011] or at depth of hypoxic basins [Hamersley et al., 2011] in the Southern California Bight. In the Peru-Chile OMZ, associated with the upwelling [Ulloa and Pantoja, 2009], denitrification and anammox also occur [Castro-González et al., 2005; Hamersley et al., 2007; Lam et al., 2009], creating an N deficit compared to P, which has been predicted to create favorable biogeochemical conditions for N2 fixation in overlying euphotic zone waters [Deutsch
et al., 2007]. Moreover, biological N2fixation is a strictly
an-aerobic process [Falkowski, 1997] due to the sensitivity and the irreversible inactivation of the nitrogenase enzyme by O2
[Burgess and Lowe, 1996]. It is therefore possible that the low O2concentrations in the OMZ contribute to the protection
of the enzyme [Fay, 1992] and decrease the energy cost to keep intracellular anaerobiosis [Großkopf and LaRoche, 2012], thus facilitating N2 fixation in this environment.
Finally, redox conditions in the OMZ maintain a higher pro-portion of Fe in its most available form (Fe(II)) [Moffett et al., 2007], which could help to support the high Fe require-ments for the nitrogenase [Berman-Frank et al., 2001; Kustka et al., 2003a, 2003b]. For all these reasons, OMZs could rep-resent a suitable habitat for N2-fixing organisms despite high
NO3 concentrations. Our results support this hypothesis
(Figures 3a and 3b), especially during the 2010 cruise, indicat-ing that prevailindicat-ing assumptions regardindicat-ing N2 fixation in
N-depleted areas may be reevaluated.
[37] Active N2 fixation in ecosystems with appreciable
NO3, including nutrient-enriched estuarine and coastal waters
[Short and Zehr, 2007, Rees et al. 2009, Bonnet et al., 2011], hypoxic basins [Hamersley et al., 2011], or at depth in the tropical North Atlantic [Voss et al., 2004], has become pro-gressively better documented. In oxic waters, breaking the tri-ply bound N2molecule in N2fixation is energetically more
costly compared to the assimilation of NO3 [Falkowski,
1983; Karl et al., 2002, Großkopf and Laroche, 2012], which provides a thermodynamic rationale for community selection for NO3 utilizers when it is available. Moreover, NO3 is
rec-ognized to inhibit N2 fixation activity of Trichodesmium
[Mulholland and Capone, 2001], although even 10 μmol L 1 NO3 did not fully inhibit nitrogenase activity in
Trichodesmium [Holl and Montoya, 2005]. Similarly, a recent study performed on Crocosphaera watsonii [Dekaezemacker and Bonnet, 2011] has shown that this strain is able tofix dinitrogen at high rates under 10μmol L 1of NO3. A
compar-ative study between these two cyanobacterial diazotrophs (Trichodesmium and Crocosphaera) [Knapp et al., 2012] re-ports that both organisms fixed the same quantity of N
normalized to cell carbon in different culture conditions (i.e., different NO3: PO43 ratios) representative of the nutrient
con-centrations of the ETSP. Our results in the OMZ as well as cul-ture studies, demonstrate that some species of diazotrophs can actively fix N2 in the presence of NO3. Indeed, areal
(0–200 m) N2fixation rates (Table 2) in the northern transect
varied from 6 to 53μmol N m 2d 1thefirst year and from 4 to 13μmol N m 2d 1the second year.
4.1.3. Temporal Variability of N2Fixation and Potential
Impact on N Budget in the ETSP
[38] This study provides thefirst data of N2fixation across
the Peru-Chile upwelling for two consecutive years (in February 2010 and March 2011) marked by different climatic regimes. ENSO variations could have contributed to the var-iability of N2fixation in the upwelling zone between the 2
years, potentially due to the variations of the strength of the upwelling, the availability of the nutrients, and the intensity of O2deficiency. The ENSO variations could also modify
rates of denitrification and anammox, resulting in an interannual change in N gain and loss processes. Additionally, the possible future expansion of the OMZs [Stramma et al., 2008] could result in a complete change in the oceanic N cycle. If we compare our vertically integrated rates of N2fixation from more landward stations (i.e., stations
1, 11, and 12) to the rates of anammox reported in the Peruvian OMZ by Hamersley et al. [2007] (Multivariate ENSO index: 0.559) and considering anammox as the only contributor of N losses in the ETSP [Lam et al., 2009], N gains by N2fixation could compensate for 6% of the losses
during El Niño conditions and up to 8% of the losses during la Niña period. However, at the regional scale, the compensa-tion of N losses by N2fixation is probably higher due to the
large spatial extension of N2fixation (i.e., up to 100°W)
com-pared to the restricted zone (coastal OMZ) where anammox and denitrification occur (i.e., reported by studies in the ETSP from the coast up to 85°W maximum) [Lipschultz et al., 1990; Hamersley et al., 2007; Lam et al., 2009]. Furthermore, the 15N
2 bubble method [Montoya et al.,
1996] used for measuring N2 fixation in the present study
has recently been shown to possibly underestimate rates [Mohr et al., 2010] by a factor of 2 to 6 [Wilson et al., 2012, Großkopf et al., 2012]. Therefore, the N compensation by N2fixation would likely be somewhat higher than that
estimated above.
4.2. Nutrient Controls of N2Fixation
[39] Surface waters of the northern transect are known to
be HNLC waters [Martin et al., 1994; Blain et al., 2008], where Fe availability limits NO3utilization and primary
pro-ductivity [Martin et al., 1994; Price et al., 1994]. Our results show that Fe availability can also be limiting for N2fixation
in these waters (Figures 5a and 5b). At station 11 on the 2010 cruise and station 9 of the 2011 cruise, Fe additions signi fi-cantly stimulated N2fixation rates. At most of the other
sta-tions (8, 9, 10 during the 2010 cruise and 11 during the 2011 cruise), inactive diazotrophs were present in these NO3-rich waters, and Fe addition stimulated their activity
(Figures 5a and 5b). In the equatorial Pacific, Fe additions pro-mote the planktonic community to switch from regenerated production based on NH4+ consumption to new production
based on NO3 consumption [Price et al., 1991]. As N2
production [Dugdale and Goering, 1967], Fe additions may allow utilization of this more energetically expensive pathway of N-nutrition thereby providing access to a larger N pool. This study demonstrates that in the ETSP, as in North Atlantic [Mills et al., 2004] (Figure 6a), Fe limits N2fixation
rates, but during both El Niño and La Niña conditions and even relatively low or high Fe concentrations (Figure 6b). The degree to which Fe is accessible to these diazotrophs is still unknown due to the uncertainties about chemical and physical Fe speciation in the surface waters of the ETSP [Wells, 2003], to the unknown and probably high Fe require-ment of these diazotrophs, and to the probably high competi-tion for Fe with other planktonic organisms.
[40] Primary production in the warm and oligotrophic
sub-tropical gyre is N limited [Bonnet et al., 2008]. Due to the rel-atively high PO43 and low NO3 concentrations, especially
on the 20°S transect, one would predict that these macronu-trient concentrations are ideal for N2fixation. However, even
when Fe was added, no stimulation of N2 fixation rates
was observed (Figure 5a, station 5). When both Fe and NO3 were added, N2 fixation was although stimulated
(Figure 5c). Our results showed therefore that N additions did not inhibit N2fixation and indeed could stimulate the
pro-cess. We can hypothesize here that primary production was stimulated by NO3 additions, which could increase dissolved
organic carbon (DOC) excretion, enhance heterotrophic pro-duction, and in turn stimulate heterotrophic N2fixation for
sustaining the N demand of Bacteria (Figure 6b). However additions of glucose did not increase N2fixation rates at this
station (Figure 5c). It is possible that other organic com-pounds released by phytoplankton, such as DOP or other sources of DOC, stimulated heterotrophic N2fixation.
[41] The same indirect control of N2fixation by the
phyto-planktonic activities may have occurred after Fe additions (Figure 6b). On the northern (10°S) transect, the biologically available Fe in the photic layer is mainly upwelled [Gordon et al., 1997], and during El Niño, the Fefluxes from below usually decrease [Barber et al., 1996; Friedrichs and Hofmann, 2001], which is consistent with our Fe concentra-tion measurements (Table 1). In the nutrient sensitivity assays performed on samples collected from the northern transect, N2 fixation was stimulated by Fe additions
(Figures 5a and 5b). We can hypothesize that Fe stimulated nitrogenase synthesis. However, Fe additions also stimulated primary production (data not shown), resulting in a possible excretion of labile dissolved organic matter, like DOC, which was limiting for N2 fixation in the HNLC surface waters
(Figure 5c). The potential stimulation of the bacterial produc-tivity supported by this new DOC [Van Wambeke et al., 2008] could have created low oxygen conditions and in-creased the bacterial N demand, fostering N2fixation. The
hypothesis about the mutualistic link between heterotrophic diazotrophs and photoautotrophs (Figure 6b) was also pro-posed in the South Pacific gyre [Halm et al., 2012].
[42] The generally accepted optimum conditions for N2
fixation (i.e., low N, high availability of P and Fe and warm temperature, Figure 6a) based on our knowledge of cyanobacterial diazotrophs physiology [Sañudo-Wilhelmy et al., 2001; Mills et al., 2004] probably need to be re-evaluated in order to take into account heterotrophic diazotrophs and the possible linkage between phototrophs and heterotophs. The details about the N physiology of these organisms need to be investigated in order to better define their ecological niches and significance for the global N budget.
5. Conclusion
[43] This study reports for thefirst time that N2fixation
oc-curs all across the ETSP at rates comparable to those docu-mented elsewhere in the oligotrophic ocean and with a temporal variability, which can be linked with biogeochemi-cal variations related with the ENSO phenomenon. Surprisingly, El Niño provided preferential conditions for N2 fixation than La Niña, especially in the HNLC waters
and at the border of the gyre. Therefore, the provisional sce-nario about the increase of the frequency of El Niño events [Timmermann et al., 1999] and the expansion of low oxygen-ated waters in the Pacific ocean [Keeling and Garcia, 2002; Stramma et al., 2008] may modify the N cycle in the ETSP to the benefit of N2 fixation [Großkopf and LaRoche,
2012]. However, doing this expensive process in these N-rich waters and at such depths in the OMZ is still an enigma. Finally, nutrient limitation of N2fixation in the surface is
closely related to the nutrient limitation of primary Figure 6. Schematic representations of N2fixation in different environments. (a) Conceptual N2fixation
mainly performed by Cyanobacteria in oligotrophic areas of the oceans and directly controlled by DIP and DFe availabilities (solid arrows) and sustaining possibly the phytoplanktonic primary production by excre-tion of dissolved nitrogen (dotted arrow). (b) N2fixation in the N-rich waters of the ETSP, performed
mainly by heterotrophic N2-fixers, which could be directly controlled by DFe and DOC availabilities (solid
arrows) or indirectly controlled through stimulation of phytoplankton by DFe and DIN availabilities (dashed arrows).
production and unlike the common thought, it could be pos-sible that phytoplankton sustains heterotrophic N2fixation.
[44] Acknowledgments. This work was performed in the framework of the “Documenting N2 fixation in N-deficient waters of the Eastern
Tropical South Pacific” supported by NSF Chemical Oceanographic (OCE 0850801) and the French Government (CNRS-INSU and IRD) supported the LEFE project“Humboldt-fix.” The authors thank the captains and crews from the R/V Atlantis and R/V Melville for outstanding shipboard opera-tions. A PhD scholarship for Julien Dekaezemacker came from the French Ministry of Research and Education.
References
Aminot, A., and R. Kerouel (2007), Dosage automatique des nutriments dans les eaux marines: méthodes enflux continu, Méthodes d’analyse en milieu marin, Ifremer, Plouzané.
Anderson, L., and J. Sarmiento (1994), Redfield ratios of remineralization determined by nutrient data analysis, Global Biogeochem. Cycles, 8, 65–80.
Arntz, W. E., E. Valdivia, and J. Zeballos (1988), Impact of El Niño 1982–83 on the commercially exploited invertebrates (mariscos) of the Peruvian shore, Meeresforsch, 32, 3–22.
Barber, R. T., M. P. Sanderson, S. T. Lindley, F. Chai, J. Newton, C. C. Trees, D. G. Foley, and F. P. Chavez (1996), Primary productivity and its regulation in the equatorial Pacific during and following the 1991–92 El Niño, Deep Sea Res. Part II, 43, 933–969.
Behrenfeld, M. J., et al. (2001), Biospheric primary production during an ENSO transition, Science, 291, 2594–2597.
Berman-Frank, I., J. T. Cullen, Y. Shaked, R. M. Sherrell, and P. G. Falkowski (2001), Iron availability, cellular iron quotas, and nitrogen fixation in Trichodesmium, Limnol. Oceanogr., 46(6), 1249–1260. Blain, S., S. Bonnet, and C. Guieu (2008), Dissolved iron distribution in the
tropical and subtropical South Eastern Pacific, Biogeosciences, 5, 269–280. Bonnet, S., and C. Guieu (2006), Atmospheric forcing on the annual in the Mediterranean Sea. A one year survey, J. Geophys. Res., 111, C09010, doi:10.1029/2005JC003213.
Bonnet, S., et al. (2008), Nutrient limitation of primary productivity in the southeast Pacific (BIOSOPE cruise), Biogeosciences, 5, 215–225. Bonnet, S., I. C. Biegala, P. Dutrieux, L. O. Slemons, and D. G. Capone
(2009), Nitrogen fixation in the western equatorial Pacific: Rates, diazotrophic cyanobacterial size class distribution and biogeochemical significance, Global Biogeochem. Cycles, 23, GB3012, doi:10.1029/ 2008GB003439.
Bonnet, S., O. Grosso, and T. Moutin (2011), Planktonic dinitrogenfixation along a longitudinal gradient across the Mediterranean Sea during the stratified period (BOUM cruise), Biogeosciences, 8, 2257–2267, doi:10.5194/bg-8-2257-2011.
Brandes, J. A., and A. H. Devol (2002), A global marine-fixed nitrogen iso-topic budget: Implications for Holocene nitrogen cycling, Global Biogeochem. Cycles, 16, 1120, doi:10.1029/2001GB001856.
Breitbarth, E., A. Oschlies, and J. LaRoche (2007), Physiological constraints on the global distribution of Trichodesmium: Effect of temperature on diazotrophy, Biogeosciences, 4, 53–61.
Bruland, K. W., R. P. Franks, G. Knauer, and J. H. Martin (1979), Sampling and analytical methods for the determination of copper, cadmium, zinc, and nickel in seawater, Anal. Chim. Acta, 105, 233–245.
Burgess, B. K., and D. J. Lowe (1996), Mechanism of molybdenum nitroge-nase, Chem. Rev., 96, 2983–3011.
Capone, D. G., J. P. Zehr, H. Paerl, B. Bergman, and E. J. Carpenter (1997), Trichodesmium: A globally significant marine cyanobacterium, Science, 276, 1221–1229.
Capone, D. G., J. A. Burns, J. P. Montoya, A. Subramaniam, C. Mahaffey, T. Gunderson, A. F. Michaels, and E. J. Carpenter (2005), Nitrogen fixa-tion by Trichodesmium spp.: An important source of new nitrogen to the tropical and subtropical North Atlantic Ocean, Global Biogeochem. Cycles, 19, GB2024, doi:10.1029/2004GB002331.
Castro-González, M., G. Braker, L. Farías, and O. Ulloa (2005), Communities of nirS-type denitrifiers in the water column of the oxygen minimum zone in the eastern South Pacific, Environ. Microbiol., 7, 1298–1306.
Claustre, H., and S. Maritorena (2003), The many shades of ocean blue, Science, 302, 1514–1515.
Codispoti, L. A. (2007), An oceanicfixed nitrogen sink exceeding 400 Tg N a 1 vs. the concept of homeostasis in the fixed-nitrogen inventory, Biogeosciences, 4, 233–253.
Codispoti, L. A., J. A. Brandes, J. P. Christensen, A. H. Devol, S. W. A. Naqvi, H. W. Paerl, and T. Yoshinari (2001), The oceanicfixed nitrogen and nitrous oxide budgets: moving targets as we enter the anthropocene?, Sci. Mar., 65, 85–105.
Dekaezemacker, J., and S. Bonnet (2011), Sensitivity of N2fixation to
com-bined nitrogen forms (NO3 and NH4 +
) in two strains of the marine diazotroph Crocosphaera watsonii (Cyanobacteria), Mar. Ecol. Prog. Ser., 438, 33–46.
Deutsch, C., J. L. Sarmiento, D. M. Sigman, N. Gruber, and J. P. Dunne (2007), Spatial coupling of nitrogen inputs and losses in the ocean, Nature, 445, 163–167, doi:10.1038/nature05392.
Dugdale, R. C., and J. J. Goering (1967), Uptake of new and regenerated forms of nitrogen in primary productivity, Limnol. Oceanogr., 12, 196–206. Falkowski, P. G. (1983), Enzymology of nitrogen assimilation, In Nitrogen
in the marine environment, edited by Carpenter E. J., and Capone D. G., p. 839–868, Academic Press, New York, NY.
Falkowski, P. G. (1997), Evolution of the nitrogen cycle and its influence on the biological sequestration of CO2 in the ocean, Nature, 387,
272–275.
Falkowski, P. G., R. T. Barber, and V. Smetacek (1998), Biogeochemical con-trols and feedbacks on ocean primary production, Science, 281, 200–206. Fay, P. (1992), Oxygen relations of nitrogen fixation in cyanobacteria,
Microbiol. Rev., 56, 340–373.
Fernandez, C., L. Farias, and O. Ulloa (2011), Nitrogen fixation in denitrified marine waters, PLoS One, 6, e20539, doi:10.1371/journal. pone.0020539.
Friedrichs, M. A. M., and E. E. Hofmann (2001), Physical control of biolog-ical processes in the central equatorial Pacific Ocean, Deep Sea Res. Part I, 48, 1023–1069.
Goebel, N. L., C. A. Edwards, M. J. Church, and J. P. Zehr (2007), Modeled contributions of three diazotrophs to nitrogenfixation at Station ALOHA, ISME J., 1, 606–619.
Goering, J. J. (1968), Denitrification in oxygen minimum layer of Eastern Tropical Pacific Ocean, Deep Sea Res., 15, 157–164.
Gordon, M. R., K. H. Coale, and K. Johnson (1997), Iron distributions in the equatorial Pacific: Implications for new production, Limnol. Oceanogr., 42, 419–431.
Großkopf, T., and J. LaRoche (2012), Direct and indirect costs of dinitrogen fixation in Crocosphaera watsonii WH8501 and possible implications for the nitrogen cycle, Front. Microbiol., 3, 236.
Großkopf, T., W. Mohr, T. Baustian, H. Schunck, D. Gill, M. M. M. Kuypers, G. Lavik, R. A. Schmitz, D. W. R. Wallace, and J. LaRoche (2012), Doubling of marine N2 fixation rates based on direct measurements,
Nature, 488, 361–364.
Halm, H., P. Lam, T. G. Ferdelman, G. Lavik, T. Dittmar, J. LaRoche, S. D’Hondt, and M. M. M. Kuypers (2012), Heterotrophic organisms dominate nitrogen fixation in the South Pacific Gyre, ISME J., 6, 1238–1249.
Hamersley, M. R., et al. (2007), Anaerobic ammonium oxidation in the Peruvian oxygen minimum zone, Limnol. Oceanogr., 52, 923–934. Hamersley, M. R., K. A. Turk, A. Leinweber, N. Gruber, J. P. Zehr,
T. Gunderson, and D. G. Capone (2011), Nitrogenfixation within the water column associated with two hypoxic basins in the Southern California Bight, Aquat. Microb. Ecol., 63, 193–205.
Holl, C. M., and J. P. Montoya (2005), Interactions between nitrate uptake and N2 fixation in Trichodesmium, J. Phycol., 41, 1178–1183,
doi:10.1111/j.1529-8817.2005.00146.x.
Hydes D., et al. (2010), Determination of dissolved nutrients (N, P, Si) in seawater with high precision and inter-comparability using gas segmented continuousflow analysers. In The GO-SHIP Repeat Hydrography Manual: A Collection of Expert Reports and guidelines. IOCCP Report No 14, ICPO Publication Series No. 134, version 1 (UNESCO/IOC).
Jickells, T. D., et al. (2005), Global iron connections between desert dust, ocean biogeochemistry, and climate, Science, 308, 67–71.
Karl, D. M., and R. M. Letelier (2008), Nitrogenfixation-enhanced carbon sequestration in low nitrate, low chlorophyll seascapes, Mar. Ecol. Prog. Ser., 364, 257–268.
Karl, D. M., R. Letelier, D. V. Hebel, D. F. Bird, and C. D. Winn (1992), Trichodesmium blooms and new nitrogen in the North Pacific Gyre, in Marine pelagic cyanobacteria: Trichodesmium and other diazotrophs, edited by Carpenter E. J., Capone D. G., Rueter J. G., p. 219–237, Kluwer Academic, Dordrecht.
Karl, D. M., A. Michaels, B. Bergman, D. G. Capone, E. Carpenter, R. Letelier, F. Lipschultz, H. Paerl, D. Sigman, and L. Stal (2002), Dinitrogenfixation in the world’s oceans, Biogeochemical, 57, 47–98. Keeling, R. F., and H. Garcia (2002), The change in oceanic O2inventory
associated with recent global warming, Proc. Nat. Acad. Sci. U.S.A., 99, 7848–7853.
Kirkwood, D. S. (1992), Stability of solutions of nutrient salts during stor-age, Mar. Chem., 38, 151–164.
Knapp, A. N., J. Dekaezemacker, S. Bonnet, J. A. Sohm, and D. G. Capone (2012), Sensitivity of Trichodesmium and Crocosphaera growth and N2
fixation rates to varying NO3
-and PO4
3-concentrations in batch cultures, Aquat. Microb. Ecol., 66, 223–236.
Kustka, A., S. Sanudo-Wilhelmy, E. J. Carpenter, D. G. Capone, and J. A. Raven (2003a), A revised estimate of the Fe use efficiency of nitrogen fixation, with special reference to the marine N2fixing cyanobacterium,
Trichodesmium spp. (Cyanophyta), J. Phycol., 39, 12–25.
Kustka, A. B., S. A. Sanudo-Wilhelmy, E. J. Carpenter, D. Capone, J. Burns, and W. G. Sunda (2003b), Iron requirements for dinitrogen- and ammo-nium-supported growth in cultures of Trichodesmium (IMS 101): Comparison with nitrogenfixation rates and iron: Carbon ratios of field populations, Limnol. Oceanogr., 48(5), 1869–1884.
Kuypers, M. M. M., A. O. Sliekers, G. Lavik, M. Schmid, B. B. Jørgensen, J. G. Kuenen, J. S. Sinninghe Damsté, M. Strous, and M. S. M. Jetten (2003), Anaerobic ammonium oxidation by Anammox bacteria in the Black Sea, Nature, 422, 608–611.
Lam, P., et al. (2009), Revising the nitrogen cycle in the Peruvian oxygen minimum zone, Proc. Nat. Acad. Sci. U.S.A., 106, 4752–57.
Lipschultz, F., S. C. Wofsy, B. B. Ward, L. A. Codispoti, G. Friedrich, and J. W. Elkins (1990), Bacterial transformations of inorganic nitrogen in the oxygen-deficient waters of the eastern tropical South Pacific Ocean, Deep Sea Res. Part A, 37, 1513–1541.
Luo, Y.-W., et al. (2012), Database of diazotrophs in global ocean: abun-dances, biomass and nitrogen fixation rates, Earth Syst. Sci. Data Discuss., 5, 47–106, doi:10.5194/essdd-5-47-2012.
Martin, J. H. K. H., et al. (1994), Testing the iron hypothesis in ecosystems of the equatorial Pacific Ocean, Nature, 371, 123–129, doi:10.1038/371123a0. Mills, M. M., C. Ridame, M. Davey, J. La Roche, and R. J. Geider (2004), Iron and phosphorus co-limit nitrogenfixation in the eastern tropical North Atlantic, Nature, 429, 292–294, doi:10.1038/nature02550. Moffett, J. W., T. J. Goepfert, and S. W. A. Naqvi (2007), Reduced iron
as-sociated with secondary nitrite maxima in the Arabian Sea, Deep Sea Res. Part I, 54, 1341–49.
Mohr, W., T. Großkopf, D. W. R. Wallace, and J. LaRoche (2010), Methodological underestimation of oceanic nitrogenfixation rates, PLoS One, 5(9), e12583, doi:10.1371/journal.pone.0012583.
Montoya, J. P., M. Voss, P. Kaehler, and D. G. Capone (1996), A simple, high precision tracer assay for dinitrogen fixation, Appl. Environ. Microbiol., 62, 986–993.
Montoya, J. P., C. Holl, J. P. Zehr, A. Hansen, T. Villareal, and D. G. Capone (2004), High rates of N2fixation by unicellular diazotrophs in the
oligotro-phic Pacific Ocean, Nature, 430, 1027–1032, doi:10.1038/nature02824. Moutin, T., D. M. Karl, S. Duhamel, P. Rimmelin, P. Raimbault,
B. A. S. Van Mooy, and H. Claustre (2008), Phosphate availability and the ultimate control of new nitrogen input by nitrogenfixation in the trop-ical Pacific Ocean, Biogeosciences, 5, 95–109, doi:10.5194/bg-5-95-2008. Mulholland, M. R., and D. G. Capone (2001), The stoichiometry of N and C utilization in cultured populations of Trichodesmium IMS101, Limnol. Oceanogr., 46, 436–443.
Paerl, H. W., L. E. Prufert-Bebout, and C. Gao (1994), Iron-stimulated N2
fixation and growth in natural and cultures populations of the planktonic marine cyanobacteria Trichodesmium spp, Appl. Environ. Microbiol., 60(3), 1044–1047.
Parekh, P., M. Follows, and E. A. Boyle (2005) Decoupling of iron and phosphate in the global ocean, Global Biogeochem. Cycles, 19, GB2020, doi:10.1029/2004GB002280.
Paulmier, A., and D. Ruiz-Pino (2008), Oxygen Minimum Zones (OMZs) in the modern ocean, Prog. Oceanogr., 80(3–4), 113–128.
Price, N. M., L. F. Andersen, and F. M. M. Morel (1991), Iron and nitrogen nutrition of equatorial Pacific plankton, Deep Sea Res., 38, 1361–1378. Price, N. M., B. A. Ahner, and F. M. M. Morel (1994), The equatorial Pacific
ocean: Grazer-controlled phytoplankton populations in an iron-limited ecosystem, Limnol. Oceanogr., 39, 520–534.
Raimbault, P., and N. Garcia (2008), Evidence for efficient regenerated production and dinitrogen fixation in nitrogen-deficient waters of the South Pacific Ocean: Impact on new and export production estimates, Biogeosciences, 5, 323–338.
Redfield, A. C., B. H. Ketchum, and F. A. Richards (1963), The influence of organisms on the composition of seawater, in the composition of seawater. comparative and descriptive oceanography. The Sea: Ideas and Observations on Progress in the Study of the Seas, edited by Hill, M. N., vol. 2, pp. 26–77, Wiley-Interscience, New York, USA.
Rees, A. P., J. A. Gilbert, and B. A. Kelly-Gerreyn (2009), Nitrogenfixation in the western English Channel (NE Atlantic Ocean), Mar. Ecol. Prog. Ser., 374, 7–12.
Saito, M. A., et al. (2011), Iron conservation by reduction of metallo enzyme inventories in the marine diazotroph Crocosphaera watsonii, Proc. Nat. Acad. Sci. U.S.A., 108, 2184–2189.
Sañudo-Wilhelmy, S. A., A. B. Kustka, C. J. Gobler, D. A. Hutchins, M. Yang, K. Lwiza, J. Burns, D. G. Capone, J. A. Raven, and E. J. Carpenter (2001), Phosphorus limitation of nitrogenfixation by Trichodesmium in the central Atlantic Ocean, Nature, 411, 66–69, doi:10.1038/35075041.
Short, S. M., and J. P. Zehr (2007), Nitrogenase gene expression in the Chesapeake Bay Estuary, Environ. Microbiol., 9, 1591–1596.
Stramma, L., G. C. Johnson, J. Sprintall, and V. Mohrholz (2008), Expanding oxygen minimum zones in the tropical oceans, Science, 320, 655–658. Timmermann, A., J. Oberhuber, A. Bacher, M. Esch, M. Latif, and
E. Roeckner (1999), Increased El Niño frequency in a climate model forced by future greenhouse warming, Nature, 357, 230.
Ulloa, O., and S. Pantoja (2009), The oxygen minimum zone of the eastern South Pacific, Deep Sea Res. Part II, 56, 987–991.
Van Wambeke, F., S. Bonnet, T. Moutin, P. Raimbault, G. Alarçon, and C. Guieu (2008), Factors limiting heterotrophic bacterial production in the southern Pacific Ocean, Biogeosciences, 5, 833–845.
Voss, M., P. Croot, K. Lochte, M. Mills, and I. Peeken (2004), Patterns of nitrogenfixation along 10°N in the tropical Atlantic, Geophys. Res. Lett., 31, L23S09, doi:10.1029/2004GL020127.
Webb, E. A., I. M. Ehrenreich, S. L. Brown, F. W. Valois, and J. B. Waterbury (2009), Phenotypic and genotypic characterization of mul-tiple strains of the diazotrophic cyanobacterium, Crocosphaera watsonii, isolated from the open ocean, Environ. Microbiol., 11, 338–348, doi:10.1111/j.1462-2920.2008.01771.x.
Wells, M. L. (2003), The level of iron enrichment required to initiate diatom blooms in HNLC waters, Mar. Chem., 82, 101–114.
Westberry, T. K., and D. A. Siegel (2006), Spatial and temporal distribution of Trichodesmium blooms in the world’s oceans, Global Biogeochem. Cycles, 20, GB4016, doi:10.1029/2005GB002673.
Wilson, S. T., D. Böttjer, M. J. Church, and D. M. Karl (2012), Comparative assessment of nitrogenfixation methodologies conducted in the oligo-trophic North Pacific ocean, Appl. Environ. Microbiol., doi:10.1128/ AEM.01146-12.
Wolter, K., and M. S. Timlin (1993), Monitoring ENSO in COADS with a seasonally adjusted principal component index. Proc. of the 17th Climate Diagnostics Workshop, Norman, OK, NOAA/NMC/CAC, NSSL, Oklahoma Clim. Survey, CIMMS and the School of Meteor., Univ. of Oklahoma, 52–57.
Wolter, K., and M. S. Timlin (1998), Measuring the strength of ENSO events - how does 1997/98 rank?, Weather, 53, 315–324.
Zehr, J. P., J. B. Waterbury, P. J. Turner, J. P. Montoya, E. Omoregie, G. F. Steward, A. Hansen, and D. M. Karl (2001), Unicellular cyanobacteriafix N2in the subtropical North Pacific Ocean, Nature, 412,