HAL Id: hal-02136615
https://hal.archives-ouvertes.fr/hal-02136615
Submitted on 16 Apr 2020
HAL is a multi-disciplinary open access
archive for the deposit and dissemination of sci-entific research documents, whether they are pub-lished or not. The documents may come from teaching and research institutions in France or abroad, or from public or private research centers.
L’archive ouverte pluridisciplinaire HAL, est destinée au dépôt et à la diffusion de documents scientifiques de niveau recherche, publiés ou non, émanant des établissements d’enseignement et de recherche français ou étrangers, des laboratoires publics ou privés.
Interannual hydrological variations and ecological
phytoplankton patterns in Amazonian floodplain lakes
Cleber Nunes Kraus, Marie-Paule Bonnet, Cristina Arantes Miranda, Ina de
Souza Nogueira, Jérémie Garnier, Ludgero Cardoso Galli Vieira
To cite this version:
Cleber Nunes Kraus, Marie-Paule Bonnet, Cristina Arantes Miranda, Ina de Souza Nogueira, Jérémie Garnier, et al.. Interannual hydrological variations and ecological phytoplankton patterns in Amazo-nian floodplain lakes. Hydrobiologia, Springer, 2019, 830 (1), pp.135-149. �10.1007/s10750-018-3859-6�. �hal-02136615�
INTERANNUAL HYDROLOGICAL VARIATION AND ECOLOGICAL PHYTOPLANKTON
PATTERNS IN AMAZONIAN FLOODPLAIN LAKES
Cleber Nunes Kraus a,c*, Marie-Paule Bonnetb,c, Cristina Arantes Mirandac, Ina de Souza Nogueirad, Jérémie Garnierc and Ludgero Cardoso Galli Vieira a
aEnvironmental Science Post Graduate Program- Universidade de Brasília (UnB), Área Universitária 1, Vila Nossa Senhora de Fátima, CEP: 73345-010, Brasília – DF, Brasil; bUMR 228 Espace-DEV, Institut de Recherche pour le Développement (IRD), França;
cJoint International Laboratory LMI OCE “Observatory of Environmental Change’, UnB/IRD, Brasilia, DF, Brazil
dEnvironmental Science and Vegetal Biodiversity Post Graduate Programs- Universidade
Federal de Goiás (UFG), Goiânia – GO, Brasil.
*Corresponding author e-mail:
[email protected]
This paper has not been submitted elsewhere in identical or similar form, nor will it be
during the first three months after its submission to Hydrobiologia.
Abstract
Amazonian aquatic environments are complex, and their interaction promotes heterogeneous environments that turn difficult the development of patterns to describe them. We evaluated if interannual variation in the physical-chemical structure and the phytoplankton community promote environmental and biological contrasted conditions between similar hydrological periods. Amazonian floodplain lakes have different environmental and biological responses in similar water periods due to the interannual variation. Phytoplankton community structure has differences between periods, but these differences do not necessary promote dissimilarities. Most of the phytoplankton species belong to the same functional groups. The composition of species and functional groups between sample units inside lakes is variable and may have or not significant differences in dissimilarity, but both periods are equally heterogeneous. Beta diversity has shown that the replacement of species and functional groups causes a great level of variation between sites, which maintain a high heterogeneity between periods. These variations have different responses for different scales turning a difficult task the interpretation of patterns for these environments. Hence, scale and interannual variability are factors that need to be carefully considered when setting standards to describe the ecological dynamics of floodplain lakes in the Amazonian system.
Keywords: Amazonian wetlands; biodiversity; plankton; freshwater; ecology; beta
Introduction
Wetlands are essential continental components with fundamental hydrological and ecological functions such as water storage, water-quality improvement, and biodiversity conservation (Mitsch & Gosselink, 2007). They cover about 14% of the Amazon lowland basin, reaching to 800.000 km2 during flooding season (Hess et al., 2015). The large floodplain lakes associated to the ‘‘white-water’’ main tributaries known as várzeas (Sioli, 1984) present distinct characteristics mainly resulting from contrasted morphology and degree of connectivity with the main Solimões/Amazon corridor (Prance, 1980; Sioli, 1984; Sippel et al., 1992). Along the main Solimões/Amazon corridor, floodplains have a predictable and monomodal flood pulse with four distinct periods (flooding, high water, flushing, and low water) commonly considered throughout the seasonal cycle (Prance, 1980; Bonnet et al., 2008; Rudorff et al., 2014a; Bonnet et al., 2017). The hydrological phases are closely linked to the ecological processes of the floodplain systems, and spatial and temporal changes in biodiversity are related to variations between the phases of the flood pulse (Tockner et al., 2000). The flooding process promotes water’s and nutrients’ renewal leading to a peak in primary productivity. The moving terrestrial/aquatic transition creates a great variety of environmental conditions conducive to biodiversity, whereas during high water period primary productivity is weaker because of dilution, shorter residence time, and increased depth (Ciarrocchi et al., 1976; Scho ̈ngart & Junk, 2007; Thomaz et al., 2007; Junk et al., 2012). During the flushing period, decreasing depth and degradation of the autogenic organic material pro- motes a second peak in primary productivity (Ciarrocchi et al., 1976; Alcântara et al., 2011). During low water, floodplains present a smaller water volume profoundly stirred and turbid and remain or not connected to the main channel (Tockner et al., 2000). Despite the predictability of the flood pulse, small increments in mainstream peak discharge may cause disproportionately large changes of the through- flow within the floodplains (Rudorff et al., 2014b; Bonnet et al., 2017). Floodplain lake biodiversity conservation is a crucial challenge as they are considered as among the most diversified environments in the world (Junk et al., 2010) but increasingly threatened by land-use changes and dam proliferation in the basin (Forsberg et al., 2017).
On a general point of view, ecological systems exhibit heterogeneity on a wide range of scales, which is often a problem for ecologists (Levin, 1992; Merico et al., 2014). Larger scales tend to have greater environmental heterogeneity and may reveal different patterns from those that would be observed on a smaller scale (Lawton, 1999; Simberloff, 2004). These differences increase the difficulty in unraveling patterns that represent both scales (Huston, 1999; Sten- dera et al., 2012; Zagmajster et al., 2014; Saraiva et al., 2015). Throughout distribution, composition, and diversity of communities, it is possible to evaluate the organization of species in space along an environmental gradient (Howeth & Leibold, 2010; Massol et al., 2011; Chust et al., 2013; Gianuca et al., 2017). Since the work of Whittaker (1960), the beta diversity has aroused considerable interest, mainly for its application in evaluation of processes that generate and maintain biodiversity in ecosystems (Legendre & De Cáceres, 2013). There are several proposals to address and study beta diversity. The most common form is through similarity indices between sites (Whittaker, 1960; Anderson et al., 2006; Baselga, 2010; Carvalho et al., 2013; Baselga & Leprieur, 2015). Moreover, beta diversity can be divided into two components: (1) replacement, or directional change in the composition of the community; or (2) nondirectional change of community, concentrating on the variations in community compositions between the sampling units (Legendre, 2014).
The beta diversity can be used to analyze complex systems, such as the Amazonian floodplain lakes system, verifying if ecological factors (e.g., spatial distribution, environmental
heterogeneity, hydrological connectivity, and morphology) influence the species composition of the community (Carvalho et al., 2013), thus giving some guiding rules for their protection. Phytoplanktonic organisms respond very rapidly to variations (Loverde-Oliveira & Huszar, 2007; Angeler & Drakare, 2013; Goes et al., 2014). Thus, studying the beta diversity of this community should help to understand the ecological processes of the Amazon floodplain lakes system better. In addition, functional approach makes community ecology more general and predictive, allowing the link between ecology of communities and ecosystems (McGill et al., 2006; Westoby & Wright, 2006; Webb et al., 2010), and can be an alternative to overcome difficulty in unraveling patterns between ecological scales (Reynolds et al., 2002).
Interannual variation of flood pulse promotes changes that can affect the aquatic community and unravel these changes is an essential key for better understand the Amazonian floodplain lakes system and further promote right decision to ensure sustain- able use and conservation for these crucial areas. In this work, we assessed the interannual variation in the physical– chemical structure and the phytoplankton community, at two low water periods at local and regional scales. Thus, we evaluated (1) if the variabilities under environmental and biological conditions between two similar periods exist, and if so at what scales, and (2) to what extent these differences have an influence upon the phytoplankton biodiversity structure.
Material and Method
Study area
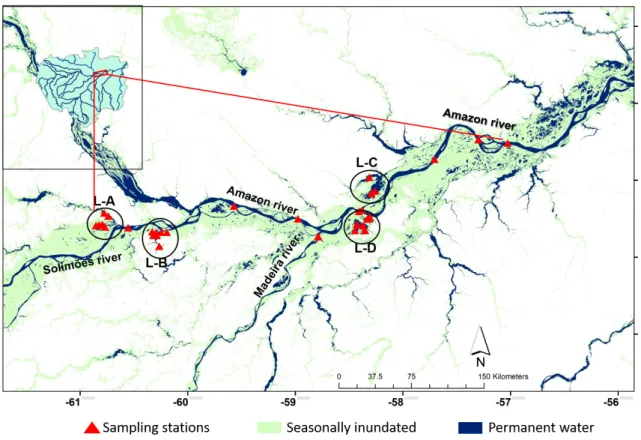
The samples were collected during two low water (or very late flushing) periods: the first one (LW1) in October 2009 and the second one (LW2) in September 2010 (Fig. 1), during which the water level in the river was similar and less than 400 cm at the Óbidos gage. The study area (Fig. 2) was divided into five areas with points collected in the Solimões/Amazon mainstream and points collected in 4 floodplain lakes (L-A, L-B, L-C, and L-D). L-A is located on the left margin of the Solimões River. It is a fertile floodplain, widely used for both subsistence and commercial agriculture, receiving influence from both the Solimões River to the south and Manacapurú River to the north (Sampaio et al., 2012). L-B is located further downstream on the right margin of the Solimões River. It is composed of a lake with flooded forests and other wetlands linked to the river by a perennial channel on the northeast side of the floodplain. It receives influence from the mainstream mainly through overbank flow at high water level and from the Janauacá river located south (Bonnet et al., 2017). L-C is located along the left margin on the Amazon and near the confluence with the Madeira River. As L-D is located slightly down- stream on the right margin of the Amazon River, it has a higher degree of connection with Amazon river. The fifth area is composed of samples collected in the main channel of the Amazon River and comprises sites between these four floodplain lakes (Fig. 2). Due to the hydrometric variation resulting from the flood pulse, 23 samples were collected during LW1 and 25 samples in LW2.
Figure 1: Amazon river’s monthly water levels at Manacapurú and Óbidos gages between 2009
and 2010. LW1 2009 period of collecting data; LW2 2010 period of collecting data. Built from data from the Brazilian National Water Agency (ANA)
Figure 2: Map of study area with locations of the lakes and sites of sampling units in the main
Environmental and biological variables
The environmental variables (temperature of water, electrical conductivity, pH and dissolved oxygen), were measured by a multiparameter probe (model YSI 6820-V2). The analysis of ammonium (NH4) was done according to Grasshoff (1983). The analysis of chlorophyll-a (Chl-a) was done by filtering three aliquots about 500 to 750 ml of water under pressure in the NALGENE filtration system and glass fiber filters (membrane 0.7 lm porosity; Millipore What- man GF/F), the membranes were wrapped in aluminum foil and frozen for subsequent chlorophyll-a analyses. In the laboratory, chlorophyll-a filters were extracted with buffered acetone (90% acetone + 10% saturated magnesium carbonate) (Jespersen & Christoffersen, 1987), the extracts were kept for 24 h in the refrigerator before colorimetry determination (APHA, 1998). The quantitative samples of phytoplankton were collected and were stored in 10 mL amber vials and fixed with acetic Lugol solution. Phytoplankton was counted following the Utermöhl method (Utermöhl, 1958), at 400x magnification. The counting was done randomly until 100 individuals of the most frequent species were obtained (cells, colonies, or filaments were counted as one individual), with an error being less than 20%, with a confidence coefficient of 95% (Lund et al., 1958). The adopted system for classifying phytoplankton was that of Hoek et al. (1995). The algal biovolume was calculated by multiplying the abundance of each species by the mean cell volume (Hillebrand et al., 1999), based on the measurement of at least 30 individuals and was expressed in mm3L-1. This biovolume was used to select the functional groups. The functional groups (FG) of phytoplankton were classified according to Reynolds et al., (2002), with the modifications made by Padisák et al. (2009). For the functional groups specific biomass was estimated from the product of the population and mean unit volume and only those that contributed with at least 5% of the total biovolume per sample unit were considered Kruk et al. (2002).
Data analysis
We conducted the analyses at regional and local scales. The regional scale (Reg), includes all samples from lakes and the Solimões/Amazon River. At the local scale, we separately considered the lakes L-A, L-B, L-C, L-D, and the mainstream (River). Data analysis of similarity and heterogeneity was done considering environmental (ENV), phytoplankton species (SPP) and functional group (FG) approach. In order to evaluate the similarity between periods LW1 and LW2, all data were submitted to a permutational multivariate analysis of variance using distance matrices with the adonis function of the vegan package (Oksanen et al., 2013). The dissimilarity evaluates the variance of all sample units together in each period and evaluates also whether the differences between the periods are significant. As the inputs are linear predictors, and a response matrix of an arbitrary number of columns, this analysis describes how variation is attributed to different experimental treatments. For further details, see Mcardle and Anderson (2013). To assess heterogeneity for environmental and biological data, we used a distance-based dispersion test for multivariate data with the betadisper function of the vegan package (Oksanen et al., 2013). The test is based on the individual variance of each of sample units measuring the dispersion with the mean distance of the sample units to a central point (Anderson, 2001, 2006). So that the larger the mean distance to centroid the greater heterogeneity of the group. In our case, LW1 and LW2 are the groups. To test the significance of variances between groups, we proceeded to analyze of variance (ANOVA). For further details, see Anderson (2006).
To assess the heterogeneity of biological data during each period, we evaluated the total beta diversity (βT) and its components (replacement and nestedness) as described by Legendre & De Cáceres (2013). The analyses were performed using the package adespatial (Dray et al., 2016). We used the Baselga Family of Indices with the Sorensen’s dissimilarity index (Baselga, 2010) that provides the multiple-site dissimilarities across all sites and the estimated distribution of
those values. Phytoplankton abundance data were pretransformed with Hellinger transformation (Legendre & De Cáceres, 2013). The maximum value of beta diversity (βT = 1) occurs when all sites contain a different set of species with no species in common. Once the βT has a fixed range of values for any community, which does not depend on the total abundance in the community composition, it is possible to compare datasets which have the same or different numbers of sampling units, as long as the calculations have been done using the same index (Legendre & De Ca Cáceres, 2013). Using beta-diversity matrices, two distance-based Redundancy Analyses (dbRDAs) were run for each period considering SPP and FG approaches. This technique allows analyzing if there is an ecologically relevant relationship between biological and environmental data in each period. Steps in the procedure include (i) calculating a matrix of distances among replicates using the beta-diversity distance matrix; (ii) determining the principal coordinates which preserve these distances (species data); (iii) creating a matrix of dummy variables (model); (iv) analyzing the relation- ship between species data and the model using RDA; and (v) implementing a test by permutation for particular statistics corresponding to the particular terms in the model (Legendre & Anderson, 1999; Mcardle & Anderson, 2013). The results are shown by graphs, two for each period considering the SPP and FG approaches. This method is provided by function dbrda in the vegan package. All analyses were performed using the R program (Team, 2018).
Results
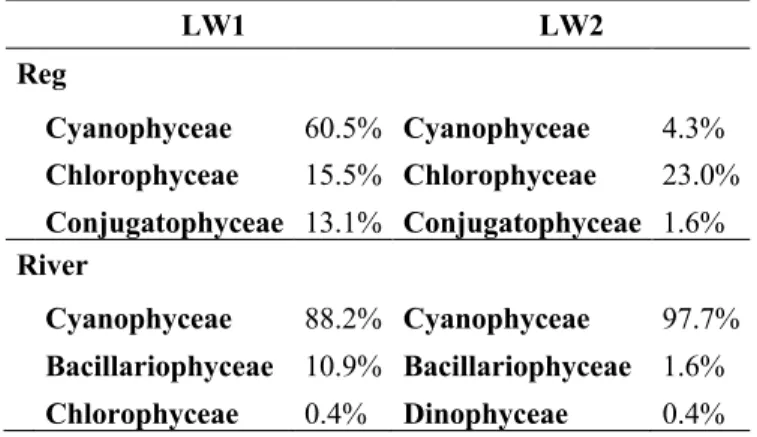
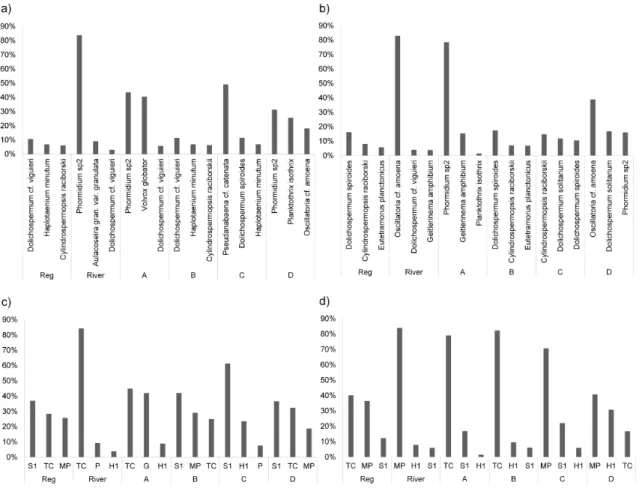
The total of 219 phytoplankton species was identified with 192 species in LW1 and 153 species in the LW2 period (Supplementary Material 1 and 2). Cyanobacteria were the most representative in both scales and periods. The regional scale had the same classes between periods, but at local scales, the phytoplankton group’s representativeness differs between periods (Table 1). In both periods and all sites, one or more species of cyanobacteria of the genus
Dolichospermum, Phormidium, Oscillatoria, and Cylindorspermopsis always appear among the
species with greater representativity (Fig. 3a and b). We identified 14 functional groups (FGs) in LW1 and 19 functional groups in LW2 periods (supplementary material 3). During LW1, we identified only 4 FGs in L-B, thus contrasting with the other lakes where we recognized 11 or 12 groups during the same period. During LW2, all sites had at least 11 FGs. However, whatever the periods or the scales considered, 4 FGs (TC, MP, S1, and H1), accounted for at least 80% of total biomass (Fig. 3c and d).
Table 1 Table of most representative phytoplankton groups.
LW1 LW2 Reg Cyanophyceae 60.5% Cyanophyceae 4.3% Chlorophyceae 15.5% Chlorophyceae 23.0% Conjugatophyceae 13.1% Conjugatophyceae 1.6% River Cyanophyceae 88.2% Cyanophyceae 97.7% Bacillariophyceae 10.9% Bacillariophyceae 1.6% Chlorophyceae 0.4% Dinophyceae 0.4%
A Cyanophyceae 52.4% Cyanophyceae 97.1% Chlorophyceae 43.1% Bacillariophyceae 1.1% Bacillariophyceae 2.7% Dinophyceae 1.0% B Cyanophyceae 59.8% Cyanophyceae 46.1% Chlorophyceae 15.5% Chlorophyceae 25.0% Conjugatophyceae 13.4% Conjugatophyceae 10.0% C Cyanophyceae 74.3% Cyanophyceae 70.7% Chlorophyceae 15.0% Chlorophyceae 14.3% Conjugatophyceae 7.0% Conjugatophyceae 6.0% D Cyanophyceae 91.1% Cyanophyceae 94.5% Bacillariophyceae 5.3% Bacillariophyceae 4.6% Euglenophyceae 1.9% Chlorophyceae 0.3%
LW1= 2009 low water period; LW2= 2010 low water period; Reg= Regional scale; River= Amazon River; A, B, C and D= Lakes.
The codon TC is composed of cyanobacteria and is characteristic of eutrophic standing waters, or slow- flowing rivers (Padisák et al., 2009), and the most representative species recorded were
Phormidium spp. The codon MP is composed of species of bacillariophytes and cyanobacteria,
and frequently stirred up, inorganically turbid shallow lakes (Padisák et al., 2009); during the present study, Oscillatoria cf. amoena and Pseudanabaena cf. catenata were recorded in this codon. The codon S1 is characteristic of turbid mixed environments and filamentous cyanoprokaryotes (Reynolds et al., 2002); this codon was represented by Planktothrix isothrix (Skuja) Komárek & Komárk.-Legn.and Planktothrix cf. agardhii. The codon H1 comprises the genus of cyanobacteria Anabaena, updated to Dolichospermum (Wacklin et al., 2009),
Anabaenopsis and Aphanizomenon, and is characteristic of eutrophic, both stratified and
shallow lakes with low nitrogen content (Padisák et al., 2009). Besides these codons, we recognized two other functional groups, but less representative than the above cited in each lake, the codons P and G. The codon P was present in L-C and in the river during the LW1 period. This codon is characteristic of high trophic shallow lakes where the mean depth is 2–3 m with continuous or semicontinuous mixed layer (Padisák et al., 2009) and was represented by
Aulacoseira granulate (Ehrenb.) Simonsen. The codon G was only present in L-A during the LW1
period. This codon is usually associated with nutrient-rich habitats in stagnant water columns, small eutrophic lakes, and is composed of Chlorophyceae (Padisák et al., 2009) being represented in the studied system by Volvox globator Linnaeus.
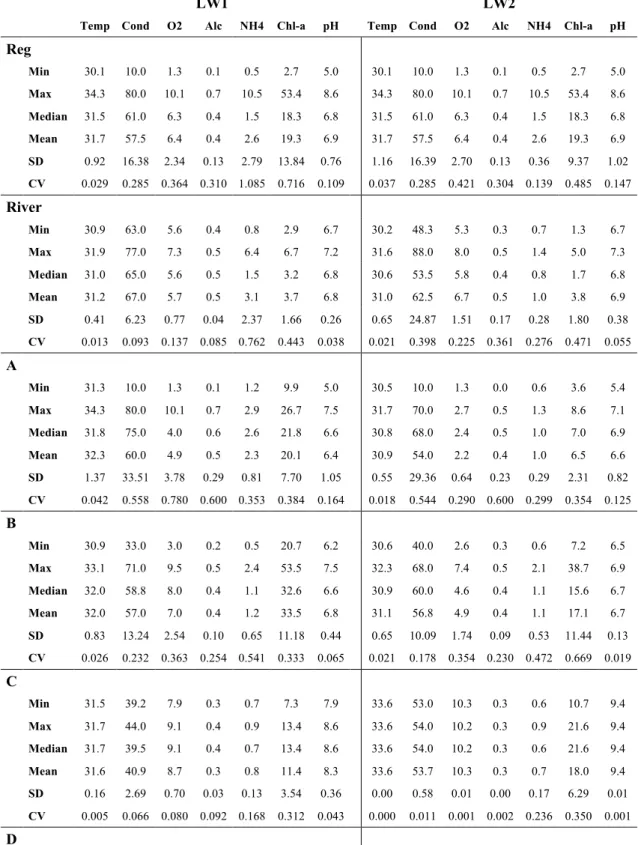
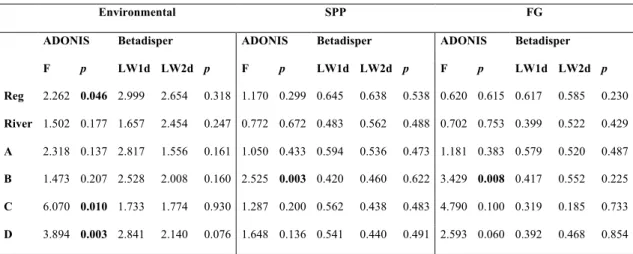
Temperature and pH mean values were the most stable parameters throughout periods and scales (Table 2). The other environmental parameters exhibited different variations between periods, as indicated by the coefficient of variation (CV) (Table 2). The environmental (ENV) differences between LW1 and LW2 analyzed on a regional scale, showed a significant dissimilarity (Adonis test, P < 0.05) but no significant differences in heterogeneity (Betadisper test, P > 0.05) between periods (Table 3). Moreover, the biological response (SPP and FG) had no significant differences at this scale. The environmental differences characterize the periods as distinct on a regional scale, although they are not so distinct regarding their biological condition (Table 3).
Table 2 Summary of environmental data. LW1=2009 low water period; LW2=2010 low water period; Reg= Regional scale; River= Amazon River; A, B, C and D= lakes; Min=Mínimum; Max=Maximum; SD= Standart Deviation, CV= Coeficient of Variation; Temp= temperature (°C); Cond=Condutivity (µS/cm); O2= Dissolved oxygem (mg/L); Alc= Alcalinity (µmol/L); NH4=Ammonium (µmol/L); Chl-a= Chlorophyll-a (mg/m3).
LW1 LW2
Temp Cond O2 Alc NH4 Chl-a pH Temp Cond O2 Alc NH4 Chl-a pH
Reg Min 30.1 10.0 1.3 0.1 0.5 2.7 5.0 30.1 10.0 1.3 0.1 0.5 2.7 5.0 Max 34.3 80.0 10.1 0.7 10.5 53.4 8.6 34.3 80.0 10.1 0.7 10.5 53.4 8.6 Median 31.5 61.0 6.3 0.4 1.5 18.3 6.8 31.5 61.0 6.3 0.4 1.5 18.3 6.8 Mean 31.7 57.5 6.4 0.4 2.6 19.3 6.9 31.7 57.5 6.4 0.4 2.6 19.3 6.9 SD 0.92 16.38 2.34 0.13 2.79 13.84 0.76 1.16 16.39 2.70 0.13 0.36 9.37 1.02 CV 0.029 0.285 0.364 0.310 1.085 0.716 0.109 0.037 0.285 0.421 0.304 0.139 0.485 0.147 River Min 30.9 63.0 5.6 0.4 0.8 2.9 6.7 30.2 48.3 5.3 0.3 0.7 1.3 6.7 Max 31.9 77.0 7.3 0.5 6.4 6.7 7.2 31.6 88.0 8.0 0.5 1.4 5.0 7.3 Median 31.0 65.0 5.6 0.5 1.5 3.2 6.8 30.6 53.5 5.8 0.4 0.8 1.7 6.8 Mean 31.2 67.0 5.7 0.5 3.1 3.7 6.8 31.0 62.5 6.7 0.5 1.0 3.8 6.9 SD 0.41 6.23 0.77 0.04 2.37 1.66 0.26 0.65 24.87 1.51 0.17 0.28 1.80 0.38 CV 0.013 0.093 0.137 0.085 0.762 0.443 0.038 0.021 0.398 0.225 0.361 0.276 0.471 0.055 A Min 31.3 10.0 1.3 0.1 1.2 9.9 5.0 30.5 10.0 1.3 0.0 0.6 3.6 5.4 Max 34.3 80.0 10.1 0.7 2.9 26.7 7.5 31.7 70.0 2.7 0.5 1.3 8.6 7.1 Median 31.8 75.0 4.0 0.6 2.6 21.8 6.6 30.8 68.0 2.4 0.5 1.0 7.0 6.9 Mean 32.3 60.0 4.9 0.5 2.3 20.1 6.4 30.9 54.0 2.2 0.4 1.0 6.5 6.6 SD 1.37 33.51 3.78 0.29 0.81 7.70 1.05 0.55 29.36 0.64 0.23 0.29 2.31 0.82 CV 0.042 0.558 0.780 0.600 0.353 0.384 0.164 0.018 0.544 0.290 0.600 0.299 0.354 0.125 B Min 30.9 33.0 3.0 0.2 0.5 20.7 6.2 30.6 40.0 2.6 0.3 0.6 7.2 6.5 Max 33.1 71.0 9.5 0.5 2.4 53.5 7.5 32.3 68.0 7.4 0.5 2.1 38.7 6.9 Median 32.0 58.8 8.0 0.4 1.1 32.6 6.6 30.9 60.0 4.6 0.4 1.1 15.6 6.7 Mean 32.0 57.0 7.0 0.4 1.2 33.5 6.8 31.1 56.8 4.9 0.4 1.1 17.1 6.7 SD 0.83 13.24 2.54 0.10 0.65 11.18 0.44 0.65 10.09 1.74 0.09 0.53 11.44 0.13 CV 0.026 0.232 0.363 0.254 0.541 0.333 0.065 0.021 0.178 0.354 0.230 0.472 0.669 0.019 C Min 31.5 39.2 7.9 0.3 0.7 7.3 7.9 33.6 53.0 10.3 0.3 0.6 10.7 9.4 Max 31.7 44.0 9.1 0.4 0.9 13.4 8.6 33.6 54.0 10.2 0.3 0.9 21.6 9.4 Median 31.7 39.5 9.1 0.4 0.7 13.4 8.6 33.6 54.0 10.2 0.3 0.6 21.6 9.4 Mean 31.6 40.9 8.7 0.3 0.8 11.4 8.3 33.6 53.7 10.3 0.3 0.7 18.0 9.4 SD 0.16 2.69 0.70 0.03 0.13 3.54 0.36 0.00 0.58 0.01 0.00 0.17 6.29 0.01 CV 0.005 0.066 0.080 0.092 0.168 0.312 0.043 0.000 0.011 0.001 0.002 0.236 0.350 0.001 D
Min 30.1 53.0 4.7 0.3 2.6 6.1 6.7 30.9 58.0 5.4 0.4 0.7 12.0 6.9 Max 32.3 62.0 7.6 0.4 10.5 30.3 7.1 33.5 65.0 9.6 0.4 1.6 28.0 8.5 Median 30.8 56.5 5.7 0.4 6.8 19.9 7.0 32.0 61.0 7.0 0.4 1.1 17.0 7.5 Mean 31.0 57.0 5.9 0.4 6.7 19.1 6.9 32.0 61.0 7.6 0.4 1.1 18.1 7.6 SD 0.97 3.74 1.31 0.03 4.25 12.13 0.19 1.02 2.28 1.68 0.01 0.31 6.15 0.69 CV 0.031 0.066 0.222 0.087 0.639 0.636 0.028 0.032 0.037 0.222 0.036 0.282 0.340 0.090
Table 3 Results of dissimilarity and heterogeneity tests. SPP= Phytoplankton at species level; FG= Phytoplankton at functional groups level; Reg= Regional scale; River= Amazon River; A, B, C and D= lakes. DIS= dissimilarity index; HTR= Heterogeneity index; F= f-statistics; p= significant value of test (≤0.05 significative); LW1d= mean distance to centroid in 2009; LW2d= mean distance to centroid in 2010.
Environmental SPP FG
ADONIS Betadisper ADONIS Betadisper ADONIS Betadisper
F p LW1d LW2d p F p LW1d LW2d p F p LW1d LW2d p Reg 2.262 0.046 2.999 2.654 0.318 1.170 0.299 0.645 0.638 0.538 0.620 0.615 0.617 0.585 0.230 River 1.502 0.177 1.657 2.454 0.247 0.772 0.672 0.483 0.562 0.488 0.702 0.753 0.399 0.522 0.429 A 2.318 0.137 2.817 1.556 0.161 1.050 0.433 0.594 0.536 0.473 1.181 0.383 0.579 0.520 0.487 B 1.473 0.207 2.528 2.008 0.160 2.525 0.003 0.420 0.460 0.622 3.429 0.008 0.417 0.552 0.225 C 6.070 0.010 1.733 1.774 0.930 1.287 0.200 0.562 0.438 0.483 4.790 0.100 0.319 0.185 0.733 D 3.894 0.003 2.841 2.140 0.076 1.648 0.136 0.541 0.440 0.491 2.593 0.060 0.392 0.468 0.854
At the local scale, the analyses showed that only L-C and L-D had a significant dissimilarity (P < 0.05) for ENV but did not have a significative difference (P > 0.05) in heterogeneity. The L-C and L-D were environmentally dissimilar between periods, although the heterogeneity inside the lake was not. Moreover, the heterogeneity of the phytoplankton abundance was not different between the periods for none of the lakes, except L-B which exhibited a significant dissimilarity between periods, for SPP and FG (Table 3).
Figure 3:Bar graph of the most representative phytoplankton species and functional groups. LW1 2009; LW2 2010; a and b species graphs; c and d functional groups graphs; Reg regional scale; River Amazon river; A, B, C and D lakes; S1, TC, MP, H1, G, P codon of phytoplankton functional groups
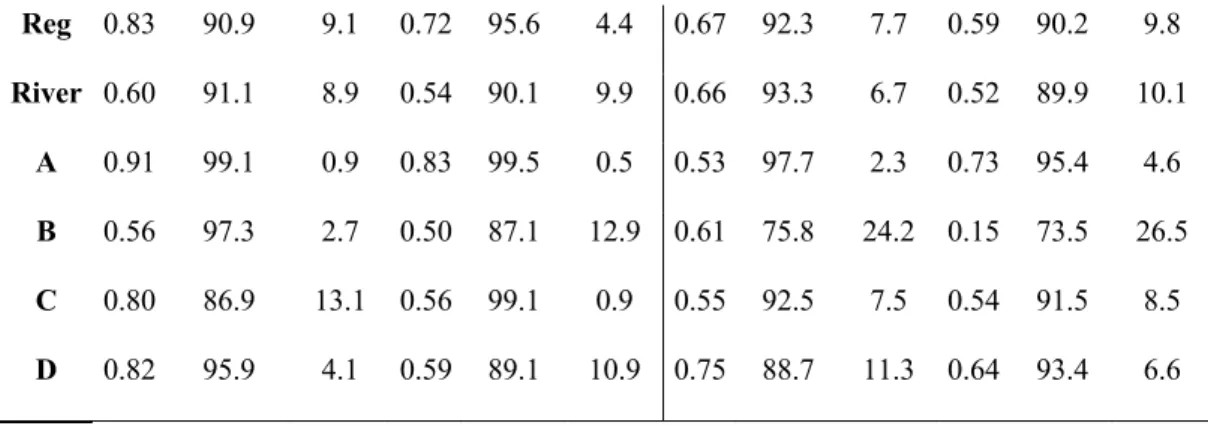
The total biodiversity βT was greater during LW1 than during LW2 for both, SPP and FG approaches, at both scales (Table 4). Whatever the scale and the approach, βT is principally composed by replacement of species or functional groups (Table 4). This result means that there was considerable heterogeneity of SPP and FG among sampling sites. However, L-C and L-D presented the highest differences of SPP-βT among periods, indicating a considerable dissimilarity in the composition of species between the periods in these two lakes. These results are summarized in Table 4.
Table 4 Results of Beta diversity test. SPP= Phytoplankton at species level; FG= Phytoplankton at functional groups level; LW1= 2009 low water period; LW2= 2010 low water period; Reg= Regional scale; River= Amazon River; A, B, C and D= Lakes; βT= total beta diversity; %Rep= proportion of βT due to replacement; %Nes= proportion of βT due to nestedness.
SPP FG
LW1 LW2 LW1 LW2
Reg 0.83 90.9 9.1 0.72 95.6 4.4 0.67 92.3 7.7 0.59 90.2 9.8 River 0.60 91.1 8.9 0.54 90.1 9.9 0.66 93.3 6.7 0.52 89.9 10.1 A 0.91 99.1 0.9 0.83 99.5 0.5 0.53 97.7 2.3 0.73 95.4 4.6 B 0.56 97.3 2.7 0.50 87.1 12.9 0.61 75.8 24.2 0.15 73.5 26.5 C 0.80 86.9 13.1 0.56 99.1 0.9 0.55 92.5 7.5 0.54 91.5 8.5 D 0.82 95.9 4.1 0.59 89.1 10.9 0.75 88.7 11.3 0.64 93.4 6.6
The canonical analysis performed with dbRDA showed that variation of species composition was significantly related to environmental variables (p<0.005) at SPP level during both periods (Figure 4. a and c), but not for FG approach (p>0.005) (Figure 4. b and d). Although there is a significant result at SPP level, the strength of the relationship between species and environmental variables is only weak for both periods, once we have low adjR2 (Figure 4. a and c).
Figure 4: Distance-based redundancy analysis (dbRDA). a and c = SPP-βT explained by
environmental variables at species level; b and d = FG-βT explained by environmental variables at functional group level; dbRDA1 Axis1; dbRDA2 Axis2; adjR2 adjusted R2; P significant value (≤ 0.05 significative); Temp temperature; Cond conductivity; O2 dissolved oxygen; Alc alkalinity; NH4 Ammonium; Chl-a Chlorophyll-a; River Amaon river; A, B, C, and D lakes
Discussion
Studies about floodplains have sought to identify and understand the mechanisms responsible for generating structural, biological and environmental patterns (De Oliveira & Calheiros, 2000; Panarelli et al., 2013; Bozelli et al., 2015). Our results suggest that although on a regional scale there is a pattern that repeats between two similar hydrologic periods, the same does not seem to be right on a local scale. As expected, between the periods on the regional scale, there is a significant environmental but not a biological difference.
The results show that cyanobacteria were the most abundant phytoplankton group found during both periods. Some genera of cyanobacteria can fix atmospheric nitrogen (Schindler et al., 2008; Thad Scott & McCarthys, 2010; Schindler, 2012), others may also store phosphorus (Lampert & Sommer, 2007). The nitrogen-fixing cyanobacteria belong to codon H1 and were found in all lakes in at least one period. Also, some genera of cyanobacteria can differentiate other specialized cells like the akinetes, spore-like cells, characterized by a thick cell wall and by a multilayered extracellular envelope (Adams & Duggan, 1999). These cells are produced in response to unfavorable environmental conditions, which probably result in a shortage of cellular energy when environmental conditions become suitable again, akinetes germinate into vegetative cells (Sciuto & Moro, 2015). All these skills give to cyanobacteria a competitive vantage and might explain why environmental dissimilarity does not promote dissimilarity in phytoplankton community on a regional scale.
The Amazon aquatic environment exhibits a complex interaction, promoting heterogeneous environments (Bonnet et al., 2008, 2017), and this heterogeneity reflects in phytoplankton community. Our results showed that in spite of there are species differences between locals and periods, these species belong to same functional groups. In addition, the functional groups found on a regional scale in both periods are characteristic of stirred environments. This condition promotes environmental differences between the sample units and maintains the heterogeneity between periods.
Even though all sites were connected to the main channel of the river, the heterogeneity on the local scale was significant. During LW1, in the Amazon River, the great representativity of codon TC (characteristic of standing waters, or slow-flowing rivers), reflect the influence of tributaries in marginal areas that are small and have low-flux conditions. The results of the LW2 period also reflects an influence of marginal areas, once some species and functional groups exhibited during LW2 are ‘non-adapted’ to river conditions, as LW1. The interannual variation of environmental conditions affects the sites differently, and these differences affect the composition of phytoplankton in the river. The amplitude of the flood in each hydrological cycle is also a factor to be considered. During 2009, flood reached a very high water level (Figure 1) and was recognized as exceptional (Chen et al., 2010), while 2010 was considered as dry when compared with the historical mean.
L-C and L-D lakes did not exhibit differences in environmental and biological approaches for both, dissimilarity and heterogeneity. In these lakes, the representativity of cyanobacteria was greater than in the others lakes, and probably for the same reasons than described for the regional scale (cyanobacteria skills), there was no biological dissimilarity. These floodplain lakes are closely located downstream the Madeira-Amazon rivers junction and tend to be influenced due to their proximity. The presence of FG MP supports this influence, once this codon includes organisms that could resist to dispersal process, due to their eco-physiological adaptations. It is generally associated with large rivers (Sharma et al., 2006; Chrisostomou et al., 2009).
L-A did not show dissimilarity or significant heterogeneity for both, environmental and biological approaches. The results obtained in L-A draw attention during LW2 because this lake is widely
used for both subsistence and commercial agriculture (Davidson et al., 2012; Sampaio et al., 2012), and almost 100% of biomass presented was composed by cyanobacteria in this period. In addition, L-A is influenced by Manacapurú river, a blackwater river rich in organic matter at the north. The cyanobacteria blooms are usually related to eutrophication and may represent risks to the ecological balance of ecosystems and public health due to the potential release of toxins, as evidenced by several studies (Paerl & Otten, 2013; Pimentel & Giani, 2014; Rastogi et al., 2015; Sukenik et al., 2015). Moreover, deforestation, agricultural and fisheries activities, such as those practiced in this lake, may accelerate and intensified the eutrophication processes (Affonso et al., 2011; Rastogi et al., 2014).
L-B lake was the only one where biological dissimilarity between periods for both, SPP and FG approach was exhibited. L-B is connected to Solimões River by one channel at north. During low water and flushing periods, the water flows from L-B to the mainstream, thus the influence during this period is exclusively from other water sources such rain, runoff from local watershed and seepage (Bonnet et al., 2017).
Considering the functional approach, we can note that the composition and structure of the phytoplankton community changed between the two periods. During LW1, the most representative codon is characterized by highly light deficient conditions and by photo-adapting Cyanobacteria, but sensitive to flushing. During LW2, the most representative codon is also characteristic of a light deficiency condition and eutrophic standing waters, or slow flowing rivers, but is sensitive to nutrient deficiency (Reynolds et al., 2002; Padisák et al., 2009). Thus, the changes that occurred between the two periods of low waters, can lead to a change in the community present in this lake. The same explanation could be used to interpret the results from the other lakes, but none of them presented significant differences in biological community.
The beta diversity approach also demonstrates biological heterogeneity, and its components may indicate how it occurs. The comparison of beta diversity data enables to highlight why there were differences in community composition among sites inside the lakes between the periods. High environmental heterogeneity favors high replacement rates of organisms with high dispersal capacity, specifically phytoplankton (Beisner et al., 2006; Lima-Mendez et al., 2015; Machado et al., 2015; Wojciechowski et al., 2017). Our βT results showed that species and functional groups replacement was more intense than nestedness in all analyses. The replacement of species and functional groups causes a great level of variation between sites, which is reflected in high heterogeneity. This also helps to understand the previous heterogeneity tests for biological data. Even though in L-A, L-C and L-D, the same species composition occurs in the two periods (no significant dissimilarity), the structure of species or functional groups composition between the sample units inside these lakes is variable (no significant differences in heterogeneity). On the other hand, even though in L-B, the different species composition promotes a significant dissimilarity, the structure of this composition in each site inside this lake, is also variable as in the other lakes. In conclusion, we observe the same heterogeneity between periods.
Moreover, when βT of species is bigger than βT of functional groups, it means that the species belong to the same few FGs, despite the great variability at species level. This occurs during LW1 on the regional scale and on local scale in L-A, L-C, and L-D and during LW2 on the regional scale and in most of the lakes. This means that the conditions were more selective and favors organisms with a specific ability. Contrarily, when βT of functional groups was bigger than βT of species, the conditions were less selective and more favorable to a wider range of phytoplankton. This occurred in the River and L-B during LW1 period, and in L-C during LW2.
Thus, there is not a defined pattern at local scale, but at regional scale it exists. In addition, the detection of regional patterns depends on the strength of the environmental gradients (Ptacnik et al., 2010). Hence, factors such as water residence time, flux, the local contribution of streams and other sources like subterraneous water and rain, seem to be as important as environmental factors measured to structure the phytoplankton community. Indeed, the hydrological balance
during high water period plays a vital role in determining the magnitude of the river-floodplain exchanges and drives substantial interannual variability (Rudorff et al., 2014b). Our canonical analyses with a dbRDA, show that environmental conditions measured were significant for species in both periods, but not for functional groups. Even so, the environmental variables measured, were not very explicative for the variance observed indicating again that there are others factors that play important role in the biological dynamics. Despite this, our results showed that there are interannual variations that can be observed in the phytoplankton community. A deepening of dispersion processes such as those promoted by connection with the main river channel, dispersion agents (eg, air, birds) and the non-directional processes that operate in the environments (Salmaso et al., 2015) are essential factors that can contribute to a better understanding of these systems.
Conclusion
We identified a large number of phytoplankton species, but they belong to a relatively small number of functional groups. There exist significant interannual variations regarding environmental conditions but not regarding phytoplankton community structure at the regional scale. The ability of cyanobacteria to adapt to contrasted ecological conditions is a plausible explanation to account for the absence of biological dissimilarities. The same is observed at local scale except for one site where biological dissimilarity was evidenced between both periods and could be explained by contrasting inputs from the local drainage basin between the two periods. Beta-diversity analysis evidenced the high replacement rates and that there is no defined pattern at the local scale, although at the regional level, it exists. The strength of the environmental gradients is an essential factor to identify trends for the Amazonian floodplain system.
A
cknowledgements
The data used in this manuscript were acquired within the framework of the CARBAMA Project (funded by the white program from the French Research Agency ANR 2009–2012); and the CYMENT Project (funded by the RTRA/STAE foundation 2008–2011 supported by the International Joint Laboratory LMI OCE (IRD/University of Brasilia) funded by the IRD and Conselho Nacional de Desenvolvimento Científico e Tecnológico (CNPq). The work also received funding from the European Union’s Horizon 2020 Research and innovation program under the Marie Skłodowska- Curie Grant Agreement No. 691053. The first author is very grateful to the Coordenação de Aperfeiçoamento de Pessoal de Nível Superior (Capes) for providing financial assistance. This article is part of the research activities of the project INCT No 16- 2014 ODISSEIA, with funding from CNPq/Capes/FAPDF.
References
Adams, D. G., & P. S. Duggan, 1999. Tansley Review No. 107. Heterocyst and akinete differentiation in cyanobacteria. New Phytologist 144: 3–33
Affonso, A., C. Barbosa, & E. Novo, 2011. Water quality changes in floodplain lakes due to the Amazon River flood pulse: Lago Grande de Curuaí (Pará). Brazilian Journal of Biology 71: 601– 610
Alcântara, E., E. M. Novo, C. F. Barbosa, M.-P. Bonnet, J. Stech & J. P. Ometto, 2011.
Environmental factors associated with long-term changes in chlorophyll-a concentration in the Amazon floodplain. Biogeosciences Discussions 8: 3739–3770.
Anderson, M. J., 2001. A new method for non parametric multivariate analysis of variance. Austral Ecology 26: 32–46.
Anderson, M. J., 2006. Distance-based tests for homogeneity of multivariate dispersions. Biometrics 62: 245–253.
Anderson, M. J., K. E. Ellingsen & B. H. McArdle, 2006. Multivariate dispersion as a measure of beta diversity. Ecology Letters 9: 683–693.
Angeler, D. G. & S. Drakare, 2013. Tracing alpha, beta, and gamma diversity responses to environmental change in boreal lakes. Oecologia 172: 1191–1202.
APHA, 1998. Standard Methods for Examination of Water and Wastewater (Standard Methods for the Examination of Water and Wastewater). Standard Methods Washington, D.C., USA. 5– 16, https://www.amazon.com/standard- methods-examination-water-wastewater/dp/08. Baselga, A., 2010. Partitioning the turnover and nestedness components of beta diversity. Global Ecology and Bio- geography 19: 134–143.
Baselga, A. & F. Leprieur, 2015. Comparing methods to sepa- rate components of beta diversity. Methods in Ecology and Evolution 6: 1069–1079.
Beisner, B. E., P. R. Peres-Neto, E. S. Lindstro ̈m, A. Barnett & M. L. Longhi, 2006. The role of environmental and spatial processes in structuring lake communities from bacteria to fish. Ecology 87: 2985–2991.
Bonnet, M.-P., G. Barroux, J. M. Martinez, F. Seyler, P. Mor- eira-Turcq, G. Cochonneau, J. M. Melack, G. Boaventura, L. Maurice-Bourgoin, J. G. Leo ́n, E. Roux, S. Calmant, P. Kosuth, J. L. Guyot & P. Seyler, 2008. Floodplain hydrology in an Amazon floodplain lake (Lago Grande de Curua ́ı). Journal of Hydrology 349: 18–30.
Bonnet, M.-P., S. Pinel, J. Garnier, J. Bois, G. Resende Boaventura, P. Seyler & D. Motta Marques, 2017. Ama- zonian floodplain water balance based on modelling and analyses of hydrologic and electrical conductivity data. Hydrological Processes 31: 1702–1718.
Bozelli, R. L., S. M. Thomaz, A. A. A. A. Padial, P. M. Lopes & L. M. Bini, 2015. Floods decrease zooplankton beta diversity and environmental heterogeneity in an Amazo- nian floodplain system. Hydrobiologia 753: 233–241.
Carvalho, J. C., P. Cardoso, P. A. V. Borges, D. Schmera & J. Podani, 2013. Measuring fractions of beta diversity and their relationships to nestedness: a theoretical and empiri- cal
Chen, J. L., C. R. Wilson & B. D. Tapley, 2010. The 2009 exceptional Amazon flood and interannual terrestrial water storage change observed by GRACE. Water Resources Research 46: 1–10.
Chrisostomou, A., M. Moustaka-Gouni, S. Sgardelis & T. Lanaras, 2009. Air-dispersed phytoplankton in a Mediter- ranean river-reservoir system (Aliakmon-Polyphytos, Greece). Journal of plankton research Oxford University Press 31: 877–884.
Chust, G., X. Irigoien, J. Chave & R. P. Harris, 2013. Latitudinal phytoplankton distribution and the neutral theory of bio- diversity. Global Ecology and Biogeography 22: 531–543.
Ciarrocchi, G., A. Fortunato, F. Cobianchi & A. Falaschi, 1976. An intracellular endonuclease of Bacillus subtilis specific for single-stranded DNA. European journal of biochem- istry 61: 487– 492.
Davidson, E. A., A. C. de Arau ́jo, P. Artaxo, J. K. Balch, I. F. Brown, M. M. C. Bustamante, M. T. Coe, R. S. DeFries, M. Keller, M. Longo, J. W. Munger, W. Schroeder, B. S. Soares-Filho, C. M. Souza & S. C. Wofsy, 2012. The Amazon basin in transition. Nature 481: 321–328.
De Oliveira, M. D. & D. F. Calheiros, 2000. Flood pulse influ- ence on phytoplankton communities of the south Pantanal
floodplain, Brazil. Hydrobiologia 427: 101–112.
Dray, S., G. Blanchet, D. Borcard, G. Guenard, T. Jombart, G. Larocque, P. Legendre, N. Madi, & H. Wagner, 2016. Adespatial: multivariate multiscale spatial analysis. R
package version 0.0-9.
Forsberg, B. R., J. M. Melack, T. Dunne, R. B. Barthem, M.
Goulding, R. C. D. Paiva, M. V. Sorribas, U. L. Silva & S. Weisser, 2017. The potential impact of new Andean dams on Amazon fluvial ecosystems. PLoS ONE 12: e0182254.
Gianuca, A. T., S. A. J. J. Declerck, P. Lemmens & L. De Meester, 2017. Effects of dispersal and environmental heterogeneity on the replacement and nestedness compo- nents of ?-diversity. Ecology 98: 525–533.
Goes, J. I., H. D. R. Gomes, A. M. Chekalyuk, E. J. Carpenter, J. P. Montoya, V. J. Coles, P. L. Yager, W. M. Berelson, D. G. Capone, R. A. Foster, D. K. Steinberg, A. Subramaniam & M. A. Hafez, 2014. Influence of the Amazon River discharge on the biogeography of phytoplankton commu- nities in the western tropical north Atlantic. Progress in Oceanography Elsevier Ltd 120: 29–40.
Grasshoff, P., 1983. Methods of Seawater Analysis, Vol. 419. Verlag Chemie, Weinheim: 61–72. Hess, L. L., J. M. Melack, A. G. Affonso, C. Barbosa, M. Gastil- Buhl & E. M. L. M. Novo, 2015. Wetlands of the lowland amazon basin: extent, vegetative cover, and dual-season inundated area as mapped with JERS-1 synthetic aperture radar. Wetlands 35: 745–756.
Hillebrand, H., C.-D. Du ̈rselen, D. Kirschtel, U. Pollingher & T. Zohary, 1999. Biovolume calculation for pelagic and benthic microalgae. Journal of Phycology 35: 403–424.
Hoek, C., H. Van den Hoeck, D. Mann & H. M. Jahns, 1995. Algae: an introduction to phycology. Cambridge Univer- sity Press, Cambridge.
Howeth, J. G. & M. A. Leibold, 2010. Species dispersal rates alter diversity and ecosystem stability in pond metacom- munities. Ecology 91: 2727–2741.
Huston, M. A., 1999. Variation in the diversity of plants and animals local processes and regional patterns: appropriate scales for understanding variation in the diversity of plants and animals. Oikos 86: 393–401.
Jespersen, A.-M. & K. Christoffersen, 1987. Measurements of chlorophyll-a from
phytoplankton using ethanol as extraction solvent. Archive of Hydrobiology 109: 445–454. Junk, W. J., M. T. F. Piedade, F. Wittmann, J. Scho ̈ngart & P. Parolin, 2010. Amazonian
Floodplain Forests: Ecophysi- ology, Biodiversity and Sustainable Management. Springer, New York.
Junk, W. J., M. T. F. Piedade, J. Scho ̈ ngart & F. Wittmann, 2012. A classification of major natural habitats of Amazonian white-water river floodplains (va ́rzeas). Wetlands Ecology and Management 20: 461–475.
Kruk, C., N. Mazzeo, G. Lacerot & C. S. Reynolds, 2002. Classification schemes for
phytoplankton: a local valida- tion of a functional approach to the analysis of species temporal replacement. Journal of Plankton Research 24: 901–912.
Lampert, W. & U. Sommer, 2007. Limnoecology: the ecology of lakes and streams. Oxford University Press, Oxford.
Lawton, J. H., 1999. Are there general laws in ecology? Oikos 84: 177.
Legendre, P., 2014. Interpreting the replacement and richness difference components of beta diversity. Global Ecology and Biogeography 23: 1324–1334.
Legendre, P. & M. J. Anderson, 1999. Distance-based redun- dancy analysis: testing
multispecies responses in multi- factorial ecological experiments. Ecological Monographs 69: 1–24.
Legendre, P. & M. De Ca ́ceres, 2013. Beta diversity as the variance of community data: dissimilarity coefficients and partitioning. Ecology Letters 16: 951–963.
Levin, S. A., 1992. The problem of pattern and scale in ecology: the Robert H. MacArthur award lecture. Ecology 73: 1943–1967.
Lima-Mendez, G., K. Faust, N. Henry, J. Decelle, S. Colin, F. Carcillo, S. Chaffron, J. C. Ignacio-Espinosa, S. Roux, F. Vincent, L. Bittner, Y. Darzi, J. Wang, S. Audic, L. Ber- line, G. Bontempi, A. M. Cabello, L. Coppola, F. M. Cornejo-Castillo, F. D’Ovidio, L. De Meester, I. Fer- rera, M.-J. Garet-Delmas, L. Guidi, E. Lara, S. Pesant, M. Royo-Llonch, G. Salazar, P. Sanchez, M. Sebastian, C. Souffreau, C. Dimier, M. Picheral, S. Searson, S. Kandels- Lewis, G. Gorsky, F. Not, H. Ogata, S. Speich, L. Stem- mann, J. Weissenbach, P. Wincker, S. G. Acinas, S. Sunagawa, P. Bork, M. B. Sullivan, E. Karsenti, C. Bowler, C. de Vargas & J. Raes, 2015. Determinants of community structure in the global plankton interactome. Science 348: 1262073.
Loverde-Oliveira, S. M. & V. L. M. Huszar, 2007. Phyto- plankton ecological responses to the flood pulse in a Pan- tanal lake, Central Brazil. Acta Limnologica Brasiliensia 19: 117–130. Lund, J. W. G., C. Kipling & E. D. Le Cren, 1958. The inverted microscope method of estimating algal numbers and the statistical basis of estimations by counting. Hydrobiologia 11: 143–170. Machado, K. B., P. P. Borges, F. M. Carneiro, J. F. de Santana, L. C. G. Vieira, V. L. de Moraes Huszar & J. C. Nabout, 2015. Using lower taxonomic resolution and ecological approaches as a surrogate for plankton species. Hydrobi- ologia 743: 255–267.
Massol, F., D. Gravel, N. Mouquet, M. W. Cadotte, T. Fukami & M. A. Leibold, 2011. Linking community and ecosystem dynamics through spatial ecology. Ecology Letters 14: 313–323. Mcardle, B. H. & M. J. Anderson, 2013. Fitting multivariate models to community data: a comment on distance-based redundancy analysis. Ecology 82: 290–297.
McGill, B. J., B. J. Enquist, E. Weiher & M. Westoby, 2006. Rebuilding community ecology from functional traits. Trends in Ecology and Evolution 21: 178–185.
Merico, A., G. Brandt, S. L. Smith & M. Oliver, 2014. Sus- taining diversity in trait-based models of phytoplankton communities. Frontiers in Ecology and Evolution 2: 1–8.
Mitsch, W. J. & J. G. Gosselink, 2007. Wetlands, 4th ed. Wiley, Hoboken.
Oksanen, J., F. G. Blanchet, R. Kindt, P. Legendre, P. R. Minchin, R. B. O’Hara, G. L. Simpson, P. Solymos, M. H. H. Stevens, & H. Wagner, 2013. Package ‘vegan.’ Community ecology package, version 2
Padisák, J., L. O. Crossetti, & L. Naselli-Flores, 2009. Use and misuse in the application of the phytoplankton functional classification: a critical review with updates. Hydrobiologia 621: 1– 19.
Paerl, H. W., & T. G. Otten, 2013. Harmful Cyanobacterial Blooms: Causes, Consequences, and Controls. Microbial Ecology 65: 995–1010.
Panarelli, E., A. Güntzel, & C. Borges, 2013. How does the Taquari River influence in the cladoceran assemblages in three oxbow lakes?. Brazilian Journal of Biology 73: 717–725 Pimentel, J. S. M., & A. Giani, 2014. Microcystin production and regulation under nutrient stress conditions in toxic Microcystis strains. Applied and Environmental Microbiology 80: 5836–5843.
Prance, G. T., 1980. A terminologia dos tipos de florestas amazônicas sujeitas a inundação. Acta Amazonica 10: 499–504
Ptacnik, R., T. Andersen, P. Brettum, L. Lepistö, & E. Willén, 2010. Regional species pools control community saturation in lake phytoplankton. Proceedings. Biological sciences / The Royal Society 277: 3755–3764.
Rastogi, R. P., D. Madamwar, & A. Incharoensakdi, 2015. Bloom dynamics of cyanobacteria and their toxins: Environmental health impacts and mitigation strategies. Frontiers in Microbiology 6: 1–22.
Rastogi, R. P., R. P. Sinha, & A. Incharoensakdi, 2014. The cyanotoxin-microcystins: current overview. Reviews in Environmental Science and Biotechnology 1–35.
Reynolds, C. S., V. Huszar, C. Kruk, L. Naselli-Flores, & S. S. Melo, 2002. Towards a functional classification of the freshwater phytoplankton. Journal of Plankton Research 24: 417–428 Rudorff, C. M., J. M. Melack, & P. D. Bates, 2014a. Flooding dynamics on the lower Amazon floodplain: 1. Hydraulic controls on water elevation, inundation extent, and river-floodplain discharge. Water Resources Research 50: 619–634
Rudorff, C. M., J. M. Melack, & P. D. Bates, 2014b. Flooding dynamics on the lower Amazon floodplain: 2. Seasonal and interannual hydrological variability. Water Resources Research 50: 635–649
Salmaso, N., L. Naselli-Flores, & J. Padisák, 2015. Functional classifications and their application in phytoplankton ecology. Freshwater Biology 60: 603–619
Sampaio, F. P. R., D. G. Aguiar, N. P. Filizola Junior, & T. Schor, 2012. Níveis fluviométricos e o custo de vida em cidades ribeirinhas da Amazônia: O caso de Manacapuru e Óbidos.
Symposium SELPER.
Saraiva, D. D., K. da S. de Sousa, & G. E. Overbeck, 2015. Multiscale partitioning of cactus species diversity in the South Brazilian grasslands: Implications for conservation. Journal for Nature Conservation Elsevier GmbH. 24: 117–122.
Schindler, D. W., 2012. The dilemma of controlling cultural eutrophication of lakes. Proceedings of the Royal Society B: Biological Sciences 279: 4322–4333.
Schindler, D. W., R. E. Hecky, D. L. Findlay, M. P. Stainton, B. R. Parker, M. J. Paterson, K. G. Beaty, M. Lyng, & S. E. M. Kasian, 2008. Eutrophication of lakes cannot be controlled by reducing nitrogen input: Results of a 37-year whole-ecosystem experiment. Proceedings of the National Academy of Sciences 105: 11254–11258.
Schöngart, J., & W. J. Junk, 2007. Forecasting the flood-pulse in Central Amazonia by ENSO-indices. Journal of Hydrology 335: 124–132
Sciuto, K., & I. Moro, 2015. Cyanobacteria: the bright and dark sides of a charming group. Biodiversity and Conservation 24: 711–738.
Sharma, N. K., S. Singh, & A. K. Rai, 2006. Diversity and seasonal variation of viable algal particles in the atmosphere of a subtropical city in India. Environmental research Elsevier 102: 252–259.
Simberloff, D., 2004. Community ecology: is it time to move on? (An American Society of Naturalists presidential address). The American naturalist. , 787–799.
Sioli, H., 1984. The Amazon and its main affluents: Hydrography, morphology of the river courses, and river types In Sioli, H. (ed), The Amazon: Limnology and landscape ecology of a mighty tropical river and its basin. Springer Netherlands, Dordrecht: 127–165
Sippel, S. J., S. K. Hamilton, & J. M. Melack, 1992. Inundation Area and Morphometry of Lakes on the Amazon River Floodplain, Brazil. Archiv Fur Hydrobiologie 123: 385–400.
Stendera, S., R. Adrian, N. Bonada, M. Cañedo-Argüelles, B. Hugueny, K. Januschke, F. Pletterbauer, & D. Hering, 2012. Drivers and stressors of freshwater biodiversity patterns across different ecosystems and scales: A review. Hydrobiologia 696: 1–28.
Sukenik, A., A. Quesada, & N. Salmaso, 2015. Global expansion of toxic and non-toxic cyanobacteria: effect on ecosystem functioning. Biodiversity and Conservation 24: 889–908. Team, R. C., 2018. R: A Language and Environment for Statistical Computing, R Foundation for Statistical Computing, Austria, 2015. ISBN 3-900051-07-0: URL http://www. R-project. org. Thad Scott, J., & M. J. McCarthys, 2010. Nitrogen fixation may not balance the nitrogen pool in lakes over timescales relevant to eutrophication management. Limnology and Oceanography 55: 1265–1270.
Thomaz, S. M., L. M. Bini, & R. L. Bozelli, 2007. Floods increase similarity among aquatic habitats in river-floodplain systems. Hydrobiologia 579: 1–13.
Tockner, K., F. Malard, & J. V. Ward, 2000. An extension of the flood pulse concept. Hydrological Processes 14: 2861–2883.
Utermöhl, H., 1958. Zur vervollkommnung der quantitativen phytoplankton-methodik. Mitt. int. Ver. theor. angew. Limnol. 9: 1–38.
Wacklin, P., L. Hoffmann, & J. Komarek, 2009. Nomenclatural validation of the genetically revised cyanobacterial genus Dolichospermum (Ralfs ex Bornet et Flahault) comb. nova. Fottea 9: 59–64.
Webb, C. T., J. A. Hoeting, G. M. Ames, M. I. Pyne, & N. LeRoy Poff, 2010. A structured and dynamic framework to advance traits-based theory and prediction in ecology. Ecology Letters 13: 267–283.
Westoby, M., & I. J. Wright, 2006. Land-plant ecology on the basis of functional traits. Trends in Ecology and Evolution. , 261–268.
Whittaker, R. H., 1960. Vegetation of the Siskiyou Mountains , Oregon and California Author ( s ): R . H . Whittaker Published by : Ecological Society of America Stable URL :
http://www.jstor.org/stable/1943563 Your use of the JSTOR archive indicates your acceptance of JSTOR ’ s. America 30: 279–338, http://www.jstor.org/stable/1943563.
Wojciechowski, J., J. Heino, L. M. Bini, & A. A. Padial, 2017. Temporal variation in
phytoplankton beta diversity patterns and metacommunity structures across subtropical reservoirs. Freshwater Biology 62: 751–766.
Zagmajster, M., D. Eme, C. Fišer, D. Galassi, P. Marmonier, F. Stoch, J. F. Cornu, & F. Malard, 2014. Geographic variation in range size and beta diversity of groundwater crustaceans: Insights from habitats with low thermal seasonality. Global Ecology and Biogeography 23: 1135–1145.