HAL Id: hal-01930391
https://hal.archives-ouvertes.fr/hal-01930391
Submitted on 21 Nov 2018HAL is a multi-disciplinary open access
archive for the deposit and dissemination of sci-entific research documents, whether they are pub-lished or not. The documents may come from teaching and research institutions in France or abroad, or from public or private research centers.
L’archive ouverte pluridisciplinaire HAL, est destinée au dépôt et à la diffusion de documents scientifiques de niveau recherche, publiés ou non, émanant des établissements d’enseignement et de recherche français ou étrangers, des laboratoires publics ou privés.
A large set of 26 new reference transcriptomes dedicated
to comparative population genomics in crops and wild
relatives
Gautier Sarah, Félix Homa, Stéphanie Pointet, Sandy Contreras, François
Sabot, Benoit Nabholz, Sylvain Santoni, Laure Sauné, Morgane Ardisson,
Nathalie Chantret, et al.
To cite this version:
Gautier Sarah, Félix Homa, Stéphanie Pointet, Sandy Contreras, François Sabot, et al.. A large set of 26 new reference transcriptomes dedicated to comparative population genomics in crops and wild relatives. Molecular Ecology Resources, Wiley/Blackwell, 2017, 17 (3), pp.565-580. �10.1111/1755-0998.12587�. �hal-01930391�
CIAT Research Online - Accepted Manuscript
A large set of 26 new reference transcriptomes dedicated to comparative
population genomics in crops and wild relatives
The International Center for Tropical Agriculture (CIAT) believes that open access contributes to its mission of reducing hunger and poverty, and improving human nutrition in the tropics through research aimed at increasing the eco-efficiency of agriculture.
CIAT is committed to creating and sharing knowledge and information openly and globally. We do this through collaborative research as well as through the open sharing of our data, tools, and publications.
Citation:
Sarah, Gautier; Homa, Felix; Pointet, Stéphanie; Contreras, Sandy; Sabot, François; Nabholz, Benoit; Santoni, Sylvain; Sauné, Laure; Ardisson, Morgane; Chantret, Nathalie; Sauvage, Christopher; Tregear, James; Jourda, Cyril; Pot, David; Vigouroux, Yves; Chair, Hana; Scarcelli, Nora; Billot, Claire; Yahiaoui, Nabila; Bacilieri, Roberto; Khadari, Bouchaib; Boccara, Michel; Barnaud, Adéline; Péros, Jean-Pierre; Labouisse, Jean-Pierre; Pham, Jean-Louis; David, Jacques; Glémin, Sylvain; Ruiz, Manuel. 2016. A large set of 26 new reference transcriptomes dedicated to comparative population genomics in crops and wild relatives . Molecular Ecology Resources. DOI: 10.1111/1755-0998.12587
Publisher’s DOI:
http://dx.doi.org/10.1111/1755-0998.12587 Access through CIAT Research Online: http://hdl.handle.net/10568/76382 Terms:
© 2016. CIAT has provided you with this accepted manuscript in line with CIAT’s open access policy and in accordance with the Publisher’s policy on self-archiving.
This work is licensed under a Creative Commons Attribution-NonCommercial 4.0 International License.
You may re-use or share this manuscript as long as you acknowledge the authors by citing the version of the record listed above. You may not use this manuscript for commercial purposes.
Accepted
Article
This article has been accepted for publication and undergone full peer review but has
Received Date : 23-Sep-2014 Revised Date : 29-Jun-2016 Accepted Date : 06-Jul-2016 Article type : Resource Article
A large set of 26 new reference transcriptomes dedicated to
comparative population genomics in crops and wild relatives
Gautier Sarah1, Felix Homa2, Stéphanie Pointet2, Sandy Contreras1, François Sabot3, Benoit Nabholz4, Sylvain Santoni1, Laure Sauné1, Morgane Ardisson1, Nathalie Chantret1, Christopher Sauvage5, James Tregear3, Cyril Jourda2, David Pot2, Yves Vigouroux3, Hana Chair2, Nora Scarcelli3, Claire Billot2, Nabila Yahiaoui2, Roberto Bacilieri1, Bouchaib Khadari1, Michel Boccara7, Adéline Barnaud3, Jean-Pierre Péros1, Jean-Pierre Labouisse2, Jean-Louis Pham3, Jacques David6, Sylvain Glémin4 and Manuel Ruiz2,8
1INRA, UMR AGAP, F-34060 Montpellier, France 2CIRAD, UMR AGAP, F-34398 Montpellier, France 3UMR IRD-UM2-CIRAD DIADE, IRD, Montpellier, France
4Institut des Sciences de l’Evolution-Montpellier, UMR CNRS-UM2 5554, University
Montpellier II, Montpellier, France
5INRA, UR1052, GAFL, 67 allée des Chênes Domaine Saint Maurice – CS60094,
84143 Montfavet Cedex, France
6
Montpellier SupAgro, UMR AGAP, F-34060 Montpellier, France
7
CIRAD/CRC, UMR AGAP, UWI, St Augustine, Trinidad and Tobago
Accepted
Article
Keywords. Reference transcriptomes, RNA-Seq, Comparative genomics
Corresponding author. Manuel Ruiz, CIRAD, TA A-108/03, Avenue Agropolis, 34398
Montpellier Cedex 5, France, Tel : (33) 4 67 61 65 29, Fax : (33) 4 67 61 56 05, manuel.ruiz@cirad.fr
Running title. 26 new reference transcriptomes of plants
Abstract
We produced a unique large dataset of reference transcriptomes to obtain new knowledge about the evolution of plant genomes and crop domestication. For this purpose we validated a RNA-Seq data assembly protocol to perform comparative population genomics. For the validation, we assessed and compared the quality of de novo Illumina short-read assemblies using data from two crops for which an annotated reference genome was available, namely grapevine and sorghum. We used the same protocol for the release of 26 new transcriptomes of crop plants and wild relatives, including still understudied crops such as yam, pearl millet and fonio. The species list has a wide taxonomic representation with the inclusion of 15 monocots and 11
eudicots. All contigs were annotated using BLAST, prot4EST, and Blast2GO. A strong originality of the dataset is that each crop is associated with close relative species, which will permit whole genome comparative evolutionary studies between crops and their wild related species. This large resource will thus serve research communities working on both crops and model organisms. All the data are available at http://arcad-bioinformatics.southgreen.fr/.
Accepted
Article
Introduction
Population genomic approaches including both crops and wild relatives are essential to provide key information on the crop domestication processes and the dynamics of recent adaptation (Ross-Ibarra et al. 2007). This has been applied to an increasing number of species but mainly annual crops, and especially cereals (Hufford et al. 2012). However, domestication scenarios may vary between species and more insights could be gained by comparative approaches in diverse taxa (Glemin & Bataillon 2009; Meyer et al. 2012). It could be also very fruitful to compare molecular evolutionary patterns among species with contrasted life-history or ecological traits. Life-history or ecological traits may influence genome evolution through their effect on key population genetic parameters (effective size, recombination rates, and mutation rates).
Furthermore, studying the evolution of gene families and relating it to expression data across lineages may help to identify which molecular functions play a key role in adaptation. A crucial initial step for such studies is to obtain a large set of reference genes in different crops, both for wild and cultivated populations, but also in close relative species as much insight can be gained by comparing genomes beyond the domestication scale; for instance several selection detection methods require outgroup species (Vitti et al. 2013). Today, the massive sequencing technologies can produce essential resources for large comparative genomic studies among many species, including non-model species (Ellegren 2014).
We have made available a unique dataset of 26 new plant reference transcriptomes that were produced, assembled and annotated with the same protocol. We chose a set of various Mediterranean and tropical crop species with contrasted life-history traits (ex: annual herbs/trees, outcrossers/selfers) and with a wide phylogenetic distribution (including both monocots and eudicots belonging to different orders). For non-model
Accepted
Article
crops (ex: yam, fonio millet), we chose both the crop and close relatives. For some species already having a reference genome (ex: tomato, cocoa) we focused on relative outgroup species (see detailed list in Table 1). We chose high-throughput RNA-Seq technology for feasibility reasons, for possibilities of obtaining the coding part of the genome and expression levels, and for comparing the fate of some genes in different species. As we were focusing on providing tools for comparative and population
genomics analyses, we were particularly attentive to the optimization of the protocol for assembling the Illumina short-reads in order to reconstruct the best ratio of
unambiguous correct cDNAs, which we favoured instead of the exhaustive representation of transcriptomes.
We assessed and compared the quality of de novo assemblies using data from two crops for which an annotated reference genome is available, grapevine and sorghum. This study allowed us to provide a useful set of plant transcriptomes, contributing both to the enrichment of genomic resources for various crops of agronomic interest (some of them having being neglected so far such as yam, fonio millet or einkorn wheat) and phylogenetically related species that can be used as outgroups, which are invaluable tools for many evolutionary studies (Table 1). Among the chosen crops, some of them have been neglected so far while they can contribute to taking up some current agronomic challenges. For example, the diploid einkorn wheat could provide a useful resource for polyploidy wheat breeding programs, underutilized African cereals such as fonio millet deserve to be developed as an alternative crop well adapted to tropical conditions, and yam is a good model to understand clonally propagated crops.
Accepted
Article
Materials and Methods
Preparation of RNA samples
Samples were constituted by combining different organs, including leaves, fruits/grains, and inflorescence tissues. Samples were ground in liquid nitrogen and total cellular RNA was extracted using a Spectrum Plant Total RNA kit (Sigma, Inc., USA) with a DNAse treatment. Oil palm total RNAs were extracted in a similar way using an RNeasy kit (Qiagen) and Mauritia flexuosa total RNAs were extracted as described by Morcillo et al. (Morcillo et al. 2006). RNA concentration was first measured using a NanoDrop ND-1000 Spectrophotometer then with the Quant-iT™ RiboGreen®
(invitrogen) protocol on a Tecan Genius spectrofluorimeter. RNA quality was assessed by running 1 μL of each RNA sample on RNA 6000 Pico chip on a Bioanalyzer 2100 (Agilent Technologies, Inc., USA). Samples with an RNA Integrity Number (RIN) value greater than eight were deemed acceptable according to the Illumina TruRNA-Seq protocol. Usually, for each genotype, a 2 μg mixture consisting of RNA from the
inflorescence (80%) and leaves (20%) was prepared. For a few species, three sources of RNA were used: 65% from the inflorescence, 15 % from leaves, and 20% from fruits or grains when these additional organs were of specific agronomic interest and could increase the transcriptome representation.
Illumina library production
The TruSeq RNA sample Preparation v2 kit (Illumina Inc., USA) was used according to the manufacturer's protocol with the following modifications. Poly-A containing mRNA molecules were purified from 2 ug of total RNA using poly-T oligo attached magnetic beads. The purified mRNA was fragmented by addition of the fragmentation buffer and was heated at 94°C in a thermocycler for 4 min. A fragmentation time of 4 min was
Accepted
Article
used to yield library fragments of 250-300 bp. First strand cDNA was synthesized using random primers to eliminate the general bias towards the 3' end of the transcript. Second strand cDNA synthesis, end repair, A-tailing, and adapter ligation was performed in accordance with the protocols supplied by the manufacturer. Purified cDNA templates were enriched by 15 cycles of PCR for 10 s at 98°C, 30 s at 65°C, and 30 s at 72°C using PE1.0 and PE2.0 primers, and with Phusion DNA polymerase. Each indexed cDNA library was verified and quantified using a DNA 100 Chip on a
Bioanalyzer 2100 then equally mixed by ten (from different genotypes). The final library was then quantified by real time PCR with the KAPA Library Quantification Kit for Illumina Sequencing Platforms (Kapa Biosystems Ltd, SA) and adjusted to 10 nM in water prior to sequencing at the Montpellier Genomix platform
(http://www.mgx.cnrs.fr/).
Illumina library clustering and sequencing conditions
The final mixed cDNA library was sequenced using the Illumina mRNA-Seq, paired-end protocol on a HiSeq2000 sequencer, for 2 x 100 cycles. The library was diluted to 2 nM with NaOH. 2.5 μL was transferred into 497.5 μL HT1 to give a final concentration of 10 pM. 120 μL was then transferred to a 200 μL strip tube and placed on ice before
loading onto the Cluster Station. A mixed library consisting of 10 individually indexed libraries was run on a single lane. Flow cells were clustered using Paired-End Cluster Generation Kit V4, following the Illumina PE amplification Linearization Blocking PrimerHyb v7 recipe. Then, the flow cell was loaded onto the Illumina HiSeq 2000 instrument following the manufacturer's instructions. The sequencing chemistry used was v4 (FC-104-4001, Illumina) using SCS 2.6 and RTA 1.6 software with the 2 x 100 cycles, paired-end, indexed protocol. Illumina base calling files were processed using
Accepted
Article
the GERALD pipeline to produce paired sequence files containing reads for each sample in Illumina FASTQ format.
Read cleaning
Reads were preprocessed with cutadapt (Martin 2011) using the TruSeq index
sequence corresponding to the sample, searching within the whole sequence. We also used cutadapt to trim the end of the reads with low quality scores (parameter -q 20) and kept reads with a minimum length of 35 bp. We then filtered the reads on the basis of their mean quality score, keeping those with a mean quality higher than 30.
Subsequently we separated orphan reads (i.e those for which the mate was discarded in the previous steps) using a homemade script.
Assembly protocols
Reads were assembled using Abyss (Simpson et al. 2009) followed by one step of Cap3 (Huang & Madan 1999). Reads returned as singletons by the first assembly run were discarded. For assembly, only paired reads were used. Abyss was launched using the paired-end option with a kmer value of 60. Cap3 was launched with the default parameters, notably 40 bases of overlap and the percentage of identity was set at 90%.
Comparison of assembly protocols
We compared different combinations using the assemblers Abyss (Simpson et al. 2009), Cap3 (Huang & Madan 1999), and Trinity (Haas et al. 2013), with different parameters. We compared assemblies with Trinity (T), Abyss (A), and Abyss followed by one step of Cap3 (A/C), and Abyss followed by two steps of Cap3 (A/C/C) according to the strategy of Cahais et al. (2012). We used these protocols with reads from either only one individual or from multiple individuals. When the assemblies with only one
Accepted
Article
individual were used, we chose the individual with the highest read number after cleaning: EC4 for Sorghum bicolor (SSM1123) and VC2 for Vitis vinifera (Morenoa). When assemblies were performed with reads from multiple individuals, we used 10 individuals for Sorghum bicolor and 12 individuals for Vitis vinifera (Table 2). In both cases, all reads came from a single sequencing lane. Since sampling, bank preparation and sequencing conditions were the same for all individuals, we assumed that the individual with the highest read number would enable reconstruction of the maximum number of weakly expressed transcripts. To perform Trinity with reads from multiple individuals, we used in silico read normalization to reduce memory requirements and improve computational times. Trinity was launched with the default parameters, except that the threshold for minimum contig length was increased from 200 bp to 250 bp.
Criteria for comparing the quality of assemblies
For each assembly we calculated the number of contigs, the mean length of the
contigs, the N50, and the number of contigs that mapped to the reference genome (see Exonerate mapping description below). We used BWA (Li & Durbin 2009) (3
mismatches allowed) to map the reads from 10 individuals for Sorghum bicolor, and 12 individuals for Vitis vinifera to the corresponding assessed contigs. For each assembly, we calculated the percentage of mapped reads and the percentage of correctly paired mapped reads. Correctly paired mapped reads were defined as being within 1000 bases of each other. We also mapped the reads to the transcriptome predicted from the reference genome annotations.
Reference transcriptomes
For Vitis vinifera, the sequences of the transcriptome derived from the reference genome annotation were downloaded from the CRIBI genomes portal
Accepted
Article
The Sorghum bicolor reference transcriptome corresponds to the Sorghum bicolor v1.4 dataset available on the phytozome web site (http://www.phytozome.net/) at ftp://ftp.jgi-psf.org/pub/compgen/phytozome/v9.0/Sbicolor_v1.4/annotation/
(Sbicolor_79_transcript.fa).
BLAST analysis of contigs against the corresponding transcriptome
predicted from the genome
For each contig, a BLASTN search was performed against the appropriate
transcriptome reference. We only considered the first ten hits with an e-value of 1e-5. Hits were considered significant when (i) the alignment length (merging all high-scoring segment pairs) was at least 50% of the query sequence or at least 50% of the hit sequence, and (ii) sequence identity between query and hit was more than 90% across the alignment. This last threshold was chosen higher compared to Cahais et al. (2012) because contigs were here compared to the reference transcriptome of the same species.
Classification of BLAST results
Contigs were classified into seven categories, defined by the number and nature of significant BLAST hits. Based on Cahais et al. (2012) we distinguished the following cases:
a) Contigs with no significant hit were called ‘No Hit’.
b) Contigs with a single significant hit and such that no other contig found the same hit. Within this category, contigs were called ‘Full length’ if the contig ⁄ hit alignment covered at least 90% of the hit sequence or ‘Partial’ otherwise. c) Contigs with a single significant hit shared by other contigs.
Accepted
Article
Within this category, when two contigs overlapped, if the length of the hit sequence to which both contig queries aligned covered at least 50% of the shortest of the two contigs, contigs were called “Allele”, whereas those showing no significant overlap with any other contigs were called “Fragment”.
d) Contigs with several significant hits, all specific to this contig.
When the hit sequences showed significant overlap, with the hit/hit alignment covering at least 50% of the shortest of the two hit sequences, contigs were called “Multi copies”. Whereas contigs whose hits showed no significant overlap were called “Chimera”.
e) Contigs not included in any of the above categories, involving more complex patterns.
If m contigs had n significant hits, and if m and n were equal, and when the m first hits of the m contigs were distinct from each other, contigs were called ‘Full length’ or ‘Fragment’, depending on the contig ⁄ hit alignment. In all other cases, contigs were called ‘Multi copies’.
Mapping of the contigs on the reference genome
We used Exonerate (Slater & Birney 2005) to perform mapping of the contigs on the reference genome. We used the following parameters: sizes of introns limited to 5,000 bp, model set to est2genome, and percent 50 and bestn 5 to keep the best five hits if their scores were at least 50% of the best hit. In order to easily compare the positions of our mapping with the predicted mRNAs, we used the parameter showtargetgff which gave the alignment in GFF format.
For the percentage of annotations mapped by contigs, we took into account the number of distinct annotations mapped. The annotations corresponded to the
Accepted
Article
determined positions of mRNAs on the genome. The number of mapped annotations was determined by the tool IntersectBed from bedtools (Quinlan & Hall 2010).
BBMH (Best Blast Mutual Hits) comparison of transcriptomes
For Solanum melongena, the sequences of the transcriptome derived from annotation of the reference genome SME_r2.5.1 (Kazusa) was downloaded from
ftp://ftp.kazusa.or.jp/pub/eggplant/SME_r2.5.1_cds.fa.gz, the published RNA-Seq transcriptome assembly (YanXu & al) from
http://www.ncbi.nlm.nih.gov/Traces/wgs/?download=GBEF01.1.fsa_nt.gz, and the unigene set (Vegmark) from
http://cse.naro.affrc.go.jp/fukuoka/EggEST/EggUnigene_16245.fasta.zip.
Within each transcriptome, we used CD-HIT (Fu et al. 2012) to remove highly similar sequences. To access pairs of similar sequences between compared data sets, Best Blast Mutual Hits (BBMH) analyses were computed with BLASTN and an e-value of 1e-10. Venn diagrams were created with jvenn (Bardou et al. 2014).
Functional Annotations
Contigs from the different assemblies were blasted as follows: firstly, they were compared to the Swissprot database. Queries with no hit were compared to the TrEMBL database. Then, queries with no hit against the TrEMBL database were compared to the NR database, and sequences still having no hit were compared against the NT database. We considered hits with an e-value of 1e-5 and only the best five hits were kept.
Sequences were translated using prot4EST (Wasmuth & Blaxter 2004). We provided it with the outputs of the proteic BLAST (against Swissprot, TrEMBL and NR).
Accepted
Article
The BLAST output files were loaded into Blast2GO (Gotz et al. 2008) to perform Gene Ontology (GO) annotation and GO terms enrichment analysis. We used the three GO ontologies: molecular function, biological process, and cellular component. We categorized the enriched GO terms with CateGOrizer (Hu et al. 2008) using the GO_slim2 classification method and single occurrences count.
Results and Discussion
Validation of the assembly protocol
The performance of the different computational methods available for transcript reconstruction from RNA-Seq data depends on various criteria, including: the type of organism to be assembled; the preference given to either sensitivity or precision of the predictions; and the type of analysis to be performed with the reconstructed contigs (Steijger et al. 2013). Here, the criterion was to maximize production of accurately predicted gene sets that can be commonly found in the transcriptomes of different individuals of a species for intra-species analyses (e.g. SNP detection, population genomics). We followed the overall strategy of Cahais et al. (2012) because their protocol focused on optimizing the reconstruction of unambiguous correct cDNAs for comparative and population genomics purposes. We refined this assembly protocol by re-evaluating the utility of combining the assemblers Abyss (Simpson et al. 2009) and Cap3 (Huang & Madan 1999). We assessed and compared the quality of de novo Illumina short-read assemblies using data from two crops for which an annotated reference genome is available, grapevine (Vitis vinifera subsp. vinifera) (Jaillon et al. 2007) and sorghum (Sorghum bicolor subsp. bicolor) (Paterson et al. 2009) (see Comparison of assembly protocols in Materials and Methods). We chose these two species because they presented contrasting characteristics (e.g.: eudicot vs monocot,
Accepted
Article
highly heterozygote outcrosser vs mainly homozygote selfer, GC-poor vs GC-rich), which allowed testing whether our protocol could be efficient for a wide genome
diversity. Especially, highly heterozygote genomes, such as grapevine, should be more challenging than highly homozygote ones, and it is important to know whether
protocols should be adapted or not to the expected heterozygosity level. Cahais et al. (2012) used reads from multiple individuals to increase the number of assembled contigs as some genes can be lowly or not expressed in some individuals. However, to evaluate the trade-off between maximizing the number of transcripts that can be assembled and optimizing the quality of the assembly by minimizing the complexity of the pool of reads to be assembled, we also compared assembly protocols using reads from multiple accessions or genotypes from the same species (All Individuals) versus protocols using reads from only one individual (One Individual) (Table 2). For the One Individual assembly, we chose the individual with the largest number of reads e.g. EC4 for Sorghum bicolor and VC2 for Vitis vinifera.
Quantitative assessment of the assemblies
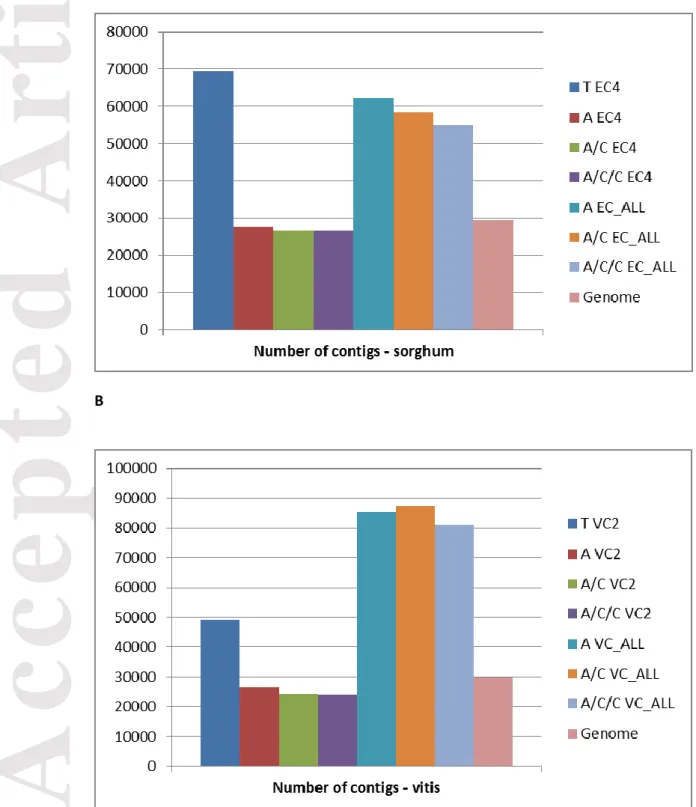
For Sorghum bicolor, the number of transcripts predicted from the genome sequence (29,448), was equivalent to the number of contigs produced by the assembly with Abyss One Individual EC4 (27,733), and equivalent to Abyss One Individual EC4 combined with one or two steps of assembly with Cap3 (26,686 and 26,591
respectively). Using reads from all the individuals and an assembly with Abyss (A), Abyss/Cap3 (A/C), or Abyss/Cap3/Cap3 (A/C/C), the number of contigs roughly doubled (62,341, 58,441 and 54,974 respectively). With Trinity EC4, the number of contigs tended towards 70,000 contigs (Figure 1A).
For Vitis vinifera, we confirmed that the number of transcripts predicted from the
genomic sequence, Genome (29,971), was close to the number of contigs produced by the assembly with Abyss One Individual VC2 (26,685) and Abyss One Individual VC2
Accepted
Article
combined with one or two steps of assembly with Cap3 (24,315 and 24,015
respectively). With Trinity VC2, the number of contigs roughly doubled (48,934). Using all the individuals and Abyss, Abyss/Cap3, and Abyss/Cap3/Cap3 the number of contigs increased 3-4 fold (85,420, 87,125, and 80,982 respectively) (Figure 1B). For both Sorghum bicolor and Vitis vinifera, the N50 and the mean contig length were higher and closer to those predicted from the genomic sequence (Genome) with all the combinations using one individual (EC4 and VC2) compared to the combinations using all the individuals (Figures 1C and 1D). No significant difference in N50 and mean contig length was detected between assembly with Trinity and the different
combinations with Abyss using one individual (Figures 1C and 1D).
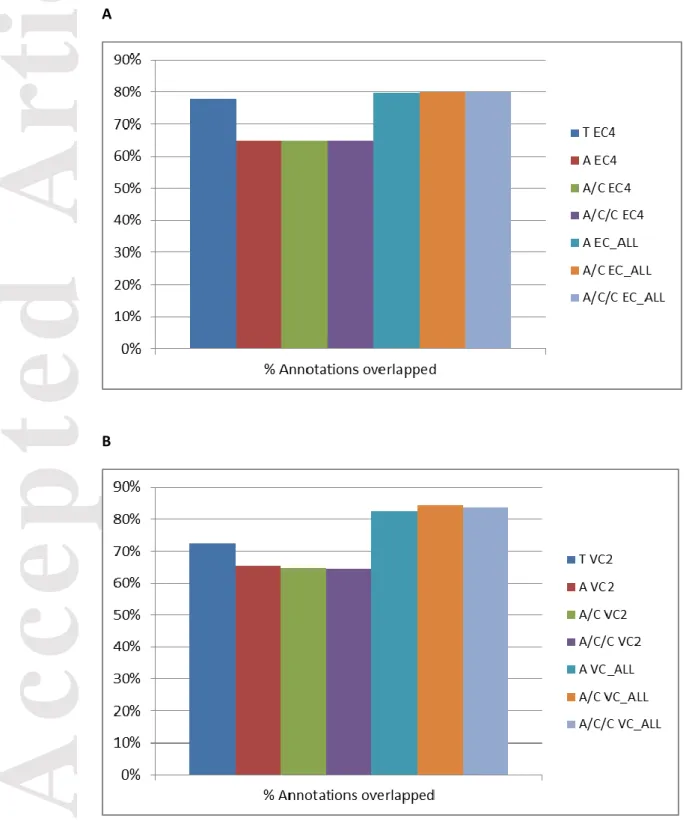
The percentage of contigs mapped on the genome was around 80-90% for Sorghum bicolor and 90-100% for Vitis vinifera (Figure S1). The percentage of predicted genes from the genome sequences mapped by the contigs was about 60% for the One Individual assemblies, and about 70-80% for the assemblies using Trinity and for the All Individuals assemblies (Figures 2A and 2B).
Representativeness of the assemblies
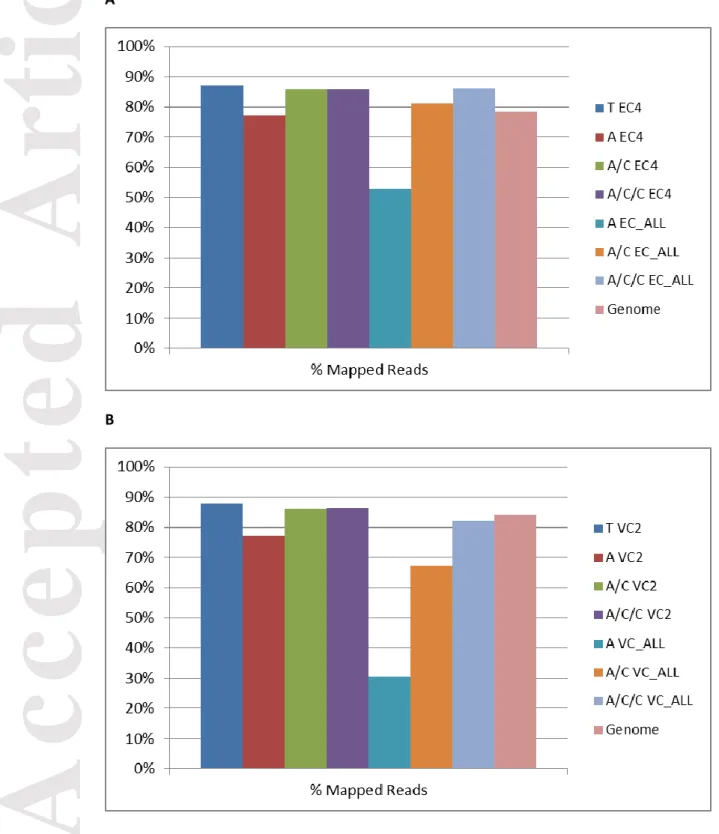
For Sorghum bicolor, 85-90% of the total reads from 10 individuals mapped to the assemblies built with Trinity, A/C EC4, A/C/C EC4, and A/C/C EC_All (Figure 3A). This percentage slightly decreased with A EC4 (77%), A/C EC_All (81%), and substantially decreased with A EC_All (53%).
For Vitis vinifera, 85-90% of the total reads from 12 individuals mapped to the assembly built with Trinity, A/C VC2, and A/C/C VC2 (Figure 3B). This percentage slightly decreased with A VC2 (77%), A/C VC_All (67%), A/C/C VC_All (82%), and substantially decreased with A VC_All (30%).
For both Sorghum bicolor and Vitis vinifera, a higher percentage of mapped reads was obtained when the One Individual assembly (produced using either Trinity, A/C or
Accepted
Article
A/C/C) was used as reference compared to mapping carried out against CDS transcript sequences predicted from the genome sequence (Figures 3).
The percentage of reads mapped or correctly mapped to the built transcriptome were quite similar, depending on the different individuals. Indeed, we observed less than an 11% difference between individuals for both Sorghum bicolor and Vitis vinifera (Table S1).
For Sorghum bicolor, around 40% of the contigs from the A, A/C and A/C/C One Individual EC4 assemblies were mapped at an average coverage of 8X by reads from the 10 individuals. This percentage decreased notably for the Trinity (15%), A EC_All (23%), A/C EC_All (26%) and A/C/C EC_All (25%) assemblies. For Vitis vinifera, around 66-67% of the contigs from the A, A/C and A/C/C One Individual VC2 assemblies were mapped at an average coverage of 8X by reads from the 12
individuals. This percentage decreased notably for the Trinity (38%), A VC_All (26%), A/C VC_All (37%) and A/C/C VC_All (39%) assemblies (Table S2).
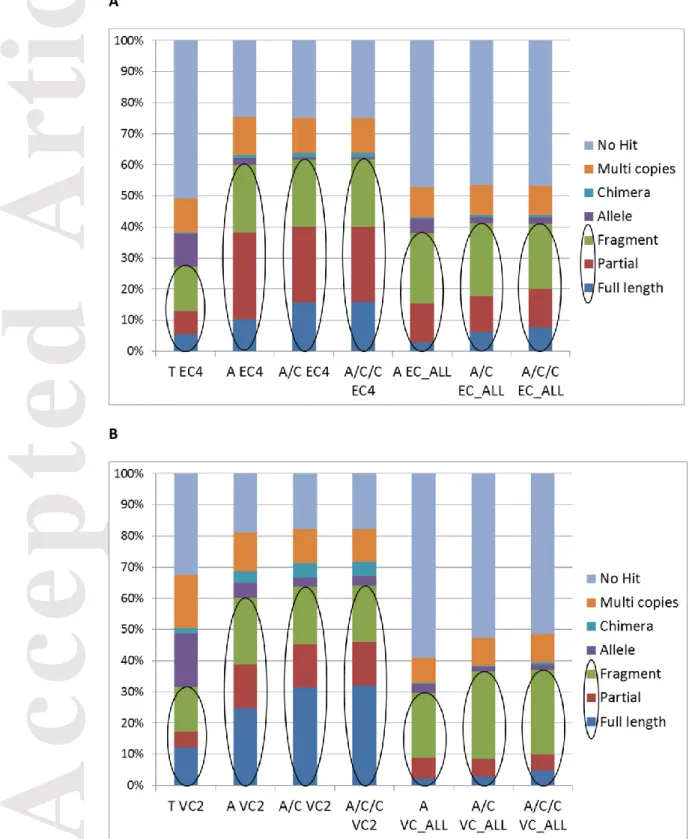
Categorization of the predicted contigs
We applied the categorization of contigs used in Cahais et al. (2012) in order to define the assembly protocol minimizing the probability of having erroneous predictions such as chimeras, unassembled alleles and assembled paralogues, which would mislead gene orthology prediction and SNP detection. This categorization was based on the number and the nature of significant BLAST hits of the contigs against a transcriptome predicted from the reference genome annotation (see Classification of BLAST results in Materials and Methods).
The ratio of non-problematic contigs (Full length+Partial+Fragment) was highest with A/C and A/C/C One Individual (>60% for Sorghum bicolor and Vitis vinifera). A/C/C One Individual gave similar results to A/C One Individual: 62 % of non-problematic contigs for A/C EC4 and A/C/C EC4, 64% for A/C VC2 and A/C/C VC2. We slightly
Accepted
Article
improved the percentage of non-problematic contigs by combining Abyss with Cap3 compared to Abyss alone with 60% for A EC4 and A VC2. The percentage of non-problematic contigs decreased for Trinity and All Individuals: 27% for T EC4 and 32% for T VC2, 38% for A EC_ALL and 30% for A VC_ALL, 41% for A/C EC_ALL and A/C/C EC_ALL, 37% for A/C VC_ALL and A/C/C VC_ALL (Figures 4A and 4B). With Trinity’s assembly using reads from all individuals, we confirmed that the percentage of non-problematic contigs substantially decreased (7% for Sorghum bicolor and 4 % for Vitis vinifera) (Table S3). To assess the impact of isoforms on our classification of contigs, we filtered out isoforms predicted by the Butterfly module of Trinity. From each group of predicted isoforms, we kept the longest one and then we recalculated the classification of contigs. We found that the percentage of non-problematic contigs is still low for Trinity after filtering isoforms: for Sorghum bicolor All Individuals and One individual (15% and 24% respectively), and for Vitis vinifera All Individuals and One individual (12% and 28 % respectively) (Table S4).
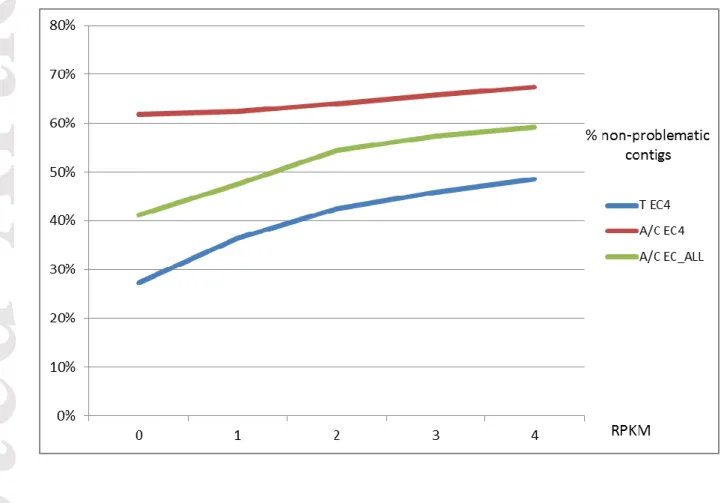
We checked whether filters on RPKM could change our results. We compared the percentage of non-problematic contigs for the T EC4, A/C EC4 and A/C EC_ALL assemblies using different filters on RPKM. The A/C EC4 assembly always gave the best score of non-problematic contigs with values greater than 60% (Figure 5).
Conclusions of the assemblies’ comparison and choice of the optimal
transcriptome assembly strategy
We found that the N50 and mean length of assemblies were higher and closer to those predicted from the genome sequence with all the One Individual combinations
compared to the All Individuals combinations (Figures 1C and 1D). The percentage of reads from all the individuals that were mapped or correctly mapped to the One Individual assemblies was greater than the percentage of reads mapped to the All
Accepted
Article
Individuals contigs (Figures 3). It is worth noting that the One Individual assemblies produced transcriptome references that were representative of all the sequenced individuals, probably due to fewer erroneous contigs.
We also found that the One Individual assemblies produced by Abyss combined with one step of Cap3 gave the best ratio of non-problematic contigs (Figures 4). We checked that applying filters on read depth of coverage did not notably affect the evaluation results (Figure 5). Lastly, our conclusion was that the optimal protocol was Abyss combined with one step of Cap3, using reads from only one sequenced
individual. This protocol led to 95% (Sorghum bicolor) and 97% (Vitis vinifera) of the contigs being mapped on the corresponding reference genome sequence. We favoured this protocol because our aim was to provide reference transcriptomes that could be useful for further comparative and population genomic analyses, even at the expense of transcriptome exhaustivity. It is also interesting that the same protocol performed the best (according to our criteria) for the two tested genomes despite their contrasting characteristics, especially their different heterozygosity level. This is also another advantage to have a protocol robust to change in genome characteristics. Nevertheless, for other purposes a more exhaustive and detailed representation of the transcriptome might be preferred. In such cases, the Trinity protocol appears to be more suitable, especially for highly heterozygous species.
Assembly of 26 new transcriptomes
We assembled 26 new transcriptomes of cultivated plants and close relative species (listed in Table 1) using the Abyss-Cap3-One Individual protocol. The N50, mean contig length, and percentages of aligned and annotated contigs (Table 3) were comparable to those of other recently published transcriptomes (Bhardwaj et al. 2013; Kudapa et al. 2014; Munoz-Merida et al. 2013; Zhang et al. 2013). Using our assembly
Accepted
Article
protocol, contig numbers ranged from 19,811 in Herrania nitida (a relative of cocoa) to 59,792 in Phillyrea angustifolia (a relative of olive tree) (average = 32,755).
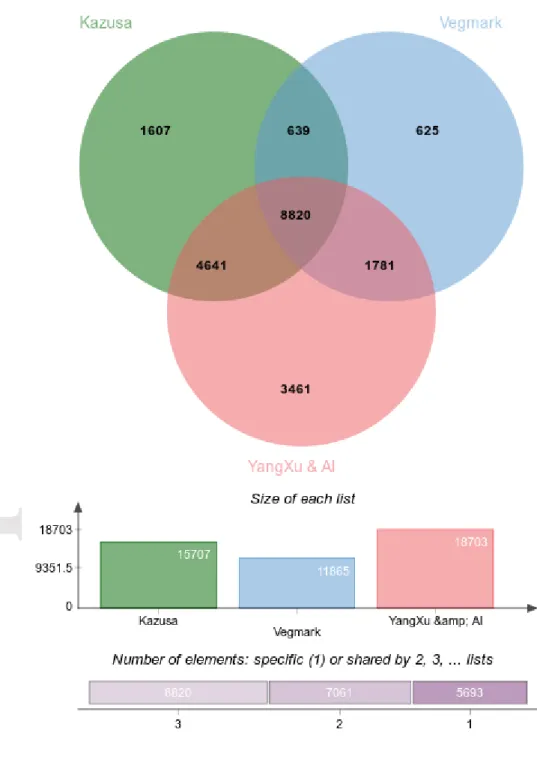
Some of our new assemblies (eggplant, pepper, oil palm, olive tree) already have corresponding reference genomes or transcriptomes published. As an example of comparison, we assessed overlaps (see BBMH comparison of transcriptomes in Materials and Methods) between our eggplant assembly and three types of available data sources: the transcripts predicted from the eggplant draft genome SME_r2.5.1 (Hirakawa et al. 2014), a previously published transcriptome assembly from RNA-Seq (Yang et al. 2014), and with a unigene set produced by cDNA sequencing (Vegmark) (Fukuoka et al. 2010). We found that around 81% (21,574 for a total of 26,752 non redundant sequences) of our eggplant contigs have Best Blast Mutual Hit (BBMH) to at least one of the queried data sources. A core of 8,820 sequences (33%) were
commonly found in the three data sets (Figure 6). The published eggplant RNA-Seq assembly (YanXu & al) showed more BBMH (18,703) compared to the transcripts predicted from the draft genome SME_r2.5.1 (15,707) and to the unigene set (11,865). This is probably correlated to a more complete view of the transcriptome provided by RNA-Seq.
Functional annotations
The contigs of the 26 reference transcriptomes were annotated using BLAST, prot4EST (Wasmuth & Blaxter 2004), and Blast2GO (Gotz et al. 2008). The 26 transcriptomes had more than 60% of the contigs having BLAST hits, and 24 transcriptomes had more than 70% of aligned contigs. For 21 transcriptomes, more than 50% of the contigs had a BLAST hit against the high quality manually curated annotations of the Swiss-Prot database. In addition, 25 transcriptomes had more than 40% of the contigs annotated with Gene Ontology terms (Table 2).
Accepted
Article
As an example of biological insights that may be provided by our resource, we assessed GO term enrichment in the group of nine transcriptomes of the Poaceae family (Triticum monococcum, Eremopyrum bonaepartis, Taeniatherum
caput-medusae, Sorghum brachypodum, Sorghum bicolor, Pennisetum glaucum, Pennisetum polystachion, Pennisetum alopecuroides, and Digitaria exilis), using the Fisher's Exact Test function implemented in Blast2GO (Gotz et al. 2008). Each transcriptome of the Poaceae group was compared to all other transcriptomes of the group. We filtered with a FDR (False Discovery Rate) value of 0.05. The transcriptome of Sorghum bicolor showed a large number of over-represented terms (8,761) with a slight
overrepresentation of terms associated with metabolism (14%) (Figure S2). The transcriptome of Sorghum brachypodum showed a smaller number of GO terms over-represented (35) (Table S5) with a clear overrepresentation of terms associated with metabolism and binding (Figure 7). The other Poaceae transcriptomes have no more than 5 over-represented GO terms. Note that in this simple analysis “fragment” contigs count twice (or more) for a GO category. This simple analysis could thus be affected by the different species having different proportions of contigs categories. A more detailed analysis of the corresponding contigs and related annotations might lead to new
insights into the evolution and/or expression of some specific gene families in Sorghum brachypodum compared to other Poaceae species.
For the 26 new transcriptomes, all the sequences (FASTA format) and annotations (GFF3 format), together with BLAST, prot4EST, and Blast2GO results are freely available at http://arcad-bioinformatics.southgreen.fr/. These transcriptomes and their annotations represent a significant resource for large scale analyses of relationships between the evolution, diversity and function of gene families.
Accepted
Article
Acknowledgements
This study was conducted in the framework of ARCAD (http://www.arcad-project.org), a project funded by Agropolis Fondation under the reference ID ARCAD 0900-001. GS, FH, and SP salaries were supported by ARCAD budget. SC was supported by INRA (Division of Plant Biology and Breeding). The main partner for the sequencing was the Montpellier Genomix regional platform monitored by the CNRS
(http://www.mgx.cnrs.fr). We thank Gaëtan Droc for help in setting up the Arcad Bioinformatics Portal. Computational resources were provided by the South Green bioinformatics platform. We thank Dr. Guillaume Besnard and Dr. Pierre Saumitou-Laprade for providing us genetic material of the olive tree out-groups. For yam material and logistics we gratefully acknowledge AfricaRice, Cotonou, and The University of Parakou, Parakou (Benin). We also thank Sally Norton from the Australian Tropical Crops and Forages Collection (QDPI) who provided us with seeds of S. brachypodum. For palm material, RNA extraction and logistics we gratefully acknowledge INRAB Pobè (Benin), PalmElit SAS, H. Adam, J.C. Pintaud, S. Jouannic (IRD), F. Richaud, D. Cros (Cirad) and I. Scotti (INRA). We thank CRC (Cocoa Research Centre) for
providing us with some genetic material (leaves and buds) from T. cacao relatives. We thank Vanuatu Agricultural Research and Technical Centre (VARTC) and Centre de Ressources Biologiques (CRB) for providing us with Dioscorea outgroups. We also thank the institutions that maintain plant/seed collections from which our plant materials originate (listed in the Table1). The technical help of Céline Cardi and Olivier Fouet is acknowledged. We are grateful to Peter Biggins for help in English editing.
References
Bardou P, Mariette J, Escudie F, Djemiel C, Klopp C (2014) jvenn: an interactive Venn diagram viewer. BMC Bioinformatics 15, 293.
Accepted
Article
Bhardwaj J, Chauhan R, Swarnkar MK, et al. (2013) Comprehensive transcriptomic study on horse gram (Macrotyloma uniflorum): De novo assembly, functional characterization and comparative analysis in relation to drought stress. BMC Genomics 14, 647. Cahais V, Gayral P, Tsagkogeorga G, et al. (2012) Reference-free transcriptome assembly in
non-model animals from next-generation sequencing data. In: Mol Ecol Resour, pp. 834-845.
Ellegren H (2014) Genome sequencing and population genomics in non-model organisms. Trends Ecol Evol 29, 51-63.
Fu L, Niu B, Zhu Z, Wu S, Li W (2012) CD-HIT: accelerated for clustering the next-generation sequencing data. Bioinformatics 28, 3150-3152.
Fukuoka H, Yamaguchi H, Nunome T, et al. (2010) Accumulation, functional annotation, and comparative analysis of expressed sequence tags in eggplant (Solanum melongena L.), the third pole of the genus Solanum species after tomato and potato. Gene 450, 76-84. Glemin S, Bataillon T (2009) A comparative view of the evolution of grasses under
domestication. New Phytol 183, 273-290.
Gotz S, Garcia-Gomez JM, Terol J, et al. (2008) High-throughput functional annotation and data mining with the Blast2GO suite. Nucleic Acids Res 36, 3420-3435.
Haas BJ, Papanicolaou A, Yassour M, et al. (2013) De novo transcript sequence reconstruction from RNA-seq using the Trinity platform for reference generation and analysis. Nat Protoc 8, 1494-1512.
Hirakawa H, Shirasawa K, Miyatake K, et al. (2014) Draft genome sequence of eggplant (Solanum melongena L.): the representative solanum species indigenous to the old world. DNA Res 21, 649-660.
Huang X, Madan A (1999) CAP3: A DNA sequence assembly program. Genome Res 9, 868-877. Hufford MB, Xu X, van Heerwaarden J, et al. (2012) Comparative population genomics of maize
domestication and improvement. Nat Genet 44, 808-811.
Jaillon O, Aury JM, Noel B, et al. (2007) The grapevine genome sequence suggests ancestral hexaploidization in major angiosperm phyla. Nature 449, 463-467.
Kim S, Park M, Yeom SI, et al. (2014) Genome sequence of the hot pepper provides insights into the evolution of pungency in Capsicum species. Nat Genet 46, 270-278. Kudapa H, Azam S, Sharpe AG, et al. (2014) Comprehensive Transcriptome Assembly of
Chickpea (Cicer arietinum L.) Using Sanger and Next Generation Sequencing Platforms: Development and Applications. PLoS One 9, e86039.
Li H, Durbin R (2009) Fast and accurate short read alignment with Burrows-Wheeler transform. Bioinformatics 25, 1754-1760.
Martin M (2011) Cutadapt removes adapter sequences from high-throughput sequencing reads. EMBnet.journal 17, 10-12.
Meyer RS, DuVal AE, Jensen HR (2012) Patterns and processes in crop domestication: an historical review and quantitative analysis of 203 global food crops. New Phytol 196, 29-48.
Morcillo F, Gagneur C, Adam H, et al. (2006) Somaclonal variation in micropropagated oil palm. Characterization of two novel genes with enhanced expression in epigenetically abnormal cell lines and in response to auxin. Tree Physiol 26, 585-594.
Munoz-Merida A, Gonzalez-Plaza JJ, Canada A, et al. (2013) De novo assembly and functional annotation of the olive (Olea europaea) transcriptome. DNA Res 20, 93-108.
Paterson AH, Bowers JE, Bruggmann R, et al. (2009) The Sorghum bicolor genome and the diversification of grasses. Nature 457, 551-556.
Qin C, Yu C, Shen Y, et al. (2014) Whole-genome sequencing of cultivated and wild peppers provides insights into Capsicum domestication and specialization. Proc Natl Acad Sci U S A 111, 5135-5140.
Accepted
Article
Quinlan AR, Hall IM (2010) BEDTools: a flexible suite of utilities for comparing genomic features. Bioinformatics 26, 841-842.
Ross-Ibarra J, Morrell PL, Gaut BS (2007) Plant domestication, a unique opportunity to identify the genetic basis of adaptation. Proc Natl Acad Sci U S A 104 Suppl 1, 8641-8648. Simpson JT, Wong K, Jackman SD, et al. (2009) ABySS: a parallel assembler for short read
sequence data. Genome Res 19, 1117-1123.
Slater GS, Birney E (2005) Automated generation of heuristics for biological sequence comparison. BMC Bioinformatics 6, 31.
Steijger T, Abril JF, Engstrom PG, et al. (2013) Assessment of transcript reconstruction methods for RNA-seq. Nat Methods.
Vitti JJ, Grossman SR, Sabeti PC (2013) Detecting natural selection in genomic data. Annu Rev Genet 47, 97-120.
Wasmuth JD, Blaxter ML (2004) prot4EST: translating expressed sequence tags from neglected genomes. BMC Bioinformatics 5, 187.
Yang X, Cheng YF, Deng C, et al. (2014) Comparative transcriptome analysis of eggplant (Solanum melongena L.) and turkey berry (Solanum torvum Sw.): phylogenomics and disease resistance analysis. BMC Genomics 15, 412.
Zhang J, Ruhlman TA, Mower JP, Jansen RK (2013) Comparative analyses of two Geraniaceae transcriptomes using next-generation sequencing. BMC Plant Biol 13, 228.
Data Accessibility
Raw data were deposited in the NCBI Sequence Read Archive (SRA) under BioProject PRJNA326055.
Sequences assemblies (FASTA), annotations (GFF, Blast XML, Blast2GO .annot, FASTA prot4EST translations): http://arcad-bioinformatics.southgreen.fr.
Scripts used for the analyses: https://github.com/SouthGreenPlatform/arcad-hts.
Author Contributions
Sylvain Glémin, Jacques David, Gautier Sarah and Manuel Ruiz designed research. Gautier Sarah, Felix Homa, Stéphanie Pointet, Sandy Contreras, François Sabot and Benoit Nabholz developed scripts and performed bioinformatic analyses. Sylvain Glémin, Gautier Sarah and Manuel Ruiz wrote the paper. Sylvain Santoni, François Sabot, Laure Sauné, Morgane Ardisson, Nathalie Chantret, Christopher Sauvage, James Tregear, Cyril Jourda, David Pot, Yves Vigouroux, Hana Chair, Nora Scarcelli,
Accepted
Article
Claire Billot, Nabila Yahiaoui, Roberto Bacilieri, Bouchaib Khadari, Michel Boccara, Adéline Barnaud, Jean-Pierre Péros, Jean-Pierre Labouisse and Jean-Louis Pham were involved in one or more processes of samples selection and collection, RNA extraction and Illumina library production, data analysis and manuscript preparation.
Figure legends
Figure 1. Number of contigs, N50 and mean contig length obtained by the different
assembly protocols. The number of contigs increases with Trinity alone and All
Individuals (A. Sorghum bicolor, B. Vitis vinifera), the N50 and mean length decreased with All Individuals (C. Sorghum bicolor, D. Vitis vinifera).
T, Trinity; A, Abyss; C, Cap3; Genome, transcripts predicted from the genome
sequence; EC4, one individual Sorghum bicolor EC4; VC2,one individual Vitis vinifera VC2; EC_ALL, 10 individuals Sorghum bicolor; VC_ALL, 12 individuals Vitis vinifera.
Figure 2. Percentage of predicted genes mapped by the contigs obtained by the
different assembly protocols. The percentage of predicted genes from the Sorghum bicolor and Vitis vinifera genome sequences that showed an overlap with the contigs was about 60% for One Individual, and 70-80% for Trinity alone and All Individuals: (A) Sorghum bicolor and (B) Vitis vinifera.
T, Trinity; A, Abyss; C, Cap3; EC4, one individual Sorghum bicolor EC4; VC2,one individual Vitis vinifera VC2; EC_ALL, 10 individuals Sorghum bicolor; VC_ALL, 12 individuals Vitis vinifera.
Accepted
Article
Figure 3. Percentage of the total reads mapped to the assemblies built with the
different protocols. The assemblies with One Individual were the most representative of all the individuals: (A) Sorghum bicolor and (B) Vitis vinifera.
T, Trinity; A, Abyss; C, Cap3; Genome, transcripts predicted from the genome
sequence; EC4, one individual Sorghum bicolor EC4; VC2,one individual Vitis vinifera VC2; EC_ALL, 10 individuals Sorghum bicolor; VC_ALL, 12 individuals Vitis vinifera.
Figure 4. Ratio of non-problematic contigs obtained by the different assembly
protocols. The ratio of non-problematic predicted contigs (Full
length+Partial+Fragment) was better with AC and ACC One Individual: (A) Sorghum bicolor and (B) Vitis vinifera.
T, Trinity; A, Abyss; C, Cap3; EC4, one individual Sorghum bicolor EC4; VC2,one individual Vitis vinifera VC2; EC_ALL, 10 individuals Sorghum bicolor; VC_ALL, 12 individuals Vitis vinifera.
Figure 5. Effect of RPKM filters on the ratio of non-problematic predicted contigs. The
transcriptome assembly using Abyss with one step of Cap3 (A/C) and reads from the EC4 Sorghum bicolor individual (A/C EC4) maintained the best ratio of non-problematic predicted contigs (% of contigs from the categories Full length+Partial+Fragment) using different filters on RPKM : 0,1,2,3,4 (Reads per Kilobase per Million Reads).
T, Trinity; A, Abyss; C, Cap3; EC4, one individual Sorghum bicolor EC4; EC_ALL, 10 individuals Sorghum bicolor.
Figure 6. Number of Best Blast Mutual Hits of our eggplant assembly with transcripts
predicted from the draft genome SME_r2.5.1 (Kazusa), with a previously published transcriptome assembly from RNA-Seq (YanXu & al), and with a unigene set
Accepted
Article
showing the list size (number of BBMH) and intersection size repartition are located underneath the diagram.
Figure 7. Main GO categories of the over-represented GO terms for Sorghum brachypodum contigs compared to other transcriptomes of the Poaceae family. The reference transcriptomes used for the Poaceae family were Triticum monococcum, Eremopyrum bonaepartis, Taeniatherum caput-medusae, Pennisetum glaucum, Pennisetum polystachion, Pennisetum alopecuroides, Digitaria exilis, Sorghum bicolor.
Accepted
Article
Table 1. Summary of sequenced individuals of cultivated plants and close relative species
Family Taxon Crop
nam e Life span Matin g syste m Number of chromo somes Close relati ve crop Accessi on Germplasm source Sources of RNA3 Arecace ae Elaeis guineen sis Oil palm Pere nnial Alloga my 2n=32 LM1829 3-Eg02a INRAB, Centre de Recherches Agricoles Plantes Pérennes, Station Pobè, Bénin 80% infloresc ence, 20% leaves Mauriti a flexuosa Pere nnial Alloga my 2n=30 Oil palm Wild individu al (male), nr. Kourou, French Guiana Field collection, French Guiana 80% infloresc ence, 20% leaves Dioscore aceae Dioscore a rotunda ta Yam Annu al Alloga my 2n=40 CR4885 IRD Montpellier, France 80% infloresc ence, 20% leaves Dioscore a alata Annu al Alloga my 2n=40 Yam CIRAD collection, Guadeloupe , French West Indies 80% infloresc ence, 20% leaves Dioscore a trifida Annu al Alloga my 2n=40 Yam CRB-PT (Centre des Ressources Biologiques_ Plantes Tropicales), Guadeloupe , French West Indies 80% infloresc ence, 20% leaves Fabacea e Medica go sativa Alfalf a Pere nnial Alloga my 2n = 4x = 32 Gongno nd INRA collection Biological Ressources Center Medicago Montpellier 80% infloresc ence, 20% leaves Medica go Pere nnial Alloga my 2n = 16 Alfalf a "carnon " INRA collection 80% infloresc
Accepted
Article
marina Biological Ressources Center Medicago Montpellier ence, 20% leaves Malvace ae Herrani a nitida Pere nnial Unkno wn2n=20 Cocoa C4X6Y9 Internationa l Cocoa Genebank, Trinidad UWI Campus St Augustine Trinidad and Tobago 80% infloresc ence, 20% leaves Theobro ma speciosa Caca ui Pere nnial Unkno wn
2n=20 Cocoa Bord6B Internationa l Cocoa Genebank, Trinidad UCRS Centeno Trinidad and Tobago 80% infloresc ence, 20% leaves Musace ae Musa balbisia na Pere nnial Alloga my 2n = 22 Banan a 'Pisang Klutuk Wulung' (PT-BA-00302) CIRAD collection Guadeloupe , CRB Plantes tropicales 65% infloresc ence, 15% leaves, 20% fruits Musa beccarii Pere nnial Alloga my 2n = 20 Banan a Musa beccarii (PT-BA-00221) CIRAD collection Guadeloupe , CRB Plantes tropicales 65% infloresc ence, 15% leaves, 20% fruits Oleacea e Olea europae a subsp. europae a Olive tree Pere nnial Alloga my 2n = 46 Arbequi na (M3-29) INRA collection (UE DiaScope, Montpellier) 80% infloresc ence, 20% leaves Olea europae a subsp. cuspidat a Pere nnial Alloga my 2n = 46 Olive tree Graham Stawn n° 3 CEFE collection (CNRS, Montpellier) 80% infloresc ence, 20% leaves Phillyrea angustif olia Pere nnial Alloga my 2n = 46 Olive tree CEFE collection (CNRS, Montpellier) 80% infloresc ence, 20% leaves Poaceae Triticum monoco ccum Eink orn whe Annu al Autog amy 2n = 14 ID 259 Max Planck Institut für Züchtungsfo 80% infloresc ence,
Accepted
Article
at rschung, Köln, Germany 20% leaves Eremop yrum bonaep artis Annu al Autog amy 2n = 14 Einko rn wheat PI20344 2 National Small Grain Collection, Aberdeen, Idaho, USA 65% infloresc ence, 15% leaves, 20% grains Taeniat herum caput-medusa e Annu al Autog amy 2n =14 Einko rn wheat PI57770 8 National Small Grain Collection, Aberdeen, Idaho, USA 65% infloresc ence, 15% leaves, 20% grains Sorghu m brachyp odum Annu al Autog amy1 2n=102 Sorgh um JC2125 Australian Tropical Crops and Forages Collection (QDPI) 65% infloresc ence, 15% leaves, 20% grains Penniset um glaucum Pearl mille t Annu al Alloga my 2n=14 PE0803 8 IRD Montpellier, France 65% infloresc ence, 15% leaves, 20% grains Penniset um polystac hion Annu al Alloga my 2n=18 Pearl millet O914 IRD Montpellier, France 80% infloresc ence, 20% leaves Penniset um alopecu roides Annu al Alloga my 2n=18 Pearl millet A1 IRD Montpellier, France 80% infloresc ence, 20% leaves Digitari a exilis Foni o Annu al Autog amy 2n=36 CM 07892 IRD Montpellier, France 80% infloresc ence, 20% leaves Solanace ae Solanu m melong ena Eggp lant Annu al Autog amy 2n=24 Toma to MM738 (Netherl ands) INRA GAFL, France 80% infloresc ence, 20% leaves Capsicu m annuum Pepp er Annu al Autog amy 2n=24 Toma to PM659 (North West INRA, GAFL, France 65% infloresc ence,Accepted
Article
India – Punjab) 15% leaves, 20% fruits Vitaceae Vitis romanet ii Pere nnial Alloga my 2n=38 Grape vine 8065Mt p2 INRA - Domaine de Vassal, France4 65% infloresc ence, 15% leaves, 20% fruits Vitis riparia Pere nnial Alloga my 2n=38 Grape vine 9006Mt p1 INRA - Domaine de Vassal, France4 80% infloresc ence, 20% leaves 1There is no clear information regarding the reproductive behaviour of this species. It is quite likely that it is autogamous but with a significant proportion of allogamy (even some cultivated and wild sorghum display significant proportions of allogamy, up to 20% in some cases for cultivated sorghum)
2
Cultivated sorghum is 2n=20
3
Leave means young leave, fruit means immature fruit, and grain means immature grain
4
The grape biological materials were provided by the Center for Grape Genetic Resources, at the INRA “Domain de Vassal”, Marseillan Plage, France:
Accepted
Article
Table 2. Summary of the sequenced individuals in sorghum (Sorghum bicolor
subsp. bicolor) and grapevine (Vitis vinifera subsp.vinifera)
Sorghum bicolor subsp. bicolor Vitis vinifera subsp. vinifera
Study code Accession1 Study code Accession2 EC1 SSM1049 VC1 Lameiro (0Mtp636)
EC2 IS29876 VC2 Morenoa (0Mtp739)
EC3 IS30436 VC3 Verdelho tinto (0Mtp1176)
EC4 SSM1123 VC4 Clairette blanche (26Mtp2)
EC5 IS6193 VC5 Mondeuse blanche (176Mtp1)
EC6 SSM973 VC6 Savagnin 77 (Savagnin blanc)
(257Mtp16)
EC7 IS14317 VC7 Katta kourgan (556Mtp2)
EC8 IS29407 VC8 Chasselas 3 (585Mtp62)
EC9 Tigne de Dangalma (SSM1057) VC9 Zinfandel (Primitivo) (1277Mtp6)
EC10 IS26554 VC10 Araklinos (1805Mtp1)
VC11 Tita caprei (Tsitsa Kaprei) (2471Mtp1)
VC12 Labrusco noir (2953Mtp1)
12The sorghum biological materials were provided by the the CIRAD, Laboratoire de Semences
et de Ressources Génétiques, France: LSRG, http://golo.cirad.fr
2The grape biological materials were provided by the Center for Grape Genetic Resources, at
the INRA “Domain de Vassal”, Marseillan Plage, France:
Accepted
Article
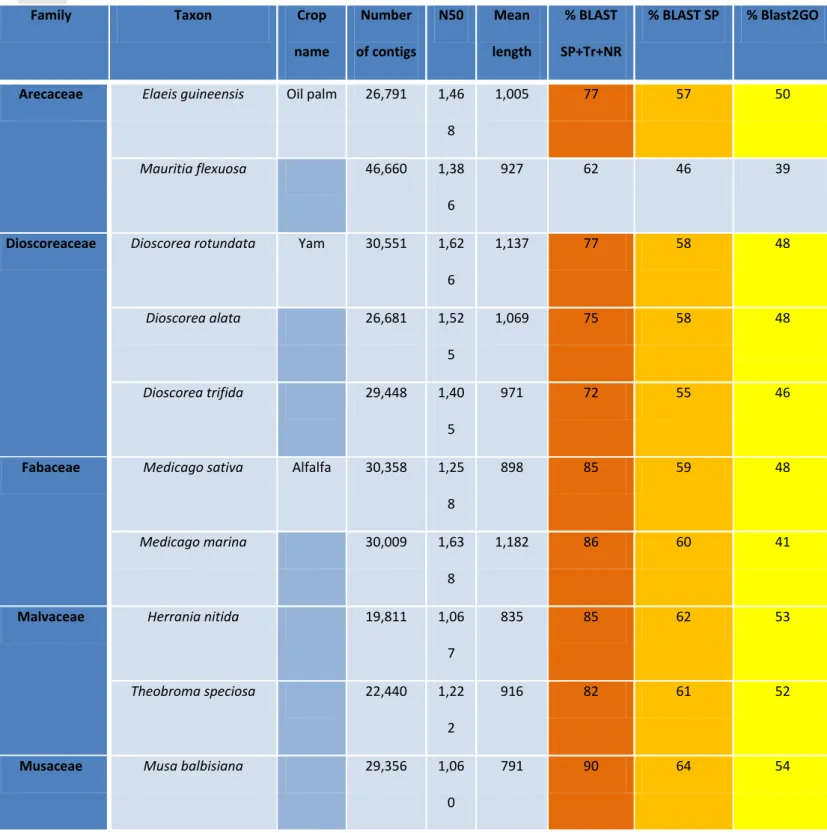
Table 3. Summary of the assemblies and annotations
% contigs with BLAST SP+Tr+NR > 70%, % contigs with BLAST SP > 50%, % contigs with blast2GO > 40%
Family Taxon Crop
name Number of contigs N50 Mean length % BLAST SP+Tr+NR % BLAST SP % Blast2GO
Arecaceae Elaeis guineensis Oil palm 26,791 1,46
8
1,005 77 57 50
Mauritia flexuosa 46,660 1,38
6
927 62 46 39
Dioscoreaceae Dioscorea rotundata Yam 30,551 1,62
6 1,137 77 58 48 Dioscorea alata 26,681 1,52 5 1,069 75 58 48 Dioscorea trifida 29,448 1,40 5 971 72 55 46
Fabaceae Medicago sativa Alfalfa 30,358 1,25
8
898 85 59 48
Medicago marina 30,009 1,63
8
1,182 86 60 41
Malvaceae Herrania nitida 19,811 1,06
7
835 85 62 53
Theobroma speciosa 22,440 1,22
2
916 82 61 52
Musaceae Musa balbisiana 29,356 1,06
0
Accepted
Article
Musa beccarii 50,365 1,20
3
848 76 53 44
Oleaceae Olea europaea subsp.
europaea
Olive tree
45,389 1 094 794 78 57 46
Olea europaea subsp. cuspidata 37,870 1,39 0 980 82 61 49 Phillyrea angustifolia 59,792 1,02 4 781 71 54 43
Poaceae Triticum monococcum Einkorn
wheat 33,381 1,49 2 1,027 67 46 42 Eremopyrum bonaepartis 34,255 1,40 6 974 70 47 43 Taeniatherum caput-medusae 32,786 1,45 0 993 73 50 45 Sorghum brachypodum 25,814 995 749 84 56 54
Pennisetum glaucum Pearl
millet 24,618 1,42 2 1,021 82 58 53 Pennisetum polystachion 37,117 1,33 2 940 73 49 44 Pennisetum alopecuroides 34,073 1,44 2 1,001 70 48 43
Digitaria exilis Fonio 37,326 1,31
8
932 76 51 48
Solanaceae Solanum melongena Eggplant 26,807 1,64
9
1,162 85 62 49
Accepted
Article
7
Vitaceae Vitis romanetii 30,326 1,76
7
1,239 80 57 49
Vitis riparia 30,572 1,72
9
Accepted
Article
Figure 1. Number of contigs, N50 and mean contig length obtained by the different
assembly protocols. The number of contigs increases with Trinity alone and All
Individuals (A. Sorghum bicolor, B. Vitis vinifera), the N50 and mean length decreased with All Individuals (C. Sorghum bicolor, D. Vitis vinifera).
T, Trinity; A, Abyss; C, Cap3; Genome, transcripts predicted from the genome
sequence; EC4, one individual Sorghum bicolor EC4; VC2,one individual Vitis vinifera VC2; EC_ALL, 10 individuals Sorghum bicolor; VC_ALL, 12 individuals Vitis vinifera.
A
Accepted
Article
C
Accepted
Article
Figure 2. Percentage of predicted genes mapped by the contigs obtained by the
different assembly protocols. The percentage of predicted genes from the Sorghum bicolor and Vitis vinifera genome sequences that showed an overlap with the contigs was about 60% for One Individual, and 70-80% for Trinity alone and All Individuals: (A) Sorghum bicolor and (B) Vitis vinifera.
T, Trinity; A, Abyss; C, Cap3; EC4, one individual Sorghum bicolor EC4; VC2,one individual Vitis vinifera VC2; EC_ALL, 10 individuals Sorghum bicolor; VC_ALL, 12 individuals Vitis vinifera.
A
Accepted
Article
Figure 3. Percentage of the total reads mapped to the assemblies built with the
different protocols. The assemblies with One Individual were the most representative of all the individuals: (A) Sorghum bicolor and (B) Vitis vinifera.
T, Trinity; A, Abyss; C, Cap3; Genome, transcripts predicted from the genome
sequence; EC4, one individual Sorghum bicolor EC4; VC2,one individual Vitis vinifera VC2; EC_ALL, 10 individuals Sorghum bicolor; VC_ALL, 12 individuals Vitis vinifera.
A
Accepted
Article
Figure 4. Ratio of non-problematic contigs obtained by the different assembly
protocols. The ratio of non-problematic predicted contigs (Full
length+Partial+Fragment) was better with AC and ACC One Individual: (A) Sorghum bicolor and (B) Vitis vinifera.
T, Trinity; A, Abyss; C, Cap3; EC4, one individual Sorghum bicolor EC4; VC2,one individual Vitis vinifera VC2; EC_ALL, 10 individuals Sorghum bicolor; VC_ALL, 12 individuals Vitis vinifera.
A
Accepted
Article
Figure 5. Effect of RPKM filters on the ratio of non-problematic predicted contigs. The
transcriptome assembly using Abyss with one step of Cap3 (A/C) and reads from the EC4 Sorghum bicolor individual (A/C EC4) maintained the best ratio of non-problematic predicted contigs (% of contigs from the categories Full length+Partial+Fragment) using different filters on RPKM : 0,1,2,3,4 (Reads per Kilobase per Million Reads).
T, Trinity; A, Abyss; C, Cap3; EC4, one individual Sorghum bicolor EC4; EC_ALL, 10 individuals Sorghum bicolor.
Accepted
Article
Figure 6. Number of Best Blast Mutual Hits of our eggplant assembly with transcripts
predicted from the draft genome SME_r2.5.1 (Kazusa), with a previously published transcriptome assembly from RNA-Seq (YanXu & al), and with a unigene set
(Vegmark). The Venn diagram displays overlaps between the three data sets. Charts showing the list size (number of BBMH) and intersection size repartition are located underneath the diagram.
Accepted
Article
Figure 7. Main GO categories of the over-represented GO terms for Sorghum brachypodum contigs compared to other transcriptomes of the Poaceae family. The reference transcriptomes used for the Poaceae family were Triticum monococcum, Eremopyrum bonaepartis, Taeniatherum caput-medusae, Pennisetum glaucum, Pennisetum polystachion, Pennisetum alopecuroides, Digitaria exilis, and Sorghum bicolor.