HAL Id: hal-02472262
https://hal-amu.archives-ouvertes.fr/hal-02472262
Submitted on 10 Feb 2020HAL is a multi-disciplinary open access archive for the deposit and dissemination of sci-entific research documents, whether they are pub-lished or not. The documents may come from teaching and research institutions in France or abroad, or from public or private research centers.
L’archive ouverte pluridisciplinaire HAL, est destinée au dépôt et à la diffusion de documents scientifiques de niveau recherche, publiés ou non, émanant des établissements d’enseignement et de recherche français ou étrangers, des laboratoires publics ou privés.
Proximate causes and fitness consequences of double
brooding in female barn owls
Jabi Zabala, Xavier Lambin, Julien Soufflot, Philibert Soufflot, Delphine
Chenesseau, Alexandre Millon
To cite this version:
Jabi Zabala, Xavier Lambin, Julien Soufflot, Philibert Soufflot, Delphine Chenesseau, et al.. Proximate causes and fitness consequences of double brooding in female barn owls. Oecologia, Springer Verlag, 2020, 192 (1), pp.91-103. �10.1007/s00442-019-04557-z�. �hal-02472262�
Proximate causes and fitness consequences of double brooding in
1
female barn owls
2
Authors1: Jabi Zabala1, Xavier Lambin1, Julien Soufflot2, Philibert Soufflot2, Delphine 3
Chenesseau2 & Alexandre Millon3* 4
5
6
1
School of Biological Sciences, University of Aberdeen, Aberdeen AB24 2TZ, UK 7
2
Ferme des Grands Parts, 51290 Outines, France 8
3
Aix Marseille Univ, Univ Avignon, CNRS, IRD, IMBE, Institut Méditerranéen Biodiversité 9
& Ecologie, Marseille, Aix-en-Provence, France 10
11
Address for correspondence: Alexandre Millon, email address: [email protected] 12
13
Keywords: Lifetime reproductive success, Reproductive tactics, Recruits, individual
14
heterogeneity, Brood type. 15
Running title: Double brooding in barn owl
16
For consideration in Oecologia
17
18
1
Author contributions – JS, PS and DC designed the field protocols and collected the data, and corrected and amended successive draft versions. JZ, XL, JS and AM designed the study, JZ performed most analyses and wrote the first draft, and XL and AM provided guidance, supervised analyses, and extensively contributed to the redaction of the MS.
Abstract 19
Multiple brooding, reproducing twice or more per year, is an important component of life-20
history strategies. However, what proximate factors drive the frequency of multiple brooding 21
and its fitness consequences for parents and offspring remains poorly known. Using long-term 22
longitudinal data, we investigated double brooding in a barn owl population in France. We 23
assessed the effects of both extrinsic and intrinsic factors and the consequences of double 24
brooding on fledgling recruitment and female lifetime reproductive success. The occurrence 25
of double brooding in the population, ranging from 0 to 87%, was positively related to the 26
number of rodent prey stored at the nest. Females laying early in the season were more likely 27
to breed twice and the probability of double brooding increased with smaller initial brood 28
size, female age and the storage of wood mice at the nest early in the season. Fledglings from 29
first broods recruited more often (8.2%) than those from single broods (3.8%) or second 30
broods (3.3%) but this was primarily the consequence of laying dates, not brood type per se. 31
Females producing two broods within a year, at least once in their lifetime, had higher 32
lifetime reproductive success and produced more local recruits than females that did not (15.6 33
± 8.1 vs. 6.1 ± 3.8 fledglings, 0.96 ± 1.2 vs. 0.24 ± 0.6 recruits). Our results suggests that the 34
benefits of double brooding exceed costs in terms of fitness, and that within-year variability in 35
double brooding is related to heterogeneity in individual/territory quality. 36
37
38
Introduction 40
In order to maximize their fitness, individuals adopt alternative strategies for optimising the 41
number of offspring that survive until reproduction. In seasonal environments where breeding 42
occurs only during a restricted period of the year, individuals might nonetheless attempt to re-43
initiate reproduction following a first successful breeding event in the same year (Husby et al. 44
2009). Multiple brooding is a relatively common strategy in vertebrates with fast life histories, 45
such as small mammals and passerine birds (Erb et al. 2001; Lambin and Yoccoz 2001; 46
Béziers and Roulin 2016). Producing multiple broods is often a facultative strategy and its 47
frequency varies greatly among populations, but also among years within a given population 48
(Husby et al. 2009; Béziers and Roulin 2016; Jackson and Cresswell 2017). Such a variation 49
offers the opportunity to investigate the proximate factors underpinning the alternative 50
strategies and quantify their relative fitness. 51
Double brooding (i.e. producing a second brood after successfully completing one) is 52
expected to be a rewarding strategy in terms of number of offspring produced annually. 53
Individuals breeding twice in a year can expect producing almost twice as many offspring as 54
individuals breeding only once, such as documented in barn owl Tyto alba (Béziers and 55
Roulin 2016), Tengmalm’s owl Aegolius funereus (Korpimäki et al. 2011), hoopoe Upupa 56
epops (Hoffmann et al. 2015), or black-throated blue warbler Setophaga caerulescens (Nagy
57
and Holmes 2005a). However, over an individual’s lifetime, attempting double brooding may 58
be associated with costs that could cancel out the benefits of short-term increased breeding 59
success. Documented costs include reduced survival of multiple-brooding females (Verhulst 60
1998) and reduced body condition of fledglings from first broods due to maternal desertion 61
for the purpose of initiating a second brood (Béziers and Roulin 2016). Recruitment 62
probabilities of fledglings from females producing two or more broods could also be lowered 63
compared to fledglings from a single brood but this has been rarely assessed (but see 64
Hoffmann et al. 2015). Altogether, these costs may reduce fitness gains for parents producing 65
two broods in a year (Verhulst et al. 1997; Eldegard and Sonerud 2009; Husby et al. 2009). In 66
a seasonal environment, the extent of the period during which resources are sufficiently 67
abundant to allow individuals to reproduce is a key factor determining the frequency of 68
multiple brooding. Indeed, the date of the onset of breeding has been repeatedly shown to 69
alter breeding success, with later-breeding individuals having reduced breeding success (e.g. 70
Verhulst and Nilsson 2008). This temporal decline in breeding success can be mainly 71
attributed to 1) the date itself, i.e. the deterioration of the environment over the season, 2) the 72
fact that late breeders are of poorer quality, or 3) the fact that late breeders are constrained to 73
occupy low-quality territories. The date hypothesis has received most empirical support so far 74
(Verboven and Verhulst 1996; Verhulst and Nilsson 2008; Pärt et al. 2017), although several 75
processes may act together (Browne et al. 2007; Husby et al. 2009; Hoffmann et al. 2015). 76
The timing of breeding is also relevant for multiple brooding, with early breeders being more 77
likely to produce more than one brood per season (Béziers and Roulin 2016). 78
Variable availability of food resources has been shown to influence the frequency of 79
multiple brooding. In some cases, a relatively constant percentage of individuals produce two 80
broods each year, such as in the hoopoe (although different populations show different 81
average frequencies; Martín-Vivaldi et al. 1999, Hoffmann et al. 2015). In others cases, the 82
percentage of individuals double brooding can vary from zero to >80% in populations subject 83
to pulsed resources, such as in the black-throated blue warbler Dendroica caerulescens (Nagy 84
and Holmes 2005a) or the barn owl (Jackson and Cresswell 2017). Overall, how individual 85
characteristics, the trade-offs between reproduction and survival (both intra- and inter-86
generation) and environmental conditions interact to determine the probability of double 87
brooding remains poorly understood. Long-term longitudinal data offer the opportunity to i) 88
investigate the factors associated with the occurrence of multiple brooding and ii) measure the 89
consequences of double brooding for parents and offspring, which may shed light on the 90
evolution and maintenance of multiple brooding. 91
Here we used 17 years of longitudinal data collected in a barn owl population of Burgundy 92
(north-eastern France) to analyse both proximate factors and fitness consequences of double 93
brooding. The barn owl is one of the few non-tropical raptors showing frequent double 94
brooding (Baudvin 1986; Béziers and Roulin 2016). First, we measured the extent of among-95
year variation in the frequency of double brooding at the population level and assessed 96
whether such variation was related to extrinsic factors such as food storage and climatic 97
conditions. Second, we investigated whether those extrinsic factors interacted with intrinsic 98
factors (laying date, brood size) to drive a female to breed twice in a year. Then, we compared 99
recruitment probabilities between fledglings originating from any of the three brood types 100
(single, first and second) to test whether brood type per se affected recruitment in addition to 101
laying date. Lastly, we assessed whether lifetime reproductive success (estimated as either the 102
number of fledglings or local recruits) of female barn owls having produced two broods in a 103
year at least once over their lifetime was higher than that of females that have not. 104
105
Methods 106
Study species, zones & data collection
107
The barn owl is a medium-sized (ca. 240-350 g) nocturnal raptor whose breeding populations 108
in the western Palearctic are mostly composed of resident individuals. Clutches contain 4-8 109
eggs (up to 13) and females can raise two broods a year, exceptionally three (Mikkola 1983). 110
Between 1998 and 2006, we monitored an average of 280 nesting-sites annually, including 111
175 nest-boxes and 105 alternative nest-sites in buildings, in six neighbouring zones primarily 112
across Burgundy and, to a lesser extent, Champagne (north-eastern France), over an 113
approximated total area of 1675 km2. We installed more nest-boxes in 2006, resulting in a 114
total of 370 nesting-sites (295 nest-boxes and 75 alternative nesting sites) monitored annually, 115
with 2-4 visits per site. The first visit in March-April ascertained occupancy. We made 116
subsequent visits to sites where occupancy was suspected or recorded to assess clutch size and 117
ring nestlings just before fledging (May-July). We attempted to capture adults during all site 118
visits by placing a landing net at the entrance of the nest-boxes. We marked nestlings and 119
unmarked adults with alphanumeric aluminium bands (CRBPO - Museum National d'Histoire 120
Naturelle, Paris). We weighed chicks using a spring scale (Pesola © 500 g). We used nestling 121
age and weight to estimate nestling body condition (expressed as the deviation from predicted 122
body mass according to age and days since estimated hatching date in each year). We 123
revisited later in the season all sites deemed unoccupied on the first visit to detect second 124
clutches or late breeding attempts. The proportion of the barn owl population breeding in 125
monitored nesting-sites was unknown. 126
We defined laying date as the Julian week when the first egg was laid (week 1 = 1st week 127
of January), either deduced from the number of eggs when the clutch was observed before 128
completion (assuming each egg was laid 2.5 days apart) or using back-calculation from chick 129
wing length (following Taylor 1993 for age estimation and assuming 32 days of incubation; 130
Bunn et al. 1982). On average we ringed nestlings when they were 38 ± 12 days of age. To 131
account for inter-annual variation in laying dates while comparing data over multiple years, 132
we centred laying dates to the average laying date recorded in each year and used relative 133
laying dates for the analyses. To characterise how clutches are distributed within a year, we 134
estimated the average laying date for each year using all the clutches detected, including 135
replacement clutches (N = 93) and those not assigned to any category (their characteristics 136
suggested replacement broods but we could not ascertain that [N = 69]). We assigned 137
breeding birds to two age classes (yearling vs. ≥2 years, hereafter called adult) based on 138
ringing, for birds ringed as chicks, or according to the moulting pattern otherwise (Taylor 139
1993). 140
We classified broods into four categories: (1) First broods were those laid by females 141
caught on a brood and recaptured on another brood in the same year, either in the same 142
nesting-site or in a different one; (2) Second broods included those raised by a female that had 143
been previously captured on a different brood in the same year. Broods for which the female 144
was not captured on a first breeding attempt but for which the laying date matched with 145
identified second broods were also assigned as second broods based on the bimodal 146
distribution observed in laying dates (Fig. 5, Fig. S1). In some rare cases, females captured 147
during early incubation but late in the season showed distinctive marks of previous breeding 148
in the same year (general aspect of the brood patch indicating a previous incubation in the 149
same year); (3) Replacement broods were those raised by females that had been previously 150
found breeding in the same year but failed in that breeding attempt; (4) Single broods included 151
all broods that did not fall in one of the three aforementioned categories. We may have 152
erroneously assigned some broods as singles in cases where subsequent reproduction of the 153
female went unnoticed, which in turn would underestimate the ratio of double brooding. We 154
also might have assigned some late single brood as seconds. We interpreted results with this 155
uncertainty in mind, particularly those involving fitness differences between single and 156
double brood females. Moreover for analyses that could be sensitive to mistaken assignment 157
of brood type, we replicated the analyses using only data of females caught twice in the same 158
year. We discarded from analyses the replacement clutches, as they were not genuine second 159
broods, as well as clutches that could not be effectively assigned to any category based on the 160
available information. 161
Proxies of prey abundance and weather conditions
Barn owls typically prey on small mammals in Europe, primarily on microtine voles Microtus 163
spp. and wood mouse Apodemus spp. (Mikkola 1983; Chausson et al. 2014; Pavluvčík et al.
164
2015), species that show high among-year variation in abundance. Surplus prey are 165
commonly stored at the nest (Taylor 2004), and we used the number of prey stored, recorded 166
during visits dedicated to chick ringing, as a proxy for prey abundance in the environment. 167
We therefore inspected nesting-sites and identified any prey items stored. We focused on 168
microtine voles (M. arvalis/agrestis) and wood mice (A. sylvaticus/flavicollis) which together 169
represent 86% of the prey items recorded (54% and 32% respectively, N = 1961, hereafter 170
Microtus and Apodemus). Visual inspection of prey was too cursory to reliably distinguish
171
Microtus arvalis from M. agrestis and Apodemus sylvaticus from A. flavicollis. However,
172
prey identification from pellet analysis revealed that M. arvalis was by far the most common 173
species preyed upon by barn owls in the study area (N = 9792 prey between 2004 and 2014; 174
JS, PS & DC unpublished data), making up 44% of prey items. M. agrestis represented only 175
7% of the Microtus prey. Regarding wood mice, A. sylvaticus was a slightly more common 176
prey than A. flavicollis (58 vs. 42%, N = 770 identified wood mice) and wood mice altogether 177
made 14% of prey items found in pellets. Other prey items found at nest included Arvicola 178
terrestris (7%), and Rattus norvegicus, Glis glis, Myodes glareolus and Crocidura spp.
179
accounting for <1% each. We investigated the temporal variation in the occurrence of both 180
Microtus and Apodemus, by modelling the arithmetic mean number of prey items stored
181
against Julian date, and found that the peak of Apodemus stored at nest occurred earlier during 182
the breeding season compared to the Microtus peak (Fig.1). We therefore defined five 183
different measures of prey abundance based on the mean number of prey stored at nest: 1- 184
total prey (Microtus + Apodemus over the whole season), 2- Microtus over the whole season, 185
3- Microtus at mid-season, 4- Apodemus over the whole season and 5- Apodemus in early 186
season (Fig. 1). 187
Barn owl populations in Western Europe are sensitive to winter weather conditions 188
(Altwegg et al. 2003). In Switzerland, winter harshness explained 17 and 49% of the inter-189
annual variation in juvenile and adult survival respectively, with extremely severe winters 190
causing population crashes (Altwegg et al. 2006). In addition, fledglings may be sensitive to 191
weather conditions, particularly at the end of parental care. We used the North Atlantic 192
Oscillation index (NAO) as a proxy for climatic conditions. This index often better explains 193
variation in ecological processes than covariates such as monthly temperature or precipitation 194
(Hallett et al. 2004). We computed NAO index over two distinct periods: 1) winter 195
(December to February, wNAO) and 2) during the month following the end of parental care 196
(post-fledging NAO, NAOPF), typically in June-August (from May to September). We
197
calculated NAOPF for each brood specifically according to its laying date. We determined the
198
month of independence for each brood by adding 15 weeks to the estimated laying date (Bunn 199
et al. 1982). In Burgundy, both summer and winter NAO indices negatively correlate with 200
precipitation, whereas the correlations with temperature are close to zero (Bladé et al. 2012). 201
202
Analytical and statistical procedures
203
First, we evaluated whether the ratio of double broods at the population level was affected by 204
extrinsic factors such as the mean number of prey stored at nest and weather conditions during 205
the previous winter (wNAO). We ran generalised linear models (GLM) for proportion data, 206
using a quasi-binomial distribution of error to account for over-dispersion observed in the 207
data, fitted with no more than two explanatory variables at a time to account for the limited 208
number of years available (N = 17). 209
Second, at the individual level, we investigated the probability that a female produced a 210
second brood according to the influence of both intrinsic (relative laying date, brood size, 211
female age [yearling vs. adult]) and extrinsic factors (wNAO, prey stored at nest [presence or 212
not of Microtus stored at nest, and presence or not of Apodemus stored at nest]). To identify 213
the factors underpinning among-female variability in the number of broods raised within a 214
same year, we considered a dataset restricted to conditions under which double brooding was 215
recorded. Specifically, we only considered (1) broods from years in which the number of 216
second broods represented >5% of the number of first+single broods. Next, (2) to control for 217
changes in environmental conditions along the season, we discarded clutches laid later than 218
the latest first clutch recorded in the study area (May, 5th). Therefore, the restricted data set 219
only included clutches from years when double brooding was common and laid within the 220
range of dates in which we observed first clutches in these years, in order to ensure we detect 221
only relevant factors associated with double-brooding. We fitted generalised linear mixed 222
models (GLMM) to predict the likelihood of a female producing one or two broods using a 223
binomial distribution of error. We tested female identity, years, zones and female identity 224
nested within zones for the random structure. 225
Third, we evaluated the following individual characteristics as predictors of fledgling 226
recruitment probability: brood type (single, first, second), relative laying date and its quadratic 227
term to account for possible penalties for very early broods, rank (nestling order within 228
brood), chick body condition at ringing and brood size. In addition, we included extrinsic 229
factors related to environmental conditions experienced in the birth year: ratio of second 230
broods in the whole study area, arithmetic mean number of prey stored at the nest (Microtus, 231
Apodemus, Microtus + Apodemus), and the two NAO indices. To prevent bias in recruitment
232
rate estimates due to the possible influence of laying date, brood type or population density in 233
offspring dispersal (Altwegg et al. 2003; Huffeldt et al. 2012), prior to analyses we assessed 234
the correlation of post-natal dispersal distance (log transformed) with relative laying date 235
(linear and quadratic), brood type and number of nest-boxes occupied (as a proxy of 236
population size). Fledglings born during the last two years of the study were removed from 237
the analysis as the average age at first breeding was 1.75 yr (± 1.22 SD; median age = 1 yr). 238
We fitted GLMMs using a binomial distribution of error and female identity, years and zones 239
were tested for the random structure. 240
Fourth, we calculated female lifetime reproductive success as the total number of 241
fledglings (lifetime fledgling production, LFP), and total number of offspring recruited in the 242
study area (LRP). We discarded females breeding before 1998 or still breeding in any of the 243
last two years of the study as their LFP and LRP estimates could be incomplete, as well as 244
breeders undetected in more than 33% of their known breeding lifespan (i.e. undetected in 245
more than one year, assuming skipping reproduction for 2 years or more is unlikely given 246
demographic parameters estimated from our data [mean breeding lifespan= 1.51 ± 1.04; see 247
also Bunn et al. 1982]). To assess possible negative effects of double breeding on female 248
survival, we compared next year return probabilities of single/double brooding females using 249
binomial GLMMs with female identity and zone as random factor. Female fidelity to breeding 250
sites among years is high (Mikkola 1983), yet to preclude biases in LFP and LRP estimates 251
we assessed the influence of single/double brooding and annual number of breeding events 252
detected (divided by the number of nesting sites monitored to account for changes in 253
monitoring effort) on post-breeding dispersal (Altwegg et al. 2003). We assessed the 254
influence of breeding lifespan (number of years from the first to the last breeding event 255
recorded) and the number of years with ≥5% of double broods experienced by each female, 256
the latter measuring environmental conditions experienced by females during their lifespan. 257
We fitted GLMs using a negative binomial distribution of error. 258
Finally, we investigated intergenerational effects by assessing whether female recruits 259
originating from different brood types showed differences in brood size during their first 260
breeding event and in lifetime reproductive success based on fledglings (data on recruits in 261
this case were too sparse to derive LRP but note that LFP was positively related to LRP; β = 262
0.113 ± 0.008, P < 0.001, N = 771, R2 = 0.237, Poisson GLM). We used centred brood sizes 263
as response variable, to control for among year variation in productivity, and fitted GLMMs 264
with Gaussian distribution of error with year and zones tested for the random structure. We 265
analysed variation in LFP or LRP using GLMs with a negative binomial distribution of error. 266
We ran statistical analyses in R 3.2.4 (R Development Core Team 2016) using the libraries 267
lme4 (Bates et al. 2015) and nlme (Pinheiro et al. 2016). We performed model selection for
268
the fixed effects according to a stepwise procedure by deleting variables with the highest p-269
values, from the most complete model, until we achieved no reduction in AICc (Akaike 270
Information criterion adjusted for small sample size; Burnham and Anderson 2002). When 271
dealing with the ratio of double broods at the population level, we handled over-dispersion in 272
the data using a quasi-binomial distribution of error, thus precluding the calculation of AICc. 273
In this case, we took extra care when interpreting the results as sample size was low (N = 17 274
years) and only highly significant relationships were considered (P < 0.001; Crawley 2007). 275
To select the best random effect model structure, we ran models with alternative random 276
structures fitting the fixed-effect component with all covariates and selected the best one 277
based on AICc (Zuur et al. 2009). We scaled explanatory covariates before analysis (except 278
categorical ones) to compare their relative strength. We obtained the proportion of deviance 279
explained by a model (R2) using the piecewiseSEM package (Lefcheck 2015), which 280
implements the approach developed by Nakagawa and Schielzeth (2013) to estimate R2 for 281
GLMs and GLMMs. Marginal R² describes the proportion of variance explained by the fixed 282
factor component of the model alone, while conditional R² indicates the total variance 283
explained by both the fixed and random components of the model together. We report both R2 284
when appropriate. We present descriptive statistics as arithmetic mean ± 1 SD and modelled 285
effect size (β) as mean ± 1 SE. 286
287
Results 288
Variation in the occurrence of double brooding at population and individual levels
289
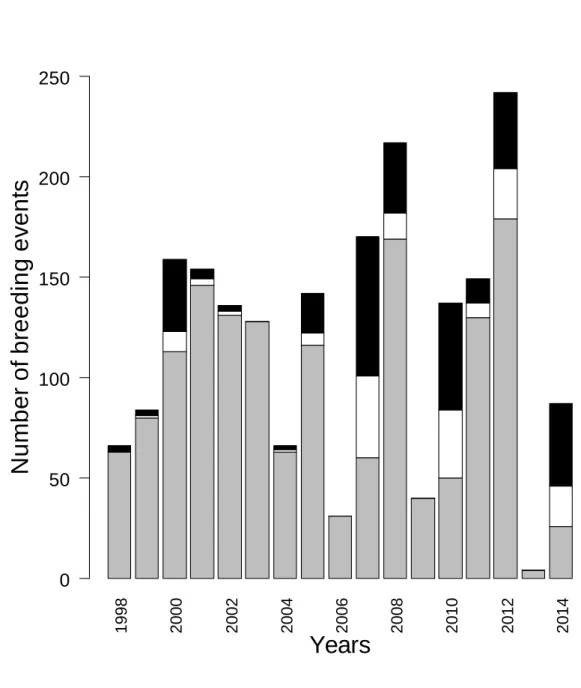
Between 1998 and 2014, we recorded 2187 breeding events, among which 2012 were 290
classified as single (N = 1529), first (N = 163) or second broods (N = 320). Annual number of 291
breeding events greatly varied from year-to-year (mean = 124 ± 69, from 261 in 2012 down to 292
4 in 2013). The ratio of double broods (number of second broods /number of single and first 293
broods) varied annually from zero (in four years) to 87% (in 2014; mean = 18 ± 26%, Fig. 2). 294
The interval between the initiation of first and second broods was on average 98 ± 14 days 295
(range: 55-134, N = 134 instances with females identified on first and second broods). 296
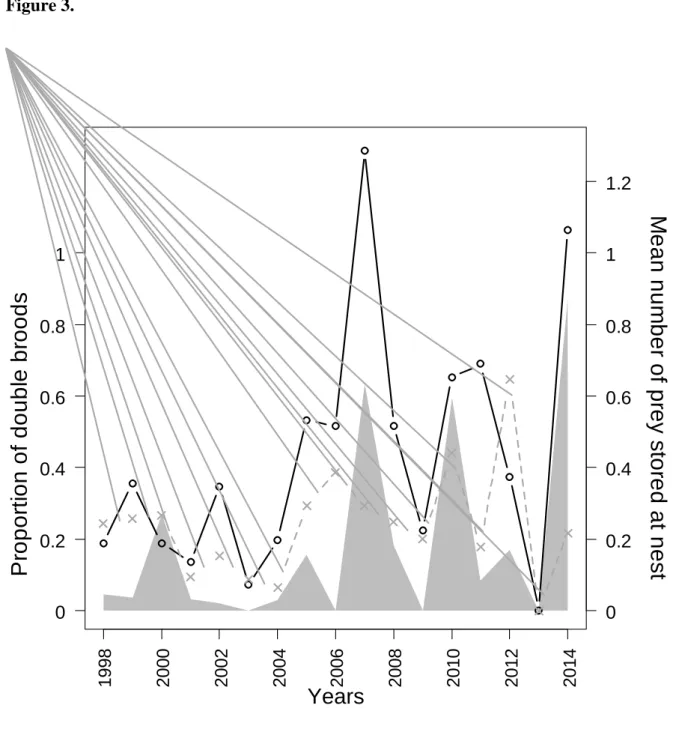
Weather conditions in the preceding winter (wNAO) were unrelated to the ratio of double 297
broods. In contrast, several measures of prey stored at nest (annual arithmetic mean of 298
number of prey items stored at nest: Microtus [β = 2.69 ± 0.62, P < 0.001], Microtus mid-299
season [β = 1.17 ± 0.24, P < 0.001], Microtus mid-season + Apodemus early-season [βMicrotus
300
= 1.21 ± 0.09, P <0.001, βApodemus= 0.92 ± 0.20, P <0.001], N = 17 in all cases) positively
301
correlated with the ratio of double broods (Fig. 3). However, annual ratio of double broods 302
did not correlate with numbers of Microtus stored at nest early in the season (βMicrotus = 0.82 ±
303
0.74, P = 0.28). Similar correlations were obtained when using only second broods for which 304
females were captured twice (Microtus mid-season + Apodemus early-season [βMicrotus = 1.17
305
± 0.20, P < 0.001; βApodemus= 1.27 ± 0.52, P = 0.03]).
306
At the individual level, early breeding females were more likely to breed twice (Table 1, 307
Fig. 4). Females who produced larger broods had a reduced probability of double brooding as 308
well as yearling females. Regarding extrinsic factors, the occurrence of Apodemus 309
(presence/absence) stored at nest was associated with a slightly higher probability of double 310
brooding, while the presence of Microtus early in the season did not (Binomial GLMM; β = 311
0.15 ± 0.29, P = 0.61). Controlling for laying date and brood size (fixed at their average 312
value), the probability of double brooding for a yearling female increased from 0.127 to 0.191 313
if it had at least one Apodemus stored in her first nest, while the same probabilities for an 314
adult female increased from 0.198 to 0.285, respectively. Note that these two effects were 315
only marginally significant (P < 0.1; Table 1). All the results are based on models including 316
only year as random factor (including female identity did not improve models). 317
Fledgling recruitment probability
318
Out of 8157 offspring that fledged over the 17 years of study, 326, including males and 319
female offspring (159 females, 162 males and 5 undetermined), were recruited in the study 320
area (4 %). Fifty three of 644 (8.2%) fledglings from first broods recruited, compared to 233 321
of 6210 (3.8%) and 40 out of 1203 (3.3%) from single and second broods, respectively. 322
Overall, fledglings from early broods in years with higher mean number of prey stored at nest 323
and favourable weather conditions post-fledging were more likely to recruit. Brood type per 324
se did not affect recruitment probability (βsingle = -0.000 ± 0.190, P = 0.99: βsecond = 0.702 ±
325
0.427, P = 0.10). However, as first broods were laid earlier, fledglings from first broods had 326
higher recruitment probabilities as a consequence of earlier relative laying date (Fig. 5). While 327
controlling for all the other covariates, by keeping them at their average value, the model 328
predicted that offspring from clutches laid on the average laying date had a recruitment 329
probability of 0.036 (± 0.016), while those from clutches laid 20 days before/after the average 330
had recruitments probability of 0.043 (± 0.019) and 0.027 (± 0.012), respectively. Post-natal 331
dispersal of recruits (10.8 ± 8.8 km, range: 0.49-52.6, N = 208) is unlikely to bias LFP and 332
LRP calculation as it was not related to relative laying date (linear: β = 0.014 ± 0.054, P = 333
0.79, N = 208; quadratic β1 = 0.020 ± 0.056, P = 0.724, β2 = -0.028 ± 0.069, P = 0.69, N =
334
208), brood type (difference in dispersal of offspring from single and second broods 335
compared to offspring from first broods: βsingle = 0.087 ± 0.138, P = 0.53, βsecond = 0.062 ±
336
0.184, P = 0.74, N = 208) or annual number of nest-boxes occupied (β = -0.041 ± 0.066, P = 337
0.54, N = 208). Post-natal but not post-breeding dispersal of barn owl has been reported to 338
associate with coloration (van den Brink et al. 2012). We did not account for coloration and 339
that could influence our LRP estimates, yet post-natal dispersal distances in our study were 340
similar to these reported by van den Brink et al. (2012; 10.8 and 9.6 ± 0.6 km respectively) 341
suggesting we were able to detect recruits of both color morphs. In addition, as post-natal 342
dispersal distance was not correlated with laying date or brood type, it does not seem probable 343
that putative differences on dispersal associated to color are correlated with brood type and 344
influencing our results. 345
Regarding the other intrinsic factors, owls from large broods had a reduced recruitment 346
probability, whereas rank and chick body condition had no effect. For extrinsic factors, 347
weather conditions experienced during the first months of life had a positive effect on 348
recruitment, with a stronger effect of NAOPF compared to wNAO. This indicates that survival
349
of juvenile barn owls was favoured by comparatively drier weather conditions in the month of 350
independence, typically between June and August, and during the following winter. Prey 351
stored at nest also positively affected recruitment probabilities. We found positive effects of 352
the number of stored Microtus recorded at mid-season and, to a lesser extent, of stored 353
Apodemus early in the season (Table 2). When the number of Microtus increased from 0.59
354
(mean) to 1.03 (mean + 1 SD), average recruitment probability increased from 0.033 to 0.055, 355
while at a Microtus abundance of 0.15 (mean − 1 SD), recruitment probability went down to 356
0.019. As mean number of Microtus stored at the nest was also related to the probability of 357
double brooding, it accounted for part of the difference in recruitment between first and single 358
broods. Indeed, in years with relatively high numbers of stored prey items, double brooding 359
females and fledglings from early broods (typically first broods) experienced favourable 360
environmental conditions. By contrast, in years when prey stored in the nest were scarce, 361
females were much less likely to double brood. In addition offspring from early broods 362
(typically single broods) in low food years were less likely to recruit. 363
Lifetime reproductive success of female barn owls
364
Lifetime reproductive success of females with complete monitoring and estimate from the 365
count of fledglings (LFP) or recruits (LRP) were available for 771 females. The number of 366
breeding years over a female’s lifetime averaged 1.60 ± 1.18. Observed breeding lifespan was 367
significantly longer in females that double brooded at least once (2.5 ± 1.79) compared to 368
those that were never observed double brooding (1.45 ± 0.97; Poisson GLM: β = 0.57 ± 0.07, 369
P < 0.001). Females that double brooded at least once in their lifetime produced on average
370
2.5 times more fledglings than those who did not (LFP: 15.6 vs. 6.2; Fig. 6a). This difference 371
was even more pronounced when considering the number of recruits (LRP: 0.96 vs. 0.24; Fig. 372
6b). Females with longer lifespans and that also experienced more favourable breeding 373
seasons had higher LFP and LRP. The differences observed between double- and single-374
brooders remained highly significant even after controlling for lifespan and environmental 375
variability (Table 3). Post-breeding dispersal was correlated to the annual number of breeding 376
events detected. Females breeding in years with scarce breeding events recorded tended to 377
disperse further for the next breeding season (Gaussian GLMM for log transformed post-378
breeding dispersal distance [+1 to avoid NAs] with female identity as random factor; β = -379
1.78 ± 0.87, P = 0.043, N = 490). However, the difference in mean predicted dispersal 380
distance between the years with lowest and highest number of breeding events recorded was < 381
20 metres (Fig. S3), suggesting the displacements respond rather to differences in availability 382
of alternative nest boxes within nesting sites than to breeding dispersal outside the area. 383
We found no evidence of a negative effect of double brooding on female return rate. Indeed, 384
the return rate of double-brooding females was significantly higher than of single-brooders 385
ones (Binomial GLMM with female identity nested in zone as random factor β = 0.44 ± 0.16, 386
P = 0.006, N = 1526). Finally, our LFP and LRP estimates did not appear to be influenced by
387
our assignment of second broods based on laying date. We repeated the analyses classifying 388
as double brooding only these females captured twice in the same year and reclassifying as 389
single brooding these females captured only on what we considered to be their second brood, 390
and all reported differences in LFP and LRP were still significant (Table S1). To assess 391
whether these differences in LFP and LRP were only driven by extra offspring from second 392
broods, we repeated the analyses including only offspring from first and single broods. 393
Double brooding females tended to produce more fledglings even when considering only 394
offspring from first and single broods, compared to females never recorded as double 395
brooders, suggesting a difference in territory and/or individual quality between these two 396
categories. When accounting for females’ breeding lifespan and environmental variability in 397
LFP, the best model retained double brooding as a predictor variable, although it was no 398
longer significant. When considering recruits however, females that double brooded at least 399
once during their lifetime produced more recruits (LRP) from their first/single broods than 400
other females, and this difference remained when accounting for females’ breeding lifespan 401
and environmental variability (Table 3). 402
Intergenerational effects
403
Controlling for laying date, female recruits born from first broods produced 1.47 ± 0.49 404
additional fledglings during their first breeding attempt compared to females originating from 405
a single brood (t = -4.52, P < 0.001) and 1.76 ± 0.68 additional fledglings compared to a 406
female originating from a second brood (t = -4.35, P < 0.001; N = 88 female recruits from 407
single broods, 21 and 14 from first and second broods, respectively). When considering LFP 408
of those females, however, we did not find support for differences among brood types (AICc 409
= 0.38 unit higher than the null model) with a production of 9.4 ± 7.3, 8.3 ± 5.6 and 6.6 ± 2.4 410
fledglings respectively for females originating from single, first and second broods. Data were 411
too scarce to conduct the analysis based on LRP. 412
413
Discussion 414
We documented a large among-year variation in the occurrence of double brooding in a barn 415
owl population of north-eastern France. The ratio of double-brooding events in a year was 416
positively related to the mean number of prey stored at the nest, possibly related to prey 417
abundance in the field. In years with double brooding events, early-laying females were more 418
likely to undertake a second brood, possibly reflecting their mate’s ability to exploit wood 419
mice as alternative prey earlier in the breeding season. Fledglings born from first broods had 420
on average a higher recruitment probability compared to fledglings from single or second 421
broods. This difference, however, mainly arose as a consequence of variation in laying date as 422
fledglings born at a similar date in the same year recruited with a similar probability 423
irrespective of brood type. Overall, female barn owls that managed to double brood at least 424
once over their lifetime produced more than twice as many fledglings and recruits compared 425
to females that did not. We did not detect any evidence of cost of double-brooding for 426
breeding females nor for their offspring. 427
428
Proximate factors underpinning the occurrence of double brooding
429
Double brooding was on average achieved by 18% of the female barn owls. However, there 430
was much among-year variation around this average, probably reflecting variation in prey 431
abundance. Over 17 years, four years had no record of double brooding and in three years 432
more than 60% and up to 87% of females bred twice, in line with other studies (Husby et al. 433
2009). 434
At the population level, the annual mean number of Microtus voles stored at the nest was 435
the main factor explaining inter-annual variation. Double brooding was more common in 436
years when the mean number of voles stored at the nest peaked. Years with the highest ratio 437
of double broods (≥ 60% in 2007, 2010, 2014) did not coincide with the highest number of 438
breeding pairs. The latter is further limited by winter harshness affecting owl survival, as well 439
as breeding success (and thus cohort size) in the two preceding years (Altwegg et al. 2003). 440
Interestingly, these three years coincided with the highest densities and breeding success by a 441
another vole predator, the Montagu’s harrier Circus pygargus survey in Champagne (Millon 442
et al. 2002; A. Millon unpublished data). This migratory raptor is known to exhibit a direct 443
numerical response to the abundance of common voles in French cereal landscapes (Millon 444
and Bretagnolle 2008). The number of prey stored at nest, averaged across all nests within a 445
year, could be viewed as a proxy of prey abundance in the field, although it is likely also 446
affected by e.g. the timing of nest visits during the day, brood size and the age of chicks. To 447
assess the assumed relationship, we correlated the annual mean number of voles stored at nest 448
with an index of common vole abundance derived from a survey of 30 grasslands across the 449
study area monitored between 2009 and 2018 (authors’ unpublished data, following methods 450
described by Lambin et al. 2000). We found a positive, though marginally non-significant, 451
relationship (β = 0.033± 0.017, T value = 1.965, df = 8, P = 0.085, R²= 0.33, N = 10).
452
In years with higher mean numbers of prey stored at nest coinciding with the occurrence of 453
double brooding, the probability of a female undertaking a second brood decreased with first 454
brood laying date and brood size, yet increased marginally with the occurrence of Apodemus 455
stored at the nest and female age. The influence of laying date on the individual probability of 456
double brooding is recurrently reported across species (Taylor 2004; Nagy and Holmes 457
2005a; Hoffmann et al. 2015; Béziers and Roulin 2016). This pattern is related to obvious 458
temporal constraints for the breeding season to match the timing of resource availability 459
(Husby et al. 2009). However, while the resource availability constraint is clear for species 460
preying on insects with marked seasonality (Nagy and Holmes 2005b; Husby et al. 2009), 461
Microtus can still be available in high quantities during autumn (Delattre et al. 1999) and
462
Apodemus densities typically increase from August to November, with an overwinter plateau
463
(Montgomery 1989). However, post-harvesting ploughing of annual crops (wheat, barley, 464
rapeseed) early in the summer may drastically reduce the availability of voles for predators 465
such as barn owls. 466
Marked seasonal declines of food may not be the only reason for the temporal limit to 467
second broods in the barn owl. Barn owls fledging late in the season certainly suffer from a 468
reduced period to develop hunting skills before facing harsher weather and competition with 469
conspecifics to secure a territory. In years of high mean numbers of vole stored at nest, 470
females that had Apodemus prey stored at their nest were slightly more likely to breed twice 471
in that year (an increase of 4-6% in double brooding probability compared to females that did 472
not). Apodemus usually reach their peak in abundance in late autumn, decrease in spring, and 473
remain low during summer (Montgomery 1989). This suggests that females breeding in 474
territories with higher prey diversity might be able to lay earlier and therefore were more 475
likely to undertake a second reproduction. Moreover, at least in high vole years, females that 476
started breeding early experienced higher food abundance at mid-season when their first 477
breeding cycle ended (Fig. 1), facilitating the initiation of a second brood. This can be 478
achieved with the same male after the completion of the first brood, or following nest (and 479
mate) desertion and starting a second brood with a different mate in another nest-site 480
(Eldegard and Sonerud 2009; Béziers and Roulin 2016). Colour dimorphism in the barn owl 481
has been associated with different morphology and prey preference (Microtus vs. Apodemus; 482
Roulin 2004, Charter et al. 2014). In that context, females paired with males that 483
preferentially prey on Apodemus could benefit from the peak of this resource to start breeding 484
earlier. Unfortunately, we caught too few males to properly test this hypothesis. 485
Yearling females were slightly less likely to double brood compared to adults, under 486
similar environmental conditions (a difference of 4-6% in double brooding probability). This 487
adds to the abundant literature documenting the improvement of breeding success with age in 488
birds (Forslund and Pärt 1995). In contrast to our findings, most previous studies have found 489
no effect of brood size on the female probability of double brooding (Nagy and Holmes 490
2005a; Béziers and Roulin 2016; altough the latter found an effecto of brood size on male 491
probability of doible brooding), or even positive effects (Hoffmann et al. 2015). A possible 492
explanation for such results is that females might be less reluctant to bequeath small broods to 493
their mates. The smaller the brood indeed, the easier for single males to cope with food 494
supply. It is noteworthy that small brood size has been identified as a cause of divorce 495
between successive years in this species (Dreiss and Roulin 2014). 496
497
Fitness consequences of double brooding
498
While using a different, arguably more relevant, metric we found no support for the 499
contention by Béziers and Roulin (2016) that double brooding in barn owls is traded-off with 500
offspring quality. These authors found that offspring from first broods have lower body 501
condition than offspring from single broods, a pattern also reported for jackdaws (Corvus 502
monedula; Verhulst et al. 1997). In our study population, fledglings reared in first broods
503
recruited with the same probability that offspring from single broods with the same laying 504
date, and their subsequent breeding performance and LFP was similar. Here we found no 505
evidence for intergenerational trade-offs. Moreover, from a breeding female perspective, 506
double brooding resulted in higher lifetime production of recruits. This is consistent with a 507
study on hoopoes, where double brooding females produced 2.6 times more recruits than 508
single-brooding females over their lifetime (Hoffmann et al. 2015). We found that double-509
brooding female barn owls had longer breeding lifespans. They also produced more recruits 510
than single-brooding females, even after controlling for breeding lifespan and the number of 511
favourable breeding seasons experienced. Furthermore, this difference in the number of 512
recruits produced held when we considered only recruits from first and single broods. This 513
suggests that double brooding is highly rewarding in terms of fitness as we failed to find any 514
costs in terms of e.g. return rate and breeding lifespan. It is important to note here that the 515
uncertainty around the assignment of brood types did not affect our interpretations, as the 516
observed difference is in favour of the less detectable double-brooding event. Indeed, any 517
miss-assignment of first broods as single broods would result in smaller differences of fitness 518
parameters between brood types. Another bias in fitness estimate could arise if offspring of 519
different brood types, and single- or double-brooding females, differed in dispersal 520
propensity. Notwithstanding that we were unable to detect dispersal data outside our study 521
area, both its spatial scale and the fact that dispersal distances recorded within it did not differ 522
between the aforementioned categories, suggesting our estimate of lifetime recruit production 523
are unlikely to be strongly biased. 524
Most of the differences in individual probability of double brooding and in offspring 525
probability of recruitment arose from laying date with no detectable effect of brood type per 526
se, despite a slight penalization for very early broods (Fig. 5). This is in accordance with
527
observational and experimental results suggesting that the observed seasonal decline in fitness 528
is the result of laying date, with territory or parental identity/quality contributing little to the 529
covariance between laying date and recruitment (e.g. Van de Pol and Verhulst 2006, Pärt et al. 530
2017). An interesting question then arises: why do not all females double brood when 531
conditions are favourable? Although proximate causes of individual variation in laying date 532
are poorly known, a meta-analysis revealed that experimentally enhanced food provision in 533
birds mainly results in advanced laying dates, with increase in brood size showing smaller 534
effect size (Ruffino et al. 2014). Among-female variation in laying date might be related to 535
heterogeneity in individual and/or territory quality, and as a consequence may be a proxy of 536
quality itself. Male barn owls provide most of the food during the early breeding stages (from 537
courtship to early brooding) and male hunting skills provisioning rate might be an important 538
factor influencing laying date and probability of double-brooding (Taylor 2004; Durant et al. 539
2013). Unfortunately, low capture rates for adult males in our study did not allow us to 540
include male identity or characteristics in our analyses. Thus, females laying earlier broods 541
could be higher quality individuals or paired with higher quality males exploiting available 542
resources more efficiently and/or occupying territories with higher food abundance. We 543
predict that such females will be in better condition, be capable of starting breeding earlier, 544
and more capable of laying a second clutch, especially when, or if, Microtus abundance is 545
high. 546
In conclusion, we do not consider single- and double-brooding females as displaying 547
genuine alternative breeding strategies. In the case of barn owls, both the fact that double-548
brooding females enjoyed much higher fitness than single-brooded ones, with no evidence for 549
costs to parents or their offspring, and that in years of high prey abundance the proportion of 550
double-brooding exceeded 50%, suggest that all females have the potential to breed twice in a 551
year. Environmental conditions, and prey abundance particularly, are driving breeding 552
decisions in a predator, such as the barn owl, showing high reproductive rates. 553
554
Acknowledgments 555
We are grateful to all people having helped with the fieldwork over the years and to people 556
having accepted to host nestboxes. C. Riols took part of the pellet analysis. P. Frederick, D. 557
LaFlamme and S.M.R. Orzechowski provided a critical read of the manuscript. . J.F. Therrien 558
and two anonymous reviewers provided valuable comments that greatly improved a previous 559
version of the ms. The organisation ‘La Choue’ has partially supported this study. JZ 560
benefited from grant 659648, BetMon, of the European Union’s Horizon 2020 research and 561
innovation programme under the Marie Skłodowska-Curie Grant Agreement. Permission to 562
handle and ring birds was granted by the Centre de Recherche sur la Biologie des Populations 563 d’Oiseaux (MNHN Paris). 564 565 References 566
Altwegg R, Roulin A, Kestenholz M, Jenni L (2003) in survival , Variation and covariation dispersal , 567
and size in barn owls Tyto alba population. J Anim Ecol 72:391–399 568
Altwegg R, Roulin A, Kestenholz M, Jenni L (2006) Demographic effects of extreme winter weather 569
in the barn owl. Oecologia 149:44–51. doi: 10.1007/s00442-006-0430-3 570
Bates D, Maechler M, Bolker B, Walker S (2015) Fitting Linear Mixed-Effects Models Using lme4. J 571
Stat Softw 67:1–48. doi: doi:10.18637/jss.v067.i01 572
Baudvin H (1986) La reproduction de la chouette effraie (Tyto alba). Le Jean le Blanc 25:1–125 573
Béziers P, Roulin A (2016) Double brooding and offspring desertion in the barn owl Tyto alba. J 574
Avian Biol 47:235–244. doi: 10.1111/jav.00800 575
Bladé I, Liebmann B, Fortuny D, van Oldenborgh GJ (2012) Observed and simulated impacts of the 576
summer NAO in Europe: Implications for projected drying in the Mediterranean region. Clim 577
Dyn 39:709–727. doi: 10.1007/s00382-011-1195-x 578
Browne WJ, McCleery RH, Sheldon BC, Pettifor R a (2007) Using cross-classified multivariate mixed 579
response models with application to life history traits in great tits (Parus major). Stat Modelling 580
7:217–238. doi: 10.1177/1471082X0700700301 581
Bunn DS, Warburton AB, Wilson RDS (1982) The Barn Owl. Calton 582
Burnham KP, Anderson DR (2002) Model Selection and Multimodel Inference. Springer-Verlag, 583
New-York 584
Charter M, Leshem Y, Izhaki I, Roulin A (2014) Pheomelanin-based colouration is correlated with 585
indices of flying strategies in the Barn Owl. J Ornithol 156:309–312. doi: 10.1007/s10336-014-586
1129-6 587
Chausson A, Henry I, Ducret B, et al (2014) Tawny Owl Strix aluco as an indicator of Barn Owl Tyto 588
alba breeding biology and the effect of winter severity on Barn Owl reproduction. Ibis (Lond
589
1859) 156:433–441. doi: 10.1111/ibi.12148 590
Crawley MJ (2007) The R Book. John Wiley & Sons, Ltd, Chichester, UK 591
Delattre P, De Sousa B, Fichet-Calvet E, et al (1999) Vole outbreaks in a landscape context: Evidence 592
from a six year study of Microtus arvalis. Landsc Ecol 14:401–412. doi: 10.1023/A 593
Dreiss AN, Roulin A (2014) Divorce in the barn owl: Securing a compatible or better mate entails the 594
cost of re-pairing with a less ornamented female mate. J Evol Biol 27:1114–1124. doi: 595
10.1111/jeb.12402 596
Durant JM, Hjermann DØ, Handrich Y (2013) Diel feeding strategy during breeding in male Barn 597
Owls (Tyto alba). J Ornithol 154:863–869. doi: 10.1007/s10336-013-0956-1 598
Eldegard K, Sonerud GA (2009) Female offspring desertion and male-only care increase with natural 599
and experimental increase in food abundance. Proc Biol Sci 276:1713–1721. doi: 600
10.1098/rspb.2008.1775 601
Erb J, Boyce MS, Stenseth NC (2001) Population dynamics of large and small mammals. Oikos 92:3– 602
12. doi: 10.1034/j.1600-0706.2001.920101.x 603
Forslund P, Pärt T (1995) Age and reproduction in birds - hypotheses and tests. Trends Ecol Evol 604
10:374–378. doi: 10.1016/S0169-5347(00)89141-7 605
Hallett TB, Coulson T, Pilkington JG, et al (2004) Why large-scale climate indices seem to predict 606
ecological processes better than local weather. Nature 430:71–75. doi: 10.1038/nature02708 607
Hoffmann J, Postma E, Schaub M (2015) Factors influencing double brooding in Eurasian Hoopoes 608
Upupa epops. Ibis (Lond 1859) 157:17–30. doi: 10.1111/ibi.12188 609
Huffeldt NP, Aggerholm IN, Brandtberg NH, et al (2012) Compounding effects on nest-site dispersal 610
of Barn Owls Tyto alba Compounding effects on nest-site dispersal of Barn Owls Tyto alba. 611
3657:175–181. doi: 10.1080/00063657.2011.652592 612
Husby A, Kruuk LEB, Visser ME (2009) Decline in the frequency and benefits of multiple brooding 613
in great tits as a consequence of a changing environment. Proc R Soc B 276:1845–1854. doi: 614
10.1098/rspb.2008.1937 615
Jackson P, Cresswell W (2017) Factors determining the frequency and productivity of double 616
brooding of Barn Owls Tyto alba. Bird Study 64:353–361. doi: 10.1080/00063657.2017.1363716 617
Korpimäki E, Salo P, Valkama J (2011) Sequential polyandry by brood desertion increases female 618
fitness in a bird with obligatory bi-parental care. Behav Ecol Sociobiol 65:1093–1102. doi: 619
10.1007/s00265-010-1118-6 620
Lambin X, Petty SJ, Mackinnon JL (2000) Cyclic dynamics in field vole populations and generalist 621
predation. J Anim Ecol 69:106–118. doi: 10.1046/j.1365-2656.2000.00380.x 622
Lambin X, Yoccoz NG (2001) Adaptive precocial reproduction in voles: Reproductive costs and 623
multivoltine life-history strategies in seasonal environments. J Anim Ecol 70:191–200. doi: 624
10.1046/j.1365-2656.2001.00494.x 625
Lefcheck JS (2015) piecewiseSEM: Piecewise structural equation modelling in r for ecology, 626
evolution, and systematics. Methods Ecol Evol 573–579. doi: 10.1111/2041-210X.12512 627
Martín-Vivaldi M, Palomino JJ, Soler M (1999) Function of song in the Hoopoe Upupa epops. Bird 628
Study 46:104–111. doi: 10.1080/00063659909461120 629
Mikkola H (1983) Owls of Europe. Poyser, London 630
Millon A, Bourrioux JL, Riols C, Bretagnolle V (2002) Comparative breeding biology of Hen Harrier 631
and Montagu’s Harrier: An 8-year study in north-eastern France. Ibis (Lond 1859) 144:94–105. 632
doi: 10.1046/j.0019-1019.2001.00009.x 633
Millon A, Bretagnolle V (2008) Predator population dynamics under a cyclic prey regime: Numerical 634
responses, demographic parameters and growth rates. Oikos 117:1500–1510. doi: 635
10.1111/j.0030-1299.2008.16458.x 636
Montgomery WI (1989) Population regulation in the wood mouse, Apodemus sylvaticus. I. Density 637
dependence in the annual cycle of abundance. 58:465–475 638
Nagy LR, Holmes RT (2005a) To double-brood or not? Individual variation in the reprodutive effort 639
in black-throated blue warblers (Dendroica caerulescens). Auk 122:902–914. doi: 10.1642/0004-640
8038(2005)122[0902:TDONIV]2.0.CO;2 641
Nagy LR, Holmes RT (2005b) Food limits annual fecundity of a migratory songbird: An experimental 642
study. Ecology 86:675–681. doi: 10.1890/04-0155 643
Nakagawa S, Schielzeth H (2013) A general and simple method for obtaining R2 from generalized 644
linear mixed-effects models. Methods Ecol Evol 4:133–142. doi: 10.1111/j.2041-645
210x.2012.00261.x 646
Pärt T, Knape J, Low M, et al (2017) Disentangling the effects of date, individual, and territory quality 647
on the seasonal decline in fitness. Ecology 98:2102–2110. doi: 10.1002/ecy.1891 648
Pavluvčík P, Poprach K, Machar I, et al (2015) Barn owl productivity response to variability of vole 649
populations. PLoS One 10:1–13. doi: 10.1371/journal.pone.0145851 650
Pinheiro J, Bates D, DebRoy S, et al (2016) nlme: Linear and Nonlinear Mixed Effects Models. R 651
package version 3.1-128 652
Roulin A (2004) Covariation between plumage colour polymorphism and diet in the barn owl Tyto 653
alba. Ibis (Lond 1859) 509–517 654
Ruffino L, Salo P, Koivisto E, et al (2014) Reproductive responses of birds to experimental food 655
supplementation: a meta-analysis. Front Zool 11:80. doi: 10.1186/s12983-014-0080-y 656
Souriau A, Yiou P (2001) Grape harvest dates for checking NAO paleoreconstructions. Geophys Res 657
Lett 28:3895–3898. doi: 10.1029/2001GL012870 658
Taylor IR (1993) Age and sex determination of barn owls tyto alba alba. Ringing Migr 14:94–102. 659
doi: 10.1080/03078698.1993.9674050 660
Taylor IR (2004) Barn Owls: Predator-Prey Relationships and Conservation. Cambridge University 661
Press, Cam 662
Team RC (2016) R: A language and environment for statistical computing. 663
Van De Pol M, Verhulst S (2006) Age ‐ Dependent Traits : A New Statistical Model to Separate 664
Within ‐ and Between ‐ Individual Effects. Am Nat 167:766–773 665
van den Brink V, Dreiss AN, Roulin A (2012) Melanin-based coloration predicts natal dispersal in the 666
barn owl, Tyto alba. Anim Behav 84:805–812. doi: 10.1016/j.anbehav.2012.07.001 667
Verboven N, Verhulst S (1996) Seasonal variation in the incidence of double broods: The date 668
hypothesis fits better than the quality hypothesis. J Anim Ecol 65:264–273. doi: Doi 669
10.2307/5873 670
Verhulst S (1998) Multiple breeding in the Great Tit, II. The costs of rearing a second clutch. Funct 671
Ecol 12:132–140. doi: 10.1046/j.1365-2435.1998.00165.x 672
Verhulst S, Nilsson J-A (2008) The timing of birds’ breeding seasons: a review of experiments that 673
manipulated timing of breeding. Philos Trans R Soc Lond B Biol Sci 363:399–410. doi: 674
10.1098/rstb.2007.2146 675
Verhulst S, Tinbergen JM, Daan S (1997) Multiple breeding in the Great Tit. A trade-off between 676
successive reproductive attempts? Funct Ecol 11:714–722. doi: Doi 10.1046/J.1365-677
2435.1997.00145.X 678
Zuur AF, Ieno EN, Walker N, et al (2009) Mixed effects models and extensions in ecology with R. 679
Springer New York, New York, NY 680
681
Table 1. Results of the best binomial GLMM investigating the probability of a female barn 683
owl to breed twice in a year, considering only clutches laid before the 5th of May in years with 684
at least 5% of double broods (N = 705, marginal R2 = 0.14, conditional R2 = 0.41). 685
Explanatory variables retained in this model were relative laying date, female age (yearling or 686
≥ 2yr-old), occurrence (yes/no) of Apodemus stored at nest and brood size. Explanatory 687
variables were scaled such that effect sizes are comparable between each other. The model 688
included year as a random factor. 689 690 Explanatory variables Estimate SE z P Intercept -1.40 0.46 -3.03 0.002
Rel. laying date -0.69 0.12 -5.61 < 0.001
Age (yearling) -0.53 0.28 -1.88 0.060
Apodemus (yes) 0.48 0.26 1.83 0.067
Brood size -0.29 0.11 -2.58 0.010
691
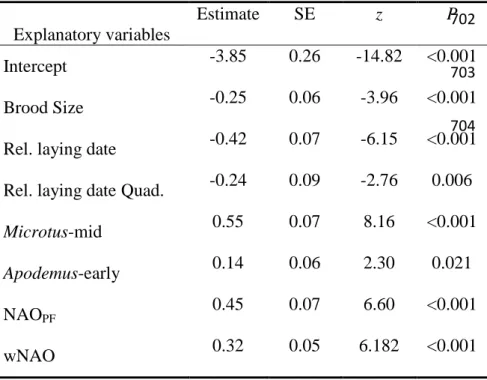
Table 2. Results of the best binomial GLMM investigating variation in the recruitment 693
probability of fledgling (N = 8157; R2marg = 0.15; R2cond = 0.231). Explanatory variables
694
retained were relative laying date, quadratic term of relative laying date, mean number of 695
Microtus stored at nest in mid-season (Microtus-mid), mean number of Apodemus stored at
696
nest early in the season (Apodemus-early), NAO index for the first month post-fledging 697
(NAOPF) and NAO index of the following winter (wNAO). Explanatory variables were
698
scaled. The model included zone nested in year as random effects. Rel. laying date stands for 699
relative laying date 700 701 702 703 704 Explanatory variables Estimate SE z P Intercept -3.85 0.26 -14.82 <0.001 Brood Size -0.25 0.06 -3.96 <0.001
Rel. laying date -0.42 0.07 -6.15 <0.001 Rel. laying date Quad. -0.24 0.09 -2.76 0.006
Microtus-mid 0.55 0.07 8.16 <0.001
Apodemus-early 0.14 0.06 2.30 0.021
NAOPF 0.45 0.07 6.60 <0.001
Table 3. Results of the best negative binomial GLM comparing female lifetime reproductive 705
success, based on count of offspring (LFP) or recruits (LRP), between females detected to 706
breed twice in a year at least once in their lifetime (DB) vs. those that were never detected to 707
do so (N = 771 females; 110 of them categorised as DB). Explanatory variables also retained 708
in these model were breeding lifespan, i.e. the number of years between first and last detected 709
breeding (Lifespan), and the number of favourable breeding seasons in lifespan (i.e. years in 710
which the ratio of double broods exceeded 5%; Fav. breed. Season). Outputs of two distinct 711
models are presented here: one considering offspring from any brood type and one 712
considering only offspring form first and single broods. Explanatory variables were scaled. 713
714
Explanatory
variables Lifetime fledgling production Lifetime recruit production All
offspring Estimate se z P Estimate se z P
Intercept 1.82 0.02 107.26 <0.001 -1.47 0.09 -16.68 <0.001 DB 0.54 0.04 13.80 <0.001 0.83 0.18 4.55 <0.001 Lifespan 0.30 0.01 20.87 <0.001 0.34 0.07 4.98 <0.001 Fav. breed. season 0.04 0.02 2.28 0.023 0.17 0.08 2.04 0.042 Only first/single broods Intercept 1.34 0.02 57.42 <0.001 -1.44 0.09 -16.60 <0.001 DB 0.07 0.04 1.59 0.113 0.41 0.19 2.13 0.034 Lifespan 0.27 0.01 23.79 <0.001 0.37 0.07 5.47 <0.001 Fav. breed. season 0.05 0.02 2.54 0.011 0.170 0.08 2.09 0.037 715 716 717