HAL Id: hal-02608068
https://hal.inrae.fr/hal-02608068
Submitted on 16 May 2020HAL is a multi-disciplinary open access
archive for the deposit and dissemination of sci-entific research documents, whether they are pub-lished or not. The documents may come from teaching and research institutions in France or abroad, or from public or private research centers.
L’archive ouverte pluridisciplinaire HAL, est destinée au dépôt et à la diffusion de documents scientifiques de niveau recherche, publiés ou non, émanant des établissements d’enseignement et de recherche français ou étrangers, des laboratoires publics ou privés.
To cite this version:
Marine Favre, Marielle Montginoul. Water pricing in Tunisia: can an original rate structure achieve multiple objectives?. Utilities Policy, Elsevier, 2018, 55, pp.209-223. �10.1016/j.jup.2018.06.004�. �hal-02608068�
1
Water pricing in Tunisia: Can an original rate structure achieve
multiple objectives?
Authors: Marine Favre, Marielle Montginoul
G-EAU, Univ Montpellier, AgroParisTech, Cirad, IRD, Irstea, Montpellier SupAgro, Montpellier, France.
1. Abstract
In the context of anthropic pressures, the Tunisian Water Utility tries to achieve three objectives: financial (achieving full-cost recovery), social (ensuring access for all), and environmental (incentivizing users to save a scarce resource). After a theoretical review of water pricing, the paper presents how successive reforms in Tunisia have gradually set up an original pricing structure that has become the main instrument of the sector's policy. Using different data and methods, we investigate how each of the three objectives is reached through pricing. We conclude that this pricing policy has led to a relatively stable but partial equilibrium.
2. Keywords
Cost recovery, water access, water conservation, water pricing
3. Abbreviation list
IBT Increasing Block tariffs
LCD Litre per capita
OECD Organisation for Economic Co-operation and Development O&M Operations and Maintenance
SONEDE Société Nationale d’Exploitation et de Distribution des Eaux
TWU Tunisian Water Utility
TSU Tunisian Sewerage Utility
TND Tunisian Dinars
UA User Associations
2
4. Highlights
The Tunisia Water Utility applies nationally an original inclining-rate tariff The cost-recovery principle depends highly on high water consumers The affordability principle is only reached for piped-households
The averaging-out principle does not indicate the local scarcity value of water Equity could be improved among piped households
5. Introduction
Urban water managers are often faced with conflicting objectives: financial (achieving full-cost recovery), equity (ensuring access for all), and environmental (incentivizing users to save a scarce resource). In countries with high levels of poverty but which are seeking to provide an in-house or at least on-plot water connection, these objectives are often pursued via a single instrument, water pricing, recognized as a key instrument of economic policy for impacting the environmentally, socially, and economically efficient use of water (Dinar, Pochat, and Albiac-Murillo, 2015). This solution contrasts with the “coherence principle” proposed by Tinbergen (1956), which states that “the number of instruments should be at least equal to the number of objectives,” but chimes with the view of those economists who recommend adopting a single instrument to achieve different objectives (the Walter and Duncan Gordon Foundation et al. 2005). Boiteux (1956) and later Feldstein (1972), for example, researched water pricing schemes that were simultaneously able to achieve efficiency and cost recovery. Some national governments and international forums even recommend introducing a single instrument to attain multiple objectives simultaneously. But the design of any such instrument is a challenge.
This analysis focuses on the case of Tunisia, which since 1974 has implemented a water pricing structure designed to achieve all three named objectives. In a first step, the country applied a conventional Increasing Block Tariff (IBT) structure whereby initial blocks of consumption are charged at a lower rate than the additional blocks of consumption. They gradually introduced a fully inclining rate tariff (IRT) whereby the tariff depends entirely on the water consumption level and total consumption is charged at the rate of the top band.
After a brief theoretical review of progressive tariff structure (part 1), this paper aims to outline how objectives pursued by the sector have been translated into structure and price level in Tunisia (part 2), and to assess to what extent they have been attained (parts 3, 4, and 5).
3
Part 1. Theory: can water pricing systems simultaneously achieve
financial, social, and environmental objectives?
In the water industry characterized by increasing returns to scale as a case of a natural monopoly, marginal-cost pricing recommended by economic theory to reach long-term economic efficiency leads to a budgetary deficit of the firm. The economic efficiency criterion is inconsistent with sustainable cost recovery, so alternative pricing models are proposed. They consist of second-best solutions from the perspective of economic efficiency but addressing other criteria, namely financial, social, and environmental.
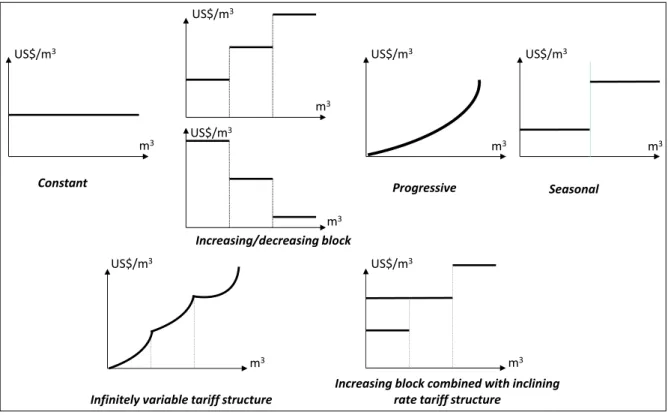
Among all the possible tariff structures, progressive structures, and in particular IBTs where the first cubic meters consumed are billed in blocks at a lower rate than the following ones, are widely used in developing countries because they theoretically address several goals simultaneously and provide water access for poor households where the large majority of the population is poor. Whittington et al. (2015) report that 74% of the water utilities of low- and middle-income countries surveyed by Global Water Intelligence (71 companies) were still using IBTs in 2013.
Increasing block combined with inclining rate tariff structure
m3
US$/m3
m3
US$/m3
Infinitely variable tariff structure
m3 m3 m3 Constant Increasing/decreasing block m3 m3 Progressive Seasonal US$/m3 US$/m3 US$/m3 US$/m3 US$/m3 Source: Authors
Figure 1. Standard (top) and alternative (bottom) shapes of the variable part of tariff structure
The IBT structure is based on strong assumptions outlined by Agthe and Billings (1987). First is the declining marginal utility of water use. Second is a positive relationship between water use
4
and household income. Third is a negative price elasticity of demand that is lower for higher incomes (since water bills represent a smaller part of their household revenue compared to poorer households) 1; fourth is the absence of suitable alternatives to tap water with the subsequent risk
that large consumers exit the collective system, which may lead to financial distress due to cross-subsidies from large to small consumers.
Based on these assumptions, the theoretical targeted objective of an IBT is to improve equity between high-income and low-income households, sinceIBT enables a minimum volume of water to be delivered at an affordable price through a first block known as a “social block” (Agthe et Billings, 1987; Borenstein, 2012); and to promote equitable allocation between efficient and less efficient users (Agthe et Billings, 1987). IBT aims to promote water-use efficiency (Agthe et Billings, 1987; Borenstein, 2012): by setting high marginal prices for high consumers, and due to price elasticity effects, IBT is expected to help achieving reductions in peak or total use and thereby reduce the long-term capital investment required to provide them (Agthe et Billings, 1987). Various kinds of cross-subsidies are possible. With intra-category subsidies, low-level users may be subsidized by high water users2. With inter-category subsidies, a frequent choice is
to subsidize domestic users from the industrial, tourism, or other economic sectors. In some developing countries, the public administration user subsidizes domestic users, with potentially inequitable impacts because even the non-connected may have to pay in the form of any taxes. To achieve however those stated objectives, any IBT design should factor in several considerations. First, the structure should match the water service's cost structure and the consumption distribution curve. The second concern is the number of blocks, which must be as small as possible if the tariff schedule is to remain understandable and implementable (Agthe et Billings, 1987). Finally, the first ("social") block must be well enough designed to enable households a minimum subsistence volume of affordable water, while discouraging water waste. The other blocks must also be well enough designed to prevent water bills from imposing too heavy a burden on households in the upper blocks. If the first block is too broad, all consumers receive a high fixed subsidy even for a non-essential part of their water demand, leading to economically inefficient levels of water consumption (Schoengold et Zilberman, 2014).
The implementation of IBT structures as a means of addressing water affordability assumes that each household has individual access to the water network, and low-income households are small water consumers (Whittington, 1992). Blocks are usually designed per subscriber and not per
1 Low-income households have fewer uses for water and fewer substitutes for these uses (Agthe et Billings,
1987) For nonessential water uses, their sensitivity to price is higher than for wealthy households.
5
person. This puts the targeted population at a disadvantage: where low-income households are larger than wealthier households, they consume more water not because of waste but for structural reasons. Another concern, especially for towns, is that the low-income population may live in condominiums or other types of collective housing, where water meters are also collective. In this case, such a water pricing structure, with its social objective, may not actually impact the target population. Nauges and Whittington (2016) combined data from several sources to estimate the correlation between household income and water use. For developing countries (4 out of 13 studies analyzed), the authors found a correlation varying between +0.1 and +0.3, it is "typically (but not always) positive, but quite low", meaning that "there are many rich households that use small amounts of water, and many poor households that use large quantities of water." Lastly, it is difficult to attain a social objective through a "universal" water pricing structure. One of the main reasons is the large range of characteristics of low-income households. This is illustrated by the case of the Flanders Region of Belgium (van Humbeeck, 2000) where the implementation of a universal and social water pricing structure led to a water bill increase for the poorest households, and a decrease for the wealthiest. This is explained by the characteristics of the poor Flanders population, which is mainly composed of single or small families and is thus unable to benefit from the economy of scale enabled by a per-inhabitant IBT structure. Whittington (1992) also reports the same problem in Kumasi (Ghana). Griffin (2011), exploring the welfare impacts of IBT compared to those under Uniform Rate (UR) pricing, concludes that high water users are favored by IBT while low water users prefer scarcity-value inclusive UR in a situation of water scarcity. In addition, the author reminds that, in addition to being economically inefficient (by utilizing several marginal prices whereas marginal costs are the same for all users), an IBT is difficult to put in place (regarding the calculation of several tiers and rates) and might puzzle water users due to complexity.
In an IRT structure, all consumption is charged at the rate of the top band in which the last cubic meter of usage falls. That means a small increase in consumption may lead to a substantial rise in total bill. For instance, consuming an additional cubic meter from the first band to the second band will result in a 50 % increase in the water bill in Egypt, Fayoum region (Nauges et al, 2015) and in a 39% increase in Tunisia (see above). Nauges et al (2015) note that this disproportionate increase in the bill is unrelated to the water system’s costs. Then, such price “jumps” not following average or marginal costs, are not justified from the point of view of economic efficiency since they give wrong signals to consumers about the value of water. However, this pricing structure would presumably increase the impact of water conservation and cost recovery compared to IBT; that is, more incentives to save water when users are price-sensitive and more revenue for water utilities. However, such a system could make affordability worse for larger
6
families, as it will penalize poor large households even more than a conventional IBT. Lastly, from a practical point of view, by providing strong incentives to stay just under a tiers limit, it might encourage the development of fraud strategies to maintain apparent consumption below the thresholds (such as the use of a mechanically defective meter or fraud at the time of meter reading for instance). To sum it up, there are two justifications to apply an IRT pricing system: a severe scarcity needing strong water-saving incentive and the need for the operator to collect more revenues. Its viability may depend on revenue sufficiency and whether levels of consumption will penalize large families with low incomes.
6. Part 2: History of water pricing in Tunisia
Tunisia is located in the Southern Mediterranean region, one of the driest regions in the world. Total renewable water resources per capita in the country are estimated at 410 m³/inhabitant. This weak level (for comparison, Morocco lists nearly twice) has led to a high degree of resource mobilization (70%) (FAO, 2016). Water resources are unevenly distributed over the territory: the northern regions occupying 17% of the surface area account for 60% of the total water resources while the southern regions, which represent 61% of the territory, have only 23%. In the north of the country, resources come mainly from surface water while in the South resources are groundwater. Territorial choices for the economic development of the country's coastal areas through tourism did not consider the geographical imbalance of water resources leading to major transfer investments; coastal zones (Cap-Bon, Sahel, Sfax) derive 55% of their supply from regions of the north and north-west which transfer 74% of their production (SONEDE, 2008 quoted by Touzi et al., 2010).
In most of Tunisia, urban water and sewerage services are delivered by two national companies: SONEDE, the Tunisian Water Utility (henceforth the TWU) and ONAS, the Tunisian Sewerage Utility (henceforth the TSU). Water bills include either water or water plus sewerage, depending on the locality, as observed in most countries: the sewer fee is charged within the water bill issued by the TWU which collects it on behalf of the TSU in areas with collective sanitation (exclusively urban areas). All users who subscribe to the water service provided by TWU are subject to the sewer fee if the town they live in is served by the TSU. This strategy enables more revenue to be collected while encouraging households to connect to the sewer since they already pay for it. Neighboring countries act differently: for instance, in Morocco and in Jordan, only households connected to a public sewer pay the related fee. Lebanon has chosen an intermediate option; all water users are charged but two different rates apply, one for those connected to the sewer and a lower rate for customers who are not connected.
7
We begin by examining the historical development of water pricing in Tunisia before describing the current water pricing system in greater depth.
6.1. A historical overview of Tunisian national water pricing
Since 1961, a unique price has been applied within the TWU perimeter according to a tariff equalization principle. Initially, water was priced following a volumetric base and with no distinction among users. This structure enabled users to adopt the service at the lowest ‘commitment' cost (households pay only proportionally to water consumption, without a "lump-sum part"), which helped them to gradually move away from alternative water sources and connect to the national water network. The tariff structure changed in 1968 to introduce a tariff schedule that differentiates between categories of users and to adopt a binomial base with a constant variable part, probably with an expectation to generate more constant revenues. Since 1974, an IBT structure was implemented initially alongside a conventional structure until 1987, followed by a mix of IBT and IRT systems from 1988 to 2004 and finally by a ‘pure’ IRT structure since 2005.
Successive water pricing reforms were adopted in a bid to achieve a water-saving objective and to improve social access and cost recovery. Initially, to enable access for all, a first block was designed in 1978 at 40 m3 per household per quarter. At this time, households served by the TWU
were still few, and attention was focused on managing supply rather than demand (Ben Mansour, 2013). From 1982, a water demand management policy began; the first block was halved to 20 m3, and collective access to water was progressively priced at a minimum level corresponding to
the first block (Supplementary material Table 10). This social access care was reinforced by the fact that, apart from the last reform, the first block benefited from special attention (with no increase or a lower increase than for the other blocks). At the same time, with a view to cost recovery and water conservation incentives, the number of blocks was progressively increased (up to seven). The structure went progressively from a conventional IBT to an IRT structure. The stated objective was to propose a more selective tariff schedule with a social band restricted to small users only, but it also enabled the level of the TWU’s revenues to be significantly raised, especially in the case of low water price sensitivity. Price increases were higher for the highest bands, and tourists had to pay the rate for the last band.
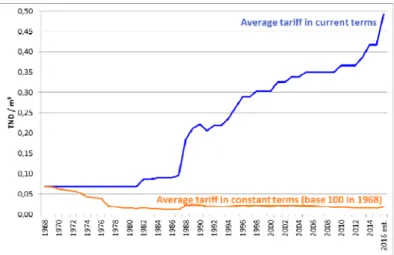
These reforms led to high water price increases in current terms but were not sufficient to offset inflation, leading to a decrease in water prices in constant terms (Figure 2).
8
Source: Inflation rates from 1968 to 1980: World Development Indicators, 1980-2016: World Economic Outlook Database, April 2016, IMF
Figure 2. Evolution of average water price (excluding sewer and VAT) for a 30 m3/quarter water consumption from 1968 to 2016 (SONEDE) (base 100 in 1968)
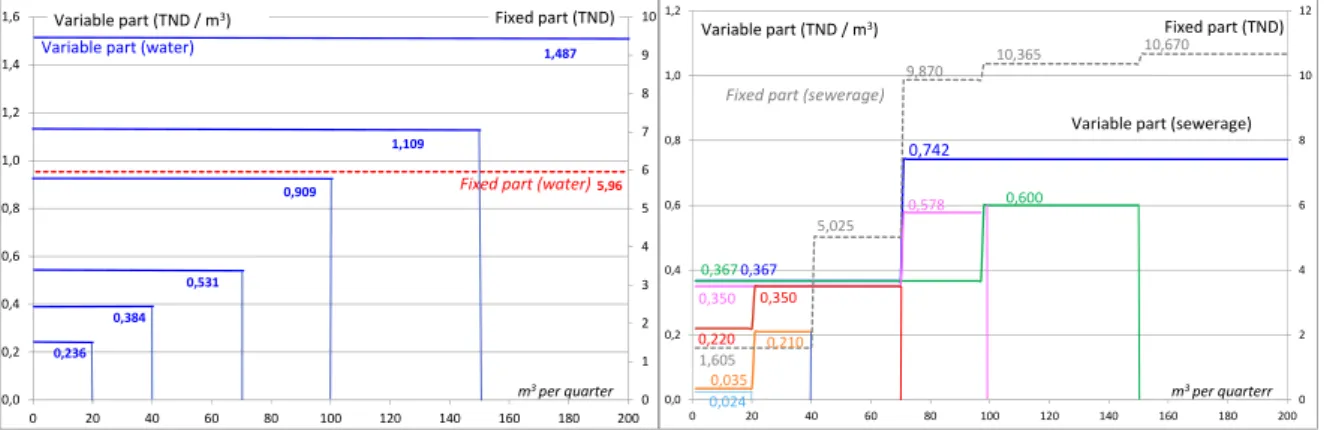
The two national operators establish their own pricing rules, but users receive a unique bill based on their water consumption. The TSU has also adopted the philosophical principle of applying a single pricing structure at the national level. It has also chosen to progressively align its bands on those of the water tariff. The first differentiation is in terms of its pricing structure, which has been binomial from the beginning with mixed IRT and IBT structures (Supplementary material, Table 11). But jumps from one band to another are not easy to describe because sewer price levels depend on the rate tier and then the volume. For instance, in 2016, a user consuming between 70 and 100 m3 per quarter paid 0.35 TND/m3 for the first 70 m3 and 0.578 TND/m3 for the following;
a user consuming between 101 and 150 paid the first 70 m3 at 0.367 TND/m3 and the following at
0.6 TND/m3. The second main difference concerns the fixed part, the level of which depends on
the volume consumed since 1982: that year for instance, the fixed part was charged at 0.75 TND per quarter for subscribers consuming less than 40 m3, 1 TND for those consuming between 41
and 70, and 2 TND for those consuming more than 70, along with tourist subscribers. The differentiated fixed part reinforces the three targeted objectives. Another peculiarity is linked to the level of tariff: from 1979 to 1988, there was no charge for the first cubic meters, for reasons of social access; since 1988, there has been a charge, but at a very low level. Finally, we observe a trend to capture user surplus: touristic and industrial uses are priced with a simple binomial pricing structure but at higher levels which have been quickly and sharply reduced in 1982. The price for tourist subscribers was ten times the top band in 1979, only twice in 1982, and 1.8 times in 2016. Other uses have incurred a higher price since 2010, due to the change in the pricing structure toward a two-part (binomial) IBT.
9
6.2. The current water pricing system
The TWU jointly decides on the application of its tariffs with the supervisory authorities: tariff proposals under different scenarios are periodically3. Prepared by TWU, proposals are presented
to its board of directors which includes several ministries and the TSU who hold divergent interests and discussed with the board until a scenario is chosen. The tariff agreement is signed by the two lines ministries (Agriculture and Finance) and then translated into a joint ministerial decree to be implemented.
Water customers are charged the binomial tariff structure, composed of fixed and variable parts, as found widely throughout the world. The variable part is a combined IRT and IBT for users charged for water and sewerage (Figure 3 on the right) and an IRT for users only charged for water (Figure 3 – on the left4). In addition to the variable part, both operators apply a fixed charge
for every customer based on the water meter diameter (the bigger it is, the more that is charged) for the TWU and on water consumption level for the TSU.
0,236 0,384 0,531 0,909 1,109 1,487 5,96 0 1 2 3 4 5 6 7 8 9 10 0,0 0,2 0,4 0,6 0,8 1,0 1,2 1,4 1,6 0 20 40 60 80 100 120 140 160 180 200 Fixed part (TND) Fixed part (water) Variable part (water) m3 per quarter Variable part (TND / m3) 0,742 0,3670,367 0,600 0,578 0,220 0,350 0,350 0,035 0,210 0,024 1,605 5,025 9,870 10,365 10,670 0 2 4 6 8 10 12 0,0 0,2 0,4 0,6 0,8 1,0 1,2 0 20 40 60 80 100 120 140 160 180 200
Variable part (TND / m3) Fixed part (TND)
Fixed part (sewerage)
Variable part (sewerage)
m3 per quarterr
Source: Authors calculations from tariff schedules
Figure 3. Water and sewer rate structures paid quarterly by Tunisian households in Tunisian Dinars including VAT, in 2016, up to 200 m3 per quarterly consumption5
While binomial pricing (including fixed and variable parts) is common, the fully inclining rate form of the variable part applied in Tunisia is quite rare in Mediterranean countries. To our knowledge, such a structure applies in a region in Egypt with in a minimum of consumption billed of 10 m3 per month (Nauges, Whittington, and El-Alfy, 2015), and in a city in Spain (Tobarra
González, 2016). Conventional IBT structures are applied in Algeria, Egypt (Great Cairo), and in
3 The TWU used to define a five-year plan including a study of financing needs and a program-contract with
objectives and tariffs proposals. This process was interrupted by the 2011 democratic revolution and replaced by annual budgets during the transition period.
4 The last band – not included in Figure 3 left – from 500 m3 per quarter is charged at TND 1,552/ m3 (including
VAT).
10
small centers managed by the national operator in Morocco. Only Jordan applies an IBT with two distinguishing features: the first block is provided for free, and then the fixed part increases per block along with the variable part. Large cities in Morocco (those whose water services are managed by the municipalities or private operators and not by the national operator) have very recently adopted a mixed tariff structure as in sewered areas in Tunisia, which consists of an IBT for the two first blocks and then an IRT beyond (with 3 bands).
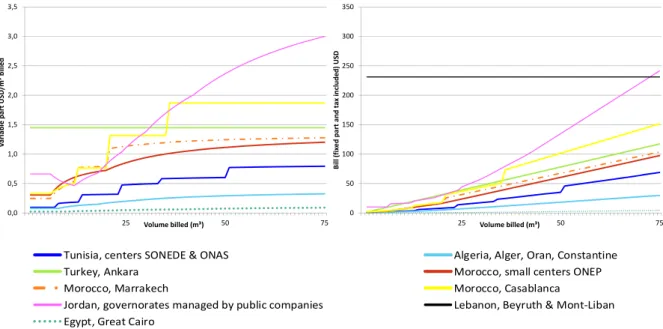
Figure 4 depicts tariff schedules and related bills in Tunisia and neighboring countries, adopting the following principles: 1) all tariff schedules have been reduced to a monthly basis to enable comparison; 2) for Morocco and Tunisia, water and sewer tariffs were consolidated; 3) in a country when rates vary from one city, province or region to another, the graph depicts the maximum rate that can be applied.
0 50 100 150 200 250 300 350 25 50 75 B ill ( fix e d pa rt and tax in clu ded) US D Volume billed (m³) 0,0 0,5 1,0 1,5 2,0 2,5 3,0 3,5 25 50 75 V ari ab le p ar t USD /m ³ b ill e d Volume billed (m³) Tunisia, centers SONEDE & ONAS Algeria, Alger, Oran, Constantine Turkey, Ankara Morocco, small centers ONEP Morocco, Marrakech Morocco, Casablanca Jordan, governorates managed by public companies Lebanon, Beyruth & Mont‐Liban Egypt, Great Cairo
Source: information compiled from different sources presented in Appendix
Figure 4. Tariff schedule in force in 2016 up to 75 m3 equivalent per month: variable part, tax excluded, for water and sewerage with monthly tiers (left). Water and sewer bill, tax and fixed part
included (right)
Despite its IRT structure leading to significant bill increases, Tunisian monthly bills remain among the lowest up to 25 m³, unlike Morocco which appears to be on the high side: bills in Casablanca are only slightly lower than those charged in Ankara (Turkey). Egypt appears clearly in decline at around 1 USD for 20 m³ per month.
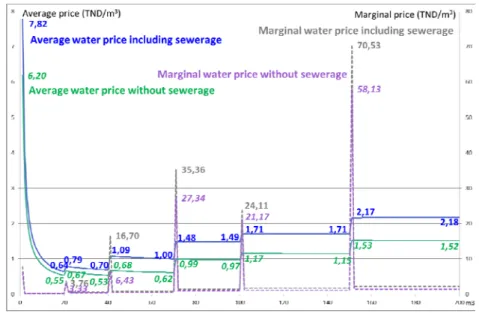
In Tunisia, as a consequence of the tariff structure, marginal and average prices vary widely (Figure 5). Marginal prices can thus reach very high levels: from 3.33 TND to 70.53 TND, with
11
the aim of topping consumption levels. If the water consumption is at the limit of a threshold, the last cubic meter becomes very expensive.
Source: Authors calculations from tariff schedules.
Figure 5. Average and marginal prices in TND including VAT, in 2016, up to 200 m3 quarterly consumption
Tourist uses (hotels, etc.) are priced only at the last level of the tariff schedule, that is 1.552 TND/m3 plus the fixed part depending on the water meter size for the water part and 1.32 TND/m3
plus 10.65 TND per quarter for the sewerage part (2016 data).
Progressive tariffs were first implemented in Tunisia to achieve three objectives simultaneously. But are they actually being met?
7. Part 3: An incentive to conserve water and an attempt to capture
water user’s surplus
To determine whether water pricing applied by the national Tunisian water manager encourages water conservation, we need to compare with similar and neighboring countries, in terms of tariff schedules, water price elasticity, and water consumption.
7.1. Assessing the incentive degree of the tariff
The incentive effect of tariffs schedules can be assessed by analyzing two criteria: the initial price level considering the average price of the first 10 m³ / month, and the escalation of tariffs by calculating the ratio between the average price for a monthly consumption of 33 m³ and the average price for a monthly consumption of 10 m³/ month. Qualitative scores are adapted from
12
Chohin-Kuper et al. (2002) based on the criteria described in Table 1. Table 2 provides results for Southern Mediterranean countries.
Criteria Score Criterion weight
Score 1: Initial price (average price, tax incl., for 10 m³) Weak: tariff <0.4 USD/m³
Medium: tariff <1USD/m³ High: tariff >1 USD/m³ Very high: tariff > 2 USD/m³
1 2 3 4
80%
Score 2: Tariff escalation (average price tax incl., 33m³/10m³) Weak: ratio <1
Medium: ratio ≥ 1 and < 1.5 High: ratio ≥ 1.5 and < 2 Very high: ratio ≥ 2
0 1 2 3
20%
Source: adaptation from Chohin-Kuper et al. 2002
Table 1 Notation criterion of tariff schedules (for m3 per month)
Country, town Pricing structure Price
USD/m³ (10 m³) (a) Price USD/m³ (33 m³) (b) Ratio
(b)/(a) Score 1st criteria Score 2 nd
criteria Final score
Turkey, Ankara Binomial, volumetric for water and sewerage
2.41 2.41 1.0 4 1 3.4
Jordan, governorates managed by public companies
Binomial, IBT with 18m3
minimal consumption for water and sewerage service
1.64 2.08 1.3 3 1 2.6
Morocco, Marrakech
Binomial, mix: IBT and IRT for water, IBT for sewerage
0.64 1.36 2.1 2 3 2.2
Morocco, Casablanca
Binomial, mix: IBT and IRT for water and sewerage
0.69 1.52 2.2 2 3 2.2
Morocco, small
centers ONEP Binomial, IBT for water and sewerage 0.71 1.13 1.6 2 2 2.0
Lebanon, Beyruth
and Mont-Liban Flat-rate for water and sewerage 0.00 (lump sum) 0.00 (lump sum) 1.0 2 1 1.0
Tunisia, national
operator’s centres Binomial, IRT for water and IBT for sewerage 0.30 0.61 2.0 1 3 1.4
Egypt, Great Cairo Binomial, IBT for water (sewerage is a percentage of water bill)
0.03 0.08 2.4 1 3 1.4
Algeria, Alger, Oran, Constantine
Binomial, IBT for water, volumetric for sewerage
0.22 0.32 1.5 1 1 1.0
Source: Authors calculations from different sources presented in Appendix
Table 2 Tariff and incentives to water conservation (from tariff schedule in force in 2016, including water and sewerage if any)
The tariff schedule in use in Tunisia seems a poor incentive compared with Morocco (from 0.64 up to 0.71 USD/m³ for 10 m³) or Jordan, but is an improvement on Egypt and Algeria, where the
13
most recent tariff increase dates back to 2005 and has resulted in prices remaining relatively low with little progression.
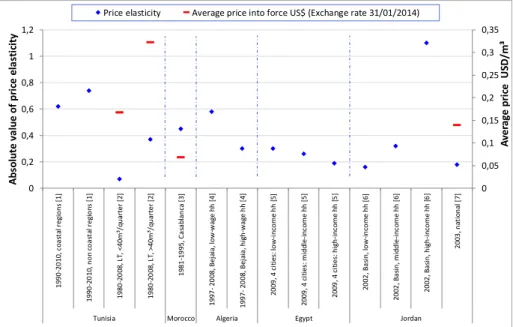
7.2. Comparing price elasticities
One indicator of tariff policy impact on water consumption is price elasticity: measuring demanded quantity variation due to changes in price. In developing countries, in most cases, price elasticity ranges between -0.3 and -0.6 for domestic connections (Nauges and Whittington, 2010), which is quite low in absolute terms but higher than in industrialized countries (especially Australia, France, and the United States) where elasticity values are between -0.1 and -0.5 for two-thirds of the studies analyzed by Montginoul and Rinaudo (2009). When looking more specifically at studies conducted in the southern Mediterranean sub-region providing data from 1980 to 2008, we observe slightly higher price elasticity values ranging from -0.1 to -0.7 (Figure 6). While price elasticity is relatively weak for low-volume users in Tunisian, it reaches levels commonly observed in other similar countries at higher consumption levels. Compared with other countries with a simpler water pricing structures, it seems that the difficulties experienced by customers in understanding its complex structure do not prevent consumers from reacting to price. Water users are often only aware of the existence of the mechanism of price escalation and they adopt expected (saving) behaviors, as in Jordan where the water pricing structure is also difficult to understand. 0 0,05 0,1 0,15 0,2 0,25 0,3 0,35 0 0,2 0,4 0,6 0,8 1 1,2 1990 ‐20 10, c o a st al r e gi o n s [1] 1990 ‐20 10 , n o n c o a st al r e gi o n s [1 ] 1980 ‐20 08, L T, < 40m ³/ q u ar te r [ 2] 1980 ‐20 08, L T, > 40m ³/ q u ar te r [ 2] 19 81 ‐1 9 9 5, C a sa b la n ca [ 3] 1997 ‐ 20 08, B ej ai a , l o w ‐w ag e h h [ 4] 1997 ‐ 20 08, B ej aia , h ig h ‐w a ge h h [ 4] 2009 , 4 c it ie s: lo w ‐i n co m e h h [ 5] 2009 , 4 ci ti e s: m id d le ‐i n co m e h h [ 5] 2009 , 4 c it ie s: h ig h ‐i n co m e h h [ 5 ] 2002 , B a sin , lo w ‐in co m e h h [ 6 ] 2 0 02 , B a si n , m idd le ‐i nc om e hh [ 6] 2002 , Ba si n , h ig h ‐i n co m e h h [6 ] 2003 , n at io n al [ 7]
Tunisia Morocco Algeria Egypt Jordan
A ver age p ri ce U SD /m ³ Abs ol u te va lue of p ri ce el a sti ci ty Price elasticity Average price into force US$ (Exchange rate 31/01/2014)
Source: [1] (Sebri, 2013) [2] (Ben Zaied and Binet, 2015) [3] (Lahlou and Colyer, 2000) [4] (Kertous,
2012) [5] (USAID Egypt - Water Policy and Regulatory Reform, 2012) [6] (Tabieh et al., 2012) [7] (Salman, Al-Karablieh and Haddadin, 2008)
14
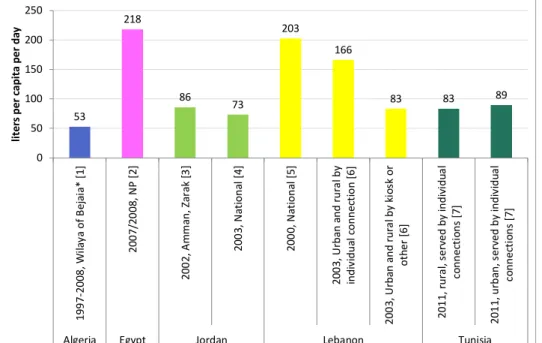
7.3. Comparing water consumption levels
To take the analysis of the level of water saving incentive a step further, we look both at water consumption trends and levels. Expressed in terms of daily consumption per capita, water uses in Tunisia appear in line with the average for the sub-region, while those in Lebanon and Egypt, where tariff policies historically provide very few incentives to conserve water, are the highest (Figure 7). 53 218 86 73 203 166 83 83 89 0 50 100 150 200 250 19 9 7‐ 20 08 , W ilay a o f B ej ai a* [ 1] 2 007 /2 00 8, N P [ 2] 200 2, A m m an , Z ar ak [ 3 ] 200 3, N at io n al [ 4] 200 0, N at io n al [ 5] 200 3, U rb an a n d r u ra l b y indi vi du al c on nec ti o n [6] 20 0 3, U rba n a nd ru ra l by k io sk o r ot h er [6] 20 1 1, rur al , s er ve d by indi vi du a l co nn ec ti on s [7 ] 2 01 1 , u rba n , s er ve d by in d iv id ua l co nn ec ti on s [7 ]
Algeria Egypt Jordan Lebanon Tunisia
lit er s p er c ap it a p e r d ay
Sources: [1] (Kertous, 2012) [2] (USAID Egypt - Water Policy and Regulatory Reform, 2012) [3] (Tabieh et al., 2012) [4] (Salman, Al-Karablieh and Haddadin, 2008) [5](Geara et al., 2010) [6] (ICEA-Corail-IPSOS-Stat 2003) [7] (SONEDE, 2016)
Figure 7. Individual consumption (liters per capita per day)
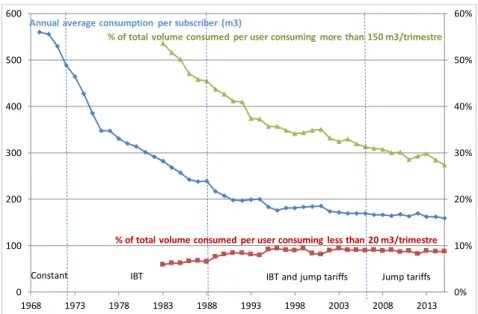
In Tunisia, we observe since 1968 a continuing fall in unit consumption of households connected to the public water supply network (Figure 8). Billing records enable to attribute this decrease to the decline in the water consumption level of large consumers (in share and in volume) from the 1980s. Large-volume consumers were the most affected by tariff reforms because of tariff rate increases (much higher in the upper blocks) but especially with the transition from an IBT to an IRT. This drop in consumption, particularly acute for large consumers, is thus probably due to the tariff increase, confirmed by the price sensitivity of these consumers (Figure 6). However, this lower of network water consumption does not always imply water-saving behaviors, as some users mobilize alternative water supply, such as groundwater (Touzi, Barraqué, and Treyer, 2010).
15 0% 10% 20% 30% 40% 50% 60% 0 100 200 300 400 500 600 1968 1973 1978 1983 1988 1993 1998 2003 2008 2013
Constant IBT IBT and jump tariffs Jump tariffs
% of total volume consumed per user consuming more than 150 m3/trimestre Annual average consumption per subscriber (m3)
% of total volume consumed per user consuming less than 20 m3/trimestre
Source: adapted from Ben Mansour (2016)
Figure 8. Annual average consumption per subscriber (left), share of consumed water volume by user consuming less than 20 m3 and more than 150 m3 (right)
Finally, a criticism that can be leveled at the existing water pricing policy in Tunisia is related to the tariff equalization principle. It sets out to apply a unique tariff in Tunisia, without giving information on local water scarcity or cost. While this policy seems to be relevant for remote areas (to maintain the population there), it can be problematic for coastal areas, where there is not enough water to cover needs, leading them to import water from distant regions or produce (through desalinization plants) at higher costs. These coastal areas are characterized by a high proportion of economically healthy users (such as tourists or industries) who could afford higher prices (Touzi, Barraqué, and Treyer, 2010). The Tunisian authorities are still strongly committed to the principle of tariff unity because water is considered a national unifying element. Water is not the only commodity subjected to a single national tariff; the same policy applies for oil, electricity, transport, telecom, health services, and commodities such as milk, wheat, bread, and even bottled water. However, to avoid the introduction of regional discrimination, which would be brought about by regional tariffs, the Tunisian authorities are studying the introduction of a special desalination tax to be applied exclusively in the regions concerned and for non-domestic users.
8. Part 4: Improved guaranteed water access to all except for non‐
TWU households
To assess whether the Tunisian water pricing system guarantees access to all, several indicators can be analyzed: the water pricing structure itself, the affordability of the water bill, and the population concerned by the access policy.
16
8.1. Water access guaranteed by low‐price levels for the first cubic meters
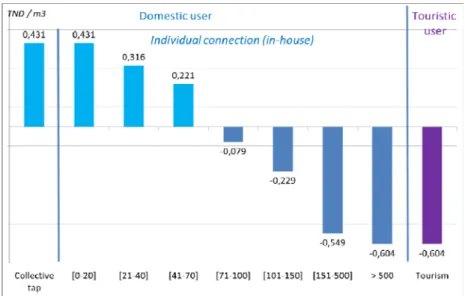
Guaranteeing access to all, in particular when a large number of people need support, as in developing countries, is often done through the adoption of a progressive tariff structure, which either allows every water user to benefit from the first essential cubic meters at a low rate (as in the conventional IBT structure) or applies only to small consumers (as in a IRT structure). This is the case in Tunisia but also in Egypt, Algeria, Jordan, and Lebanon; all of them apply very low rates, clearly motivated by the State authorities’ social policy goals.The TWU applies a low tariff to domestic users consuming less than 20 m3 per quarter (0.236
TND against 0.384 for the next band and 1.552 for the highest in 2016 – including VAT) leading to a high level of cross-subsidies between types of water users (Figure 9). The same is observed for the sewer part (0.024 TND against 0.195 for the next block and 0.742 to the highest in 2016).
Source: Ben Mansour (2016)
Figure 9. Water price cross-subsidies between users and level of water consumption in 2014 for TWU (excluding the sewage part)
This first level is sufficient to reach the objective of guaranteeing access to all. The same applies to the size of the band (20 m3/quarter, that is 80 m3/year), which enables the satisfaction of
essential households needs (estimated at between 6 and 10 m³ per month in Mediterranean countries), as recommended by Boland and Whittington (2000). The average number of people per household is 3.9 in 2014 (data from National Census Survey, (INS, 2016a)) and this first band corresponds effectively to a household. The Tunisian situation thus seems different from what is observed, for instance, in Amman (Jordan) where the first block is not properly designed to meet the poorest households’ needs: a high part of respondents to a survey (46%) pay up to three times
17
the minimum charge and 14% regularly pay more than ten times the cost of the lifeline (Gerlach and Franceys, 2009).
Yet, the average price paid in Tunisia by a household staying in the first band is higher than a household reaching the second band due to the fixed part (5.959 TND in 2016 per quarter – including VAT): sewer excluded, the average price for a 10 m3/quarter is 0.832 TND/m3 against
0.582 for a 30 m3/quarter water consumption (see also Figure 5 for an extended analysis covering
all consumption levels and with or without sewerage). Water access can be preserved due to the possibility to make use of a collective tap, where water is priced only at the first marginal price (0.236 TND/m3 in 2016)6.
8.2. Water access evaluated through an affordability measure and preliminary
equity assessment
Affordability is generally assessed by index measuring water and sanitation expenditures as a percentage of available household budgets. In this paper, we discuss the affordability of regular water consumption charges and not affordability of water service connection fees. In Tunisia, in 2016, the minimum wage is around TND 300 per month for 40 hours per week (TND 1.671 per hour). Total expenditure was estimated at around TND 1.300 per month per household7 (INS,
2016b). Sebri (2015) used secondary data from 2005 to 2010 to calculate affordability indexes for each governorate. We found that the average affordability index does not exceed 1.5% in each region. According to a national survey, the average water expense represents 0.9% of income for piped households (INS, 2010).
There is no a unique universal reference value above which the service is considered as unaffordable, which would trigger the implementation of measures to improve water access. Smets (2008) proposes several ways to help in making a choice on this rate: (1) economic rationality (consistent with the calculation of thresholds triggers for social aid); (2) an analogy with affordability indices observed in neighboring countries; (3) recommendations from international organizations (UNDP: 3%; OECD and EU: 4%; AFDB: 5%); (4) equity with respect to other households.
Because of this lack of universal reference, we need to benchmark the Tunisian case, with the first benchmark at the global level (Table 3).
6 At this level, we make the surprising observation that these collective taps were priced at the lowest block only
from 1999 (Table 10).
18
Median households Poor households
Industrialized countries 1.1% 2.6%
Countries in transition EU members 2.5% 6.0%
Outside EU 1.0% 2.4%
Developing countries Latin America 2.5% 6.0%
Africa 2.8% 7.0%
Source: Smets 2008, Table 8, page 62
Table 3 Affordability indexes observed in the world
The second benchmark can be derived from studies carried out in Mediterranean countries. In Egypt, in 2007/2008, a study revealed that on average households do not spend more than 0.8% of their total household expenditures for water consumption of about 220 liters per capita per day (LCD) ((USAID Egypt - Water Policy and Regulatory Reform, 2012). In Jordan, a study conducted on 600 households in 2003 shows that the mean bill represents 0.9% of total expenditure for a household, for consumption of 12.5 m³/month (Salman, Al-Karablieh and Haddadin, 2008). Another study revealed that piped households in Lebanon spend 2.1% of their income on average (ICEA-Corail-IPSOS Stat, 2004). The mean values observed in Tunisia appear relatively low compared to the affordability ratios in other regions as proposed by Smets (2008) and at the same level as other Mediterranean countries.
Affordability indexes also need to be considered for different income levels, because average values may hide broad disparities relating to poverty. The point here is to ensure that water bills are affordable for poor households and, when compared to the weight of water bills for wealthier households, to measure the equity of the tariff, which may thus constitute a criterion in assessing a tariff schedule (Nauges and Whittington, 2017). According to the national survey, the affordability index reaches 1.2% for the poorest 10% of households compared to 0.6% for the richest (INS, 2010).
Table 4 depicts the results of a study recently conducted in Central Tunisia in the Kairouan governorate (Favre and Montginoul, 2017), the poorest governorate of the country (INS, 2016b) on a small sample. It reveals a global affordability index of 1.3% for piped households, but the poorest 20% of households spend 2.1% of their income on water consumption compared with 0.8% for the richest 20%. This range appears reasonable (especially since we are focusing on the poorest governorate of the country), and the ratio remains, even for the poorest households, below 3%. To meet these ratios, the poorest households must restrict their consumption to a minimum level of 80 LCD, which is in line with the basic water needs estimated at around 72 LCD for households in Tunisia (Sebri, 2015) and with the minimum level of 50 to 100 LCD of water
19
needed to ensure most basic needs and prevent from health concerns recommended by the World Health Organization (United Nations, 2014).
Unity quintile 1st 2nd quintile 3rd quintile 4th quintile 5th quintile Total
Number of households hh 58 57 57 57 57 286 Average monthly total expenses TND/hh/ month 611 933 1303 1 906 3 399 1 627 Average quarterly consumption m 3/hh/qu arter 27.6 31.5 32.8 33.2 34.3 32.0 Average daily consumption per person Liter/cap ita/day 80 95 84 88 88 87 Quarterly water bill TND/hh/ quarter 16.7 18.5 22.2 20.6 21.2 19.9 Affordability index % 2.07% 1.40% 1.41% 1.02% 0.75% 1.32%
Source: Authors calculation
Table 4 Water bill amount, consumption and affordability index (286 piped-households, observed bills during 4 consecutive quarters in 2013/2014)
To further assessing the equity of the tariff schedule, we follow the approach of Nauges and Whittington (2016). We analyze the distributional effects of the water pricing policy on the subsample by measuring the share of the subsidies that goes to the poorest income quintile (Table 5). Even if, on average, the richest households consume more than the poorest (remember that the positive correlation between household income and water use is one of the main assumptions made by IBT structures in order to ensure the principle of cross-subsidization from rich to poor households), too few households consume in the upper blocks where the average tariff covers the average cost (i.e., above 70 m3/quarter). Even then, their surplus in consumption compared to
poor households results in the allocation of greater subsidies to them (on average 37 TND/household/year against 28 TND/household/year).
Unity quintile 1st quintile 2nd quintile 3rd quintile 4th quintile 5th Total
Number of
households hh 58 57 57 57 57 286
Part of
subsidized bills received bills % of annual 90% 90% 88% 86% 91% 89% Total subsidies distributed TND 1,612 2,066 1,560 1,985 2,127 9,350 Total subsidies distributed % of total subsidies 17% 22% 17% 21% 23% 100% Average subsidy
per household TND / hh/ year 28 36 27 23 37 33
20
Table 5 Subsidies for each income quintile (286 piped-households, observed bills during 4 consecutive quarters in 2013/2014)
8.3. Water access and dual water supply in rural areas
The analysis above is valid in case of an individual connection to the TWU; that is for all urban areas and half of the rural areas. In other rural areas, the water service is mainly managed by users' associations (UA), and the supply is provided through collective taps. The situation also differs from one region to another. Eastern coastal areas, with their concentration of tourist infrastructures, and the capital usually enjoy a high-water service delivery; more households are connected and more households with an in-house tap water connection. Remote western areas are less well served, more usually through water UAs. However, much effort in Tunisia has been devoted to providing access for most of the population (Table 6 and Figure 10). Since 1980, all households in urban areas have had access to water, and today, in nearly all cases this is via an in-house connection. Water delivery in rural areas through TWU has continuously increased (delivering 43% in 2002 and 51% in 2015).
Urban Rural Total Urban Total Urban Rural Total
Water manager TW TWU UA Total
2002 Capital area 21% 2% 23% 100% 82% 13% 95% 100% 98% 75% 96% North-West 5% 8% 12% 100% 28% 42% 71% 81% 97% 26% 54% Central-west 4% 9% 14% 100% 27% 57% 83% 89% 95% 24% 48% South-West 4% 2% 6% 100% 62% 32% 94% 98% 98% 58% 86% North-East 8% 5% 14% 100% 45% 41% 87% 95% 95% 41% 76% Central-East 16% 6% 22% 100% 59% 32% 91% 97% 97% 50% 85% South-East 7% 3% 9% 100% 64% 30% 94% 98% 94% 55% 83% Total 65% 35% 100% 100% 43% 41% 84% 94% 97% 38% 78% 2015 Capital area 22% 2% 24% 100% 87% 12% 99% 100% 100% 84% 99% North-West 4% 6% 11% 100% 38% 53% 90% 94% 99% 34% 62% Central-west 5% 8% 13% 100% 27% 61% 88% 92% 99% 26% 53% South-West 4% 2% 5% 100% 68% 31% 98% 100% 100% 65% 89% North-East 9% 5% 14% 100% 53% 39% 92% 97% 99% 51% 83% Central-East 17% 6% 24% 100% 69% 28% 97% 99% 100% 62% 90% South-East 7% 2% 9% 100% 76% 20% 96% 99% 99% 70% 92% Total 68% 32% 100% 100% 51% 41% 93% 98% 100% 48% 84%
Population proportion (of the
annual population) Drinking water supply rate In-house tap water connection rate Rural
Source: Direction des statistiques et de la planification de la SONEDE 2016
21
Source: adapted from Ben Mansour (2016)
Figure 10. Drinking water supply and in-house tap water connection rates in Tunisian urban and rural areas from 1968 to 2015
This observation, however, hides a trend consisting of substituting UAs for the TWU. This can easily be observed in Table 6 for the eastern cases, where the level of connection is increasing, in total and for the TWU, and decreasing for UAs. This also explains the increase in individual water service connection rates. This trend is due to two main reasons. First, the TWU delivers better service in terms of water quality at the individual connection. Second, the level of water price is lower with the TWU than with UAs which pursue a single objective, which is to balance budgets at their local level. These users, who in 2015 represented 14% of the Tunisian population (1.5 million inhabitants) do not have the opportunity to benefit from the cross-subsidy principle (Touzi, Barraqué, and Treyer, 2010). They pay from 0.2 TND/m3 to 1.5 TND/m3 (SONEDE and
SCET-Tunisie, 2015) compared with the marginal first-price level implemented by the TWU for collective taps which is at 0.14 TND/m3.
9. Part 5: Difficulty in cost recovery for lack of large‐volume water
consumers and a challenging political agenda
Finally, Tunisian national water pricing aims to recover costs8. While this objective has been
reached in the past, the situation has been progressively worseningFigure 11) since the early 2000s (Figure 15). The revenue does not cover the increasing cost, thus inducing a growing deficit. The average long-term water cost in current terms is displayed in the following graph. It
22
includes operation and maintenance (O&M), and the cost of replacement and rehabilitation of existing capital assets. In 2015, it reached TND 0.820 /m3 compared to TND 0.575 /m3 for the
water average unit revenue.
0,398 0,820 0,423 0,575 106% 70% 0,0 0,2 0,4 0,6 0,8 1,0 1,2 0,3 0,4 0,5 0,6 0,7 0,8 0,9 1995 2000 2001 2002 2003 2004 2005 2006 2007 2008 2009 2010 2011 2012 2013 2014 2015 Average long‐term water cost Average unit revenue Ratio of cost coverage TND/m3 Ratio of cost coverage Balanced budget
Source: adapted from Ben Mansour (2016)
Figure 11. TWU Water service average cost, average unit revenue tariff, and the ratio of cost coverage (revenue divided by cost) from 1995 to 2015
This rising budget deficit is due to two main factors. First, tariff increases have not been sufficient to offset the rise in inflation since 2005 (see Figure 2). A notable decline has been observed since 2000s. In constant 2000 terms, water bills were at 9.09 TND (excluding VAT) in 2000 as against 7.89 in 2010, corresponding to a 13% decrease. Second, the levels of bands and tariff rates do not match the consumption distribution curve to balance the water utility budget. As demonstrated in Table 7, the three first levels of tariff do not reach the average water cost faced by the water manager; this is also true of the fourth level, but this is compensated for by the presence of the fixed part. If we add the volumes consumed for these three first levels and that consumed by households connected only through a collective tap, it corresponds to roughly 60% of the total volume consumed, which can be compared to 30% of the revenue.
23
Usages m3 consumed
Jump tariff
(TND/m3) % of volume consumed % of subscribers % of water receipts
2014-2015 2014 2015 2014 2015 2014 2015 Domestic + industries + other 0-20 (J1) 0.155 8.8% 8.8% 40.9% 40.4% 2.3% 2.4% 21-40 (J2) 0.270 22.3% 22.7% 30.6% 30.7% 10.3% 10.7% 41-70 (J3) 0.365 24.2% 24.5% 19.9% 20.1% 15.1% 15.5% 71-100 (J4) 0.665 10.4% 10.8% 5.1% 5.3% 11.8% 12.5% 101-150 (J5) 0.815 5.8% 6.0% 2.0% 2.0% 8.0% 8.5% 151-500 (J6) 1.135 6.7% 6.8% 1.2% 1.2% 12.9% 13.5% >500 (J7) 1.190 15.5% 14.6% 0.3% 0.3% 31.5% 30.2% Sub-Total 93.7% 94.2% 99.9% 99.9% 91.9% 93.3% Domestic non connected (J1) 0.155 2.7% 2.9% 0.03% 0.03% 0.7% 0.8% Tourism (J7) 1.190 3.6% 2.8% 0.06% 0.05% 7.4% 5.9% Total 100.0% 99.9% 100.0% 100.0% 100.0% 100.0% Average cost (TND/m3) 2014 2015 0.795 0.820
Source: Direction des statistiques et de la planification de la SONEDE 2016
Table 7. Weight of the different users in terms of volume consumed, subscribers and receipts in 2014 and 2015 for the TWU
Revenues depend too heavily on the presence of the largest volume water users, which are continuously decreasing as illustrated in Figure 8. Two main reasons explain this trend. First, these consumers have the highest price sensitivity, except for tourists. This high sensitivity is also due to the real cost-effectiveness of investing in a substitute for the public network supply, e.g., by drilling tube wells, as observed by Limam (2007) and by Touzi et al. (2010). The second reason can be found in the type of subscribers among the large consumers or consumers who are facing the highest prices (due to the special tariff applied to tourist subscribers). These users are sensitive to economic and tourist wealth, as highlighted by Baouab and Cherif (2016) with regard to the impact on tourism of the 2011 democratic revolution. As an illustration, we can compare 2014 and 2015. Due to security problems, the tourism sector has experienced a severe decline (Table 6), which is translated in a fall of 19% in the number of night and a decrease in water consumption of 20% and utility revenue of 35%. This trend explains why the tourism share of revenue fell from 7.4% to 5.9% (Table 7). However, compared with the number of beds used, water consumption has only diminished by 10% and even increased in terms of occupied beds (+44%). We assume that if this tendency continues, the number of hotels will also fall, contributing to a greater and longer-lasting effect on water consumption and sales revenues.
24 Hotels (number) Nights (number in million) Occupan-cy rate
Liters per bed and day Water con-sumption (Mm3) Receipts (billions of TND) Exploited Occupied 2014 858 20,1 45% 239 533 15,5 3,626 2015 862 16,2 28% 214 767 12,4 2,355 Trend 0% -19% -38% -10% 44% -20% -35%
Source: calculated from Direction des statistiques et de la planification de la SONEDE 2016
Table 8. Evolution of Tunisian tourism activity between 2014 and 2015 and impact on water sector
This observation can be refined at the regional level. The decline in tourism is more significant in the South coastal region (-24.5%) than in the capital (-8.1%). However, coastal areas concentrated all their efforts to deliver water for tourist and industrial purposes (through expensive water transfer infrastructures from the North and Northwest and desalination plants). Those places with the highest supply costs are now facing the largest water consumption decreases, not because of a pricing policy reflecting the true value of water, but because of the economic and tourist crisis. This can be seen as the main limitation of the application of a national tariff averaging-out principle already called into question by Touzi et al. (2010).
The cost-recovery objective is thus being met less and less in Tunisia and compromises the economic wealth of the TWU. The first impact can be seen in the efficiency ratio of the water distribution network, which decreased from 84% in 2005 to 77% in 2015. It can also be seen with the number of workers per subscribers, which can be a good proxy of the level of service (Figure 12), except that it is also a good indicator of productivity gains. All of this may lead to sustainability problems, which can induce degradation of service: lower water quality, water supply interruptions, etc. Of course, the cost recovery ratio could also be improved by better cost control and need not exclusively take the form of an increase in the average tariff (see Mellah and Ben Amor (2016), who identified many factors to explain the evolution of TWU’s performances).
25
Source: calculated from Direction des statistiques et de la planification de la SONEDE 2016
Figure 12. Evolution of the number of employees compared to volume produced and subscribers
This unbalanced situation, however, is not exceptional in Southern Mediterranean countries, where prices in force seem insufficient to meet the cost recovery objective in most cases. In Algeria, based on five studies conducted from 2002 to 2012, Boukhari and Djebbar (2013) conclude that far from enabling full-cost recovery (including investment and O&M), water prices are not even sufficient to cover operating costs. In Egypt, in 2009/2010 only four regional companies out of fourteen recovered operational and maintenance costs from operating revenues (USAID Egypt, Water Policy and Regulatory Reform, 2012). The same can be said for Jordan and Lebanon, where tariffs are too low even to cover operating and maintenance costs (Chatila, 2005; Gerlach and Franceys, 2009). In Morocco, to reach its operating balance, the national operator implemented two national solidarity taxes in 1985 and 1998. These taxes are charged on raw water sold by the national operator to municipal utilities and private companies in the largest cities outside its perimeter (Tenneson and Rojat, 2003). Due to these subsidies, the operator did not need operating grants from the State for a few years, but in the 2000s it became difficult to maintain the financial equilibrium and even more so to meet new objectives set by the State, including a significant increase in water service rate and development of sewerage.
10. Conclusion
The water pricing structure adopted by Tunisia is quite uncommon in the Mediterranean region. It has been designed to reach the three main objectives pursued by TWU simultaneously, that are, cost recovery, in-house water access for all, and an incentive to conserve water. Reforms applied
26
over the years gradually led to a relatively stable equilibrium that partially achieves these objectives. The low price level of the first block makes in-house water accessible for all, reinforced by a block size reflecting the number of people in the household. It is compensated by the IRT structure, which strongly encourages users to conserve water.
However, several criticisms can be leveled at the scheme.
First, it does not meet the criterion of economic efficiency. This pricing structure leads, at each block crossing, to greatly increase the household bill and average price, whereas water costs (marginal or average) do not follow such jumps. Such tariff structures do not signal to users the actual cost of water.
Second, the cost-recovery principle depends heavily on the presence of large-volume water consumers (which contradicts the water conservation objective), and also on the support of the Government, which controls the price level of water services. Ultimately, it is the politicians who finally decide whether or not to raise water prices to balance the water budget, since any change must be jointly agreed upon between the Ministry of Agriculture and the Treasury because of the national tariff status. As this is viewed as an unpopular measure, politicians usually prefer to "bargain" by postponing the increase or accepting lower rises than necessary to balance the water budget. This reluctance is reinforced in the present period of social and economic crisis. Political pressures on water operators or direct policy interventions on tariff policies are a well-known issue in the water sector, and perhaps especially in developing countries (Dinar, 2000; Ménard, 2001).
Third, the affordability principle is only achieved for households connected to the TWU. Among them, equity could be improved. The analysis of distributional effects showed that the weight of the water bill is currently far more important for the poorest than for the richest households, even though it may still be considered affordable for them, while their consumption is far less subsidized than that of the richest households.
Fourth, the averaging-out principle does not indicate the real cost of delivering water in some areas or to some users, leading to disadvantageous local solutions that would otherwise have been created (Hourcade et al., 1990). To address this issue, a current strand of literature proposes water rate models that internalize the local scarcity value of water (see for instance Molinos-Senante and Donoso 2016).
Lastly, the water pricing structure in its current form is unsatisfactory when a sewer charge is added. The two national operators implement two tariff structures. The water company has adopted a binomial IRT structure, whereas the sewerage company has a binomial structure with a
27
differentiated fixed part and a mixture of an IBT and IRT structure. These structures do not facilitate the understanding of price levels that users face for different levels of consumption.
In short, the national IRT structure adopted in Tunisia may be well suited to a lower middle-income country with a large proportion of poor people that hopes to universally connect the population to in-house water and conserve scarce resources. It is affordable only if poor households do not consume at levels in the expensive upper-blocks, that is, when the number of people per household is limited, as it is the case in Tunisia which is completing the demographic transition (INS, 2016c). In developed countries, where the poor population represents a small proportion of water users, it seems more efficient to target help to the poor by actions taken "outside of the bill." This can be done, for instance, through the delivery of "water cheques" to an identified low-income population (Barraqué and Montginoul, 2015), the application of a special discount to water tariffs to low income families, as in Spain (Calatrava et al., 2015), or by taking the cost of living problems nationally without separating payment difficulties, as in Northern European countries (Norway, Sweden, Denmark, and Germany). But these options assume that households in need to be identified and accept help, and imply administration costs.
11. Acknowledgments
This study was carried out within two research projects financed by ANR programs: Arena (ANR-11-CEPL-0011) and Amethyst (ANR-12-TMED-0006-01) through IRSTEA and CIRED research institutes. The authors are especially grateful to Mr. Ben Mansour (SONEDE), Bernard Barraqué (CNRS – CIRED – AgroParisTech), Sylvy Jaglin (LATTS) and Céline Nauges (INRA-TSE) for their detailed comments and helpful advice for the writing if this article. The authors also express sincere thanks to the anonymous reviewers and to the editor for their precious comments and their dedication throughout the review process.
28
12. Appendix
Country Source
Algeria: Alger, Oran,
Constantine ADE, Algérienne des eaux. Tarification [on line]. Available at < http://www.ade.dz/index.php/tarification> (29/04/2016). Egypt, Great Cairo IBNET Tariff database. Available at <
http://tariffs.ib-net.org/ViewTariff?tariffId=2254&countryId=141> (26/04/2016). Jordan, governorates managed
by public companies WAJ, Water Authority of Jordan. Water Prices [online]. Available at
<http://www.waj.gov.jo/sites/en-us/Documents/Water%20and%20Wastewater%20Tariff%20for%20Quarterly%20Bills %20for%20Governorates%20which%20are%20Managed%20by%20Companies%2020 16.pdf> (29/04/2016).
Lebanon, Beyrouth and
Mont-Liban EBLM, Establishment of The Water of Beirut and Mount Lebanon. News and Memorandum>Concerning the implementation of new fees and tariffs [on line]. Available at <http://www.ebml.gov.lb/english/adminmemorandum4> (29/04/2016). Morocco, national operator
small centers
ONEE Office National de l’Eau et de l’Electricité ONEE. Espace Client>Facturation>Les tarifs à la consommation [online]. Available at < http://www.onep.ma/> (26/04/2016).
Morocco, municipal utility of
Marrakech RADEEMA Régie Autonome de Distribution d’Eau et d’Electricité de Marrakech. Espace Client>Guide Tarification [online]. Available at < http://www.radeema.ma/tabid/256/tabid/36/tabid/256/Default.aspx > (26/04/2016). Morocco, Lydec Casablanca LYDEC Lyonnaise des eaux de Casablanca. Accueil>Vous êtes>Particuliers>Tranches
de facturation et tarifs [online]. Available at <
https://client.lydec.ma/site/fr/web/guest/tranches-de-facturation-et-tarifs> (26/04/2016). Tunisia, national operator
centres SONEDE Tunisie. Espace client > Tarification de l’eau potable [online]. Available at < http://www.sonede.com.tn/index.php?id=111> (26/04/2016). ONAS Office National Available [online]. Available at <
http://www.onas.nat.tn/En/fr/image/pdf/Tarification.pdf> (26/04/2016).
Turkey, Ankara ASKI, ASKİ Genel Müdürlüğü - Ankara Su Kanalizasyon İdaresi. Available at < http://www.aski.gov.tr/Yukle/dosya/tarife_ucret/Tarife.pdf > (29/04/2016).
Table 9: Data collection for panel benchmark
13. References
Agthe, D. E. et Billings, R. B. (1987) « Equity, Price Elasticity, and Household Income Under Increasing Block Rates for Water », American Journal of Economics and Sociology, 46(3), p. 273‑286.
Baouab, M. H. et Cherif, S. (2016) « Revolution Impact on Drinking Water Consumption: Real Case of Tunisia », Social Indicators Research.
Barraqué, B. et Montginoul, M. (2015) « How to integrate social objectives into water pricing? », in Dinar, A., Pochat, V., et Albiac, J. (éd.) Water Pricing Experiences and
Innovations. Springer International Publishing, p. pp 359-371. doi:
10.1007/978-3-319-16465-6_18.
Boiteux, M. (1956) « La vente au coût marginal », Revue française de l’énergie, VIII(81), p. 113‑117.