HAL Id: halshs-00961642
https://halshs.archives-ouvertes.fr/halshs-00961642
Submitted on 20 Mar 2014
HAL is a multi-disciplinary open access
archive for the deposit and dissemination of
sci-entific research documents, whether they are
pub-lished or not. The documents may come from
teaching and research institutions in France or
abroad, or from public or private research centers.
L’archive ouverte pluridisciplinaire HAL, est
destinée au dépôt et à la diffusion de documents
scientifiques de niveau recherche, publiés ou non,
émanant des établissements d’enseignement et de
recherche français ou étrangers, des laboratoires
publics ou privés.
cover-climate feedbacks
M.J. Gaillard, S. Sugita, Florence Mazier, A.-K. Trondman, Anna Brostrom,
T. Hickler, J.O. Kaplan, E. Kjellström, U. Kokfelt, P. Kunes, et al.
To cite this version:
M.J. Gaillard, S. Sugita, Florence Mazier, A.-K. Trondman, Anna Brostrom, et al.. Holocene
land-cover reconstructions for studies on land land-cover-climate feedbacks. Climate of the Past, European
Geosciences Union (EGU), 2010, 6, pp.483-499. �10.5194/cp-6-483-2010�. �halshs-00961642�
www.clim-past.net/6/483/2010/ doi:10.5194/cp-6-483-2010
© Author(s) 2010. CC Attribution 3.0 License.
of the Past
Holocene land-cover reconstructions for studies on land
cover-climate feedbacks
M.-J. Gaillard1, S. Sugita2, F. Mazier3,4, A.-K. Trondman1, A. Brostr¨om4, T. Hickler4, J. O. Kaplan5, E. Kjellstr¨om6, U. Kokfelt4, P. Kuneˇs7, C. Lemmen8, P. Miller4, J. Olofsson4, A. Poska4, M. Rundgren4, B. Smith4, G. Strandberg6, R. Fyfe9, A. B. Nielsen10, T. Alenius11, L. Balakauskas12, L. Barnekow4, H. J. B. Birks13, A. Bjune14, L. Bj¨orkman15, T. Giesecke10, K. Hjelle16, L. Kalnina17, M. Kangur2, W. O. van der Knaap18, T. Koff2, P. Lager˚as19, M. Latałowa20, M. Leydet21, J. Lechterbeck22, M. Lindbladh23, B. Odgaard7, S. Peglar13, U. Segerstr¨om24, H. von Stedingk24, and H. Sepp¨a25
1School of Pure and Applied Sciences, Linnaeus University, 39182 Kalmar, Sweden 2Institute of Ecology, Tallinn University, 10120 Tallinn, Estonia
3GEODE, UMR 5602, University of Toulouse, 5 all´ee A. Machado, 31058 Toulouse Cedex, France 4Department of Earth and Ecosystem Sciences, Lund University, S¨olvegatan 12, 223 62 Sweden 5ARVE Group, Ecole Polytechnique F´ed´erale de Lausanne, Station 2, 1015 Lausanne, Switzerland 6Swedish Meteorological and Hydrological Institute, 60176 Norrk¨oping, Sweden
7Institute of Earth Sciences Aarhus University C. F. Møllers All´e 4, 8000 ˚Arhus C, Denmark
8Institute for Coastal Research, GKSS-Forschungszentrum Geesthacht GmbH, 21502 Geesthacht, Germany 9School of Geography, Earth and Environmental Sciences, University of Plymouth, Plymouth, UK
10Department of Palynology and Climate Dynamics Albrecht-von-Haller-Institute for Plant Sciences, University of
G¨ottingen, Untere Karsp¨ule 2, 37073 G¨ottingen, Germany
11Institute of Cultural Research, Department of Archaeology, P.O. Box 59, 00014 University of Helsinki, Finland
12Department of Geology and Mineralogy, Faculty of Natural Sciences, University of Vilnius, ˇCiurlionis Street 21/27, 03101
Vilnius, Lituania
13Department of Biology, University of Bergen, P.O. Box 7803, 5020 Bergen, Norway and School of Geography and the
Environment, University of Oxford, Oxford OX1 3QY, UK
14Bjerknes Centre for Climate Research, Department of Biology, University of Bergen, Allegat´en 41, 5007 Bergen, Norway 15Viscum pollenanalys and milj¨ohistoria c/o Leif Bj¨orkman, Bodav¨agen 16, 571 42 N¨assj¨o, Sweden
16Bergen Museum, University of Bergen, P.O. Box 7800, 5020 Bergen
17Faculty of Geography and Earth Sciences, University of Latvia, Rainis Blvd 19, 1586 Riga, Latvia 18Institute of Plant Sciences, University of Bern, Altenbergrain 21, 3013 Bern, Switzerland
19Swedish National Heritage Board, Department of archaeological studies, UV Syd, Odlarev¨agen 5, 226 60 Lund, Sweden 20Laboratory of Palaeoecology and Archaeology, University of Gda˜nsk, Al. Legionw 9, 80441 Gda˜nsk, Poland
21CEREGE – UMR CNRS 6635, Universit´e Paul C´ezanne, Aix- Marseille III, BP 80 Europˆole M´editerran´een de l’Arbois, 13
545 Aix-en-Provence Cedex 4, France
22Landesamt f¨ur Denkmalpflege, Arbeitsstelle Hemmenhofen, Labor f¨ur Arch¨aobotanik, Fischersteig 9, 78343
Hemmenhofen, Germany
23Institutionen f¨or sydsvensk skogsvetenskap Southern Swedish Forest Research Centre, Swedish University of Agricultural
Sciences SLU, Box 49, 230 53 Alnarp, Sweden
24Department of Forest Ecology and Management, Faculty of Forestry, Swedish University of Agricultural Sciences SLU,
901 83 Ume˚a, Sweden
25Department of Geology, P.O. Box 64, 00014, University of Helsinki, Finland
Received: 16 February 2010 – Published in Clim. Past Discuss.: 11 March 2010 Revised: 4 June 2010 – Accepted: 22 June 2010 – Published: 26 July 2010
Correspondence to: M.-J. Gaillard
Abstract. The major objectives of this paper are: (1) to
review the pros and cons of the scenarios of past anthro-pogenic land cover change (ALCC) developed during the last ten years, (2) to discuss issues related to pollen-based recon-struction of the past land-cover and introduce a new method, REVEALS (Regional Estimates of VEgetation Abundance from Large Sites), to infer long-term records of past land-cover from pollen data, (3) to present a new project (LAND-CLIM: LAND cover – CLIMate interactions in NW Europe during the Holocene) currently underway, and show prelim-inary results of REVEALS reconstructions of the regional land-cover in the Czech Republic for five selected time win-dows of the Holocene, and (4) to discuss the implications and future directions in climate and vegetation/land-cover mod-eling, and in the assessment of the effects of human-induced changes in land-cover on the regional climate through al-tered feedbacks. The existing ALCC scenarios show large discrepancies between them, and few cover time periods older than AD 800. When these scenarios are used to as-sess the impact of human land-use on climate, contrasting results are obtained. It emphasizes the need for methods such as the REVEALS model-based land-cover reconstruc-tions. They might help to fine-tune descriptions of past land-cover and lead to a better understanding of how long-term changes in ALCC might have influenced climate. The RE-VEALS model is demonstrated to provide better estimates of the regional vegetation/land-cover changes than the tradi-tional use of pollen percentages. This will achieve a robust assessment of land cover at regional- to continental-spatial scale throughout the Holocene. We present maps of RE-VEALS estimates for the percentage cover of 10 plant func-tional types (PFTs) at 200 BP and 6000 BP, and of the two open-land PFTs “grassland” and “agricultural land” at five time-windows from 6000 BP to recent time. The LAND-CLIM results are expected to provide crucial data to re-assess ALCC estimates for a better understanding of the land suface-atmosphere interactions.
1 Introduction
Vegetation (land cover) is an inherent part of the climate system. Natural, primarily climate-driven, vegetation and ecosystem processes interact with human land-use to deter-mine vegetation patterns, stand structure and their develop-ment through time (e.g. Vitousek et al., 1997). The result-ing land surface properties feed back on climate by mod-ulating exchanges of energy, water vapour and greenhouse gases with the atmosphere. Terrestrial ecosystems may exert biogeochemical (affecting sources and sinks of greenhouse gases [GHG], aerosols, pollutants and other gases) and bio-physical (affecting heat and water fluxes, wind direction and magnitude) feedbacks on the atmosphere (e.g. Foley et al., 2003). These feedbacks may be either positive,
amplify-ing changes or variability in climate, or negative, attenuat-ing variability and slowattenuat-ing trends in climate. Carbon cy-cle feedbacks have received particular attention (Cox et al., 2000; Ruddiman, 2003; Friedlingstein et al., 2003; Meehl et al., 2007); however, biophysical interactions between the land surface and atmosphere can be of comparable impor-tance at the regional scale (Kutzbach et al., 1996; Sellers et al., 1997; Betts, 2000; Cox et al., 2004; Bala et al., 2007). These feedbacks represent a major source of uncertainty in projections of climate under rising greenhouse gas concen-trations in the atmosphere (Meehl et al., 2007). Therefore, the incorporation of dynamic vegetation into climate models to account for feedbacks and refine global change projections is a current priority in the global climate modelling commu-nity (Friedlingstein et al., 2003; Meehl et al., 2007; van der Linden and Mitchell, 2009). In this context, there is a grow-ing need for spatially explicit descriptions of vegetation/land-cover in the past at continental to global scales for the pur-pose of improving our mechanistic understanding of pro-cesses for incorporation in predictive models, and applying the data-model comparison approach with the purpose to test, evaluate and improve dynamic vegetation and climate mod-els (global and regional). Such descriptions of past land-cover would likewise help us to test theories on climate-ecosystem-human interactions and strengthen the knowledge basis of human-environment interactions (e.g. Anderson et al., 2006; Dearing, 2006; Denman and Brasseur, 2007; Wirtz et al., 2009).
Objective long-term records of the past vegetation/land-cover changes are, however, limited. Palaeoecological data, particularly fossil pollen records, have been used to describe vegetation changes regionally and globally (e.g. Prentice and Jolly, 2000; Williams et al., 2008), but unfortunately they have been of little use for the assessment of human impacts on vegetation and land cover (Anderson et al., 2006; Gail-lard et al., 2008). The development of databases of human-induced changes in land cover based on historical records, remotely-sensed images, land census and modelling (Klein Goldewijk, 2001, 2007; Ramankutty and Foley, 1999; Olof-sson and Hickler, 2008) has been useful to evaluate the ef-fects of anthropogenic land-cover changes on the past cli-mate (e.g. Brovkin et al., 2006; Olofsson and Hickler, 2008). However, the most used databases to date (i.e. the Klein Goldewijk’s database in particular) cover relatively short pe-riods. Recently developed scenarios of anthropogenic land cover change (ALCC) (Pongratz et al., 2008; Kaplan et al., 2009; Lemmen, 2009) include longer time periods. Notably, all these datasets show inconsistent estimates of land cover during key time periods of the past. Therefore, the devel-opment of tools to quantify and synthesize records of veg-etation/land cover change based on palaeoecological data is essential to evaluate model-based scenarios of ALCC and to improve their reliability.
The major objectives of this paper are: (1) to review the pros and cons of the ALCC scenarios developed by
-0.4 -0.2 0 0.2 0.4 1000 1100 1200 1300 1400 1500 1600 1700 1800 1900 2000 Year AD °C ECBILT-CLIO-VECODE MIT KNMI MOBIDIC CLIMBER UVIC
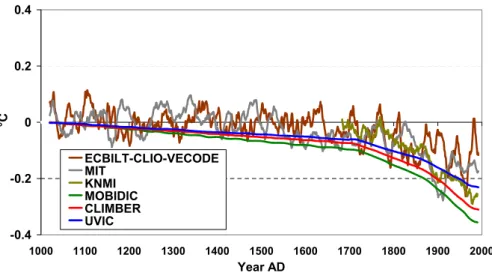
Fig. 1. Decrease in mean global temperature over the Northern Hemisphere due to the biophysical feedback (increased albedo) of an
estimated decrease in forest cover between AD 1000 and 2000 as simulated by six different climate models (see details on the climate models in Brovkin et al., 2006). Land-use changes were based on HYDE [History Database of the Global Environment] version 2.0 for the period AD 1700–2000, and on a constant rate of decrease in forest cover between 1000 and 1700 (from Brovkin et al., 2006; modified).
Ramankutty and Foley (1999), Klein Goldewijk (2001, 2007, 2010), Olofsson and Hickler (2008), Pongratz et al. (2008), Kaplan et al. (2009), and Lemmen (2009), (2) to discuss issues related to pollen-based reconstruction of the past vegetation/land-cover and introduce a new method (REVEALS [Regional Estimates of VEgetation Abundance from Large Sites], Sugita, 2007a) to improve the long-term records of vegetation/land-cover, (3) to present a new project (LANDCLIM: LAND cover – CLIMate interactions in NW Europe during the Holocene) currently underway and prelim-inary results, and (4) to discuss the implications of points 1–3 above, and future directions in the assessment of the effects of human-induced changes in vegetation/land-cover on the regional climate through altered feedbacks. All ages below are given in calendar years AD/BC or BP (present=1950).
2 Databases of past land-cover and land-use changes
As human population and density are generally accepted as the major driver of ALCC, long-term data of past land-cover have generally been inferred from estimates of hu-man population density and cleared land per person. Ex-isting databases of global estimates of past land-use change back to AD 1700 (e.g. Ramankutty and Foley, 1999; Klein Goldewijk, 2001, i.e. the HYDE [History Database of the Global Environment] database version 2.0) and back to AD 800 (Pongratz et al., 2008) were derived by linking recent remote sensed images of contemporary land cover and land census data to past human population censuses. Brovkin et al. (2006) used the HYDE database to reconstruct land-use feedbacks on climate over the past 1000 years; but due to the lack of palaeodata synthesis of past land-cover, the rate
of decrease in forest cover between AD 1000 and 1700 was assumed constant. In that study, the outputs from six dif-ferent climate models showed a cooling of 0.1◦C to 0.4◦C over the Northern Hemisphere due to the biophysical feed-back (increased albedo) of an estimated decrease in forest cover between AD 1000 and 2000 (Fig. 1).
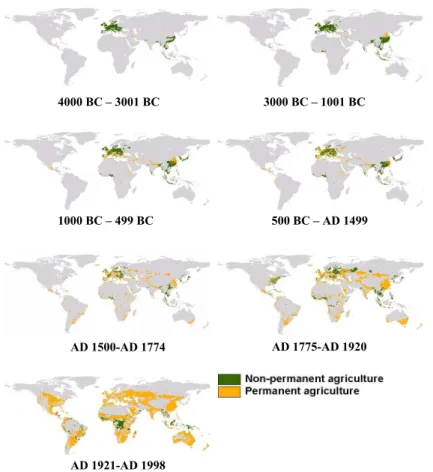
Olofsson and Hickler (2008) were the first to present an estimate of transient changes in carbon emissions caused by land-use on Holocene time scales. They used archaeological maps of the spread of different societal forms (“states and empires” and “agricultural groups”; Lewthwaite and Sher-rat, 1980), the HYDE reconstruction (version 2.0) for the last 300 years, global changes in population (primarily based on McEvedy and Jones, 1978), and an estimate of land suitabil-ity to derive land transformation for farmland and pastures by humans at different time windows (Fig. 2). Permanent agriculture was assumed to be associated with the develop-ment of states and empires, leading to 90% deforestation of the suitable land, and non-permanent (slash-and-burn) agri-culture was implemented also in suitable areas dominated by agricultural groups. Their reconstruction (Fig. 2) shows two main centres of early agriculture in the Far East and in Europe-Near East, characterized mainly by non-permanent agriculture from 4000 BC until 1000 BC. In Europe, perma-nent agriculture is represented mainly in France, Spain, and Italy during the time window 1000 BC–AD 499. From AD 500, permanent agriculture spread northwards and eastwards. The major change is seen between the time windows AD 1775–1920 and AD 1921–1998, most non-permanent culture outside the tropics being replaced by permanent agri-culture. It is striking that permanent agriculture in Europe does not differ much between the time windows AD 1500–
4000 BC – 3001 BC 3000 BC – 1001 BC
1000 BC – 499 BC 500 BC – AD 1499
AD 1775-AD 1920 AD 1500-AD 1774
AD 1921-AD 1998
Fig. 2. Reconstructions of the spatial extent of permanent and non-permanent agriculture for seven time slices of the Holocene (modified
from Olofsson and Hickler, 2008). The reconstructions are based on archaeological maps of the spread of different societal forms, HYDE [History Database of the Global Environment] version 2.0 for the last 300 years, global changes in population, and an estimate of land suitability (see text for details).
1774 and AD 1775–AD 1920. The 19th century is known in several regions of Europe as the time of most intensive land-use with a maximum of landscape openness, while the 20t hcentury was characterized by a reforestation after aban-donment and/ or through plantation, e.g. in southern Scandi-navia, southern Norway, northern Italy, Central France, the Pyerenees, Central Spain, Portugal (Krzywinski et al., 2009; Gaillard et al., 2009). The latter landscape transformation is not evidenced in the map for the time window AD 1921–AD 1998; instead it shows an increase in the areas of permanent agriculture compared to the former period. This is proba-bly mainly due to the version (2.0) of HYDE used in the reconstruction. In the most recent version of HYDE (3.1) the landscape transformation during the 20th century (compared to the 19th century) is more visible.
Pongratz et al. (2008) estimated the extent of cropland and pasture since AD 800. Their reconstruction is based on pub-lished maps of agricultural areas for the last three centuries with a number of corrections. For earlier times, a country-based method was developed that uses population data as a proxy for agricultural activity. The resulting
reconstruc-tion of agricultural areas is combined with a map of poten-tial vegetation to estimate the resulting historical changes in land cover. One of the strengths of the study is that the un-certainties associated with the approach, in particular owing to technological progress in agriculture and human popula-tion estimates, were quantified. These uncertainties vary be-tween regions of the globe (for more details, see Pongratz et al., 2008). This reconstruction shows that by AD 800, 2.8 million km2 of natural vegetation had been transformed to agricultural land, which is about 3% of the area poten-tially covered by vegetation on the globe. This transforma-tion resulted from the development of almost equal propor-tions of cropland and pasture. Around AD 1700, the agricul-tural area had increased to 7.7 million km2; 3.0 million km2of forest had been cleared (85% for cropland, 15% for pas-ture) and 4.7 million km2 of grassland and shrubland were under human use (30% for the cultivation of crop). Thus, between AD 800 and AD 1700, natural vegetation under agricultural use had increased by ca. 5 million km2. Within the next 300 years, the total agricultural area increased to 48.4 million km2 (mainly pastureland), i.e. a ca. 5.5 times
0o 30oE 60oE 90oE 120oE 40oS 20oS 0o 20oN 40oN 60oN
5000 BC
0o 30oE 60oE 90oE 120oE S S N N N2000 BC
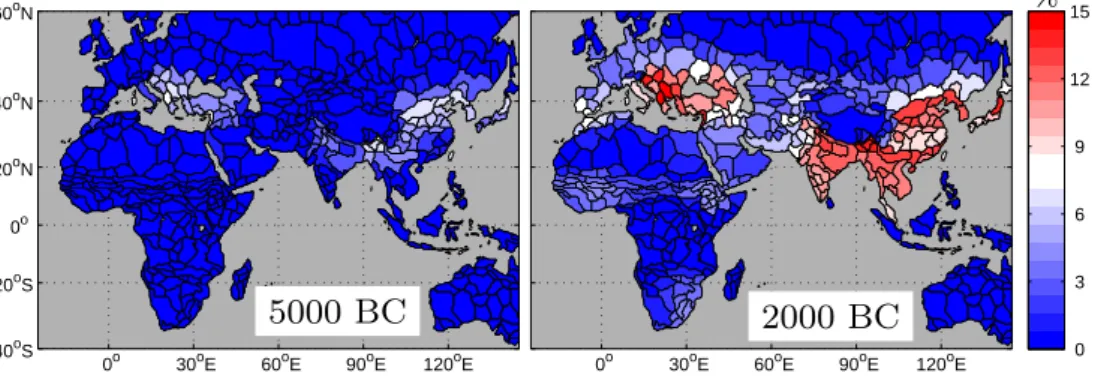
0 3 6 9 12 15 %Fig. 3. Fractional crop cover at 5000 BC (left) and 2000 BC (right) simulated by the Global Land use and Technological Evolution Simulator
(GLUES, Lemmen, 2009).
larger area than at AD 1700. This reconstruction shows that global land cover change was small between AD 800 and AD 1700 compared to industrial times, but relatively large compared to previous millennia. Moreover, during the prein-dustrial time period of the last millennium, the reconstruction shows clear between-region differences in histories of agri-culture.
Recently, Kaplan et al. (2009) created a high resolution, annually resolved time series of anthropogenic deforestation in Europe over the past three millennia. Their model was based on estimates of human population for the period 1000 BC to AD 1850 and the suitability of land for cultivation and grazing (pasture) (“standard scenario”). Assumptions in-clude that high quality agricultural land was cleared first, and that marginal land was cleared next. A second alternative scenario was produced by taking into account technological developments (“technology scenario”). The latter produces major differences in land cover in south western, south east-ern and easteast-ern Europe where landscape openness becomes significantly lower than in the “standard scenario”, whereas it is higher in western Europe.
Lemmen (2009) developed an independent estimate of hu-man population density, technological change and agricul-tural activity during the period 9500–2000 BC based on dy-namical hindcasts of socio-economic development (GLUES [Global Land Use and technological Evolution Simulator], Wirtz and Lemmen, 2003). The population density estimate was combined with per capita crop intensity from HYDE (version 3.1) to infer areal demand for cropping at an annual resolution in 685 world regions. At 2000 BC, the simula-tion exhibits a continuous belt of higher crop fracsimula-tion (com-pared to earlier times) across Eurasia, and intensive cropping around the Black Sea and throughout South and East Asia (Lemmen, 2009) (Fig. 3). The transition to agriculture in these areas required that up to 13% of the local vegetation cover was replaced by crop land at 2000 BC, especially in the heavily populated areas of East and South Asia, in south east-ern Europe and the Levant. A comparison to the simulated crop-land fractional area at 5000 BC shows an
intensifica-tion of agriculture at 2000 BC in the ancient centres of agri-culture (Near East, Anatolia, Greece, China, Japan), and the development of extensive agriculture visible in the spread of crops spanning the Eurasian continent at subtropical and tem-perate latitudes, and the emergence of agriculture in Africa (Fig. 3). At 5000 BC, GLUES simulated a crop fraction of up to 7% in the early agricultural centres (Levante, Southeast Europe, China, Japan). The distribution of agriculture around 2000 BC reconstructed by Lemmen (2009) agrees with the estimates of Olofsson and Hickler (2008) in Japan, China, West Africa and Europe. Major differences in Olofson and Hickler’s dataset are (1) the discontinuity between the East Asian and Western Eurasian agriculture (Figs. 2, 5), espe-cially through the Indian subcontinent, and (2) the distinction between permanent and non-permanent agriculture, which was not attempted in GLUES.
The differences between the maps of Kaplan et al. (2009)
and the HYDE database at AD 1800 are striking. The
model results of Kaplan et al. (2009) provide estimates of deforestation in Europe around AD 1800 that compare well with historical accounts (Krzywinski et al., 2009; Gaillard et al., 2009), whereas this is not the case for the HYDE database. Even though the maps by Olofsson and Hick-ler (2008) (Figs. 2, 5) are difficult to compare with those of Kaplan et al. (2009) because of the difference in scale (global and continental, respectively), type (permanent/non-permanent agriculture and cultivation/pasture, respectively) and unit (areas under permanent/non permanent agriculture or forested fraction of grid cell, respectively) of the recon-structed landscape openness, the maps of Kaplan et al. (2009) show generally more open landscapes between 1000 BC and AD 1850 than the maps of Olofsson and Hickler (2008). This is primarily because Olofsson and Hickler take only agri-culture into account, while Kapplan et al. include grazing land. Kaplan et al. (2009) also show more extensive Euro-pean deforestation at AD 800 than the HYDE and Pongratz et al. (2008)’s databases (Fig. 4), and the reconstruction by Olofsson and Hickler (2008) for the time window 500 BC– AD 1499 (Fig. 2). Similarly, Kaplan et al. (2009)’s map
a b
c d
0.1 0.2 0.3 0.4 0.5 0.6 0.7 0.8 0.9
Fraction of gridcell under natural vegetation
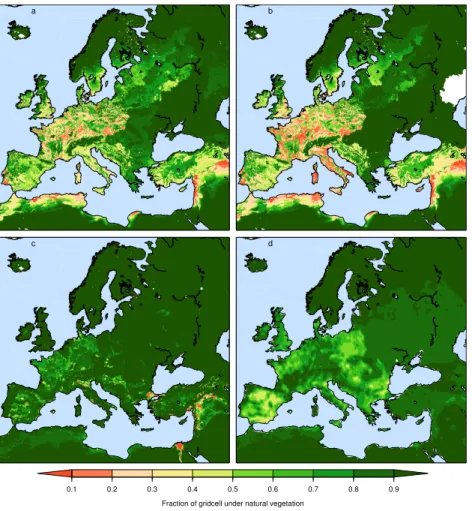
Fig. 4. Anthropogenic land use in Europe and surrounding areas at AD 800 simulated by four different modelling approaches: (a), the
Kaplan et al. (2009) standard scenario; (b), the Kaplan et al. (2009) technology scenario; (c), the HYDE [History Database of the Global Environment] database version 3.1 (Klein Goldewijk et al., 2010); (d), the Pongratz et al. (2008) maximum scenario.
for AD 1 exhibits much larger deforested areas than HYDE (over the entire globe) and the map by Olofsson and Hick-ler (2008) for the time window 500 BC–AD 1499 (in partic-ular in Central and Eastern South America, central Africa, the Near East and India) (Fig. 5). This implies that previ-ous attempts to quantify anthropogenic perturbation of the Holocene carbon cycle based on the HYDE and Olofsson and Hickler’s databases may have underestimated early hu-man impact on the climate system. Lemmen (2009) com-pared his simulated crop fraction estimate with the HYDE estimate and found only local agreement (e.g. along the Yel-low River in northern China, in the greater Lebanon area in the Near East and on the Italian peninsula), while most of the GLUES-simulated cropland area is not apparent in the HYDE database; the discrepancy was attributed to missing local historical data in HYDE. Krumhardt et al. (2010) com-pared the human population density from GLUES extrapo-lated to 1000 BC with the estimate by Kaplan et al. (2009) based on McEvedy and Jones (1978) and found a very good match for many countries and subcontinental regions.
3 Pollen-based reconstruction of past vegetation and land cover
Fossil pollen has been extensively used to estimate past veg-etation in sub-continental to global scales. However, most studies have focused on forested vegetation. For instance, Williams et al. (2008) used a modern-analogue approach to estimate the past Leaf Area Index (LAI) in Northern Amer-ica. They tested their approach using a modern training data-set and showed that it performed satisfactorily for a major-ity of the high number of records used. In northern Eurasia, Tarasov et al. (2007) developed a method to infer the percent-age cover of different tree categories (such as needle-leaved, deciduous, or evergreen trees) from pollen data. Their re-sults showed that pollen-inferred tree-cover is often too high for most tree categories particularly north of 60◦ latitude. The observed discrepancies illustrate the palynologists’ well-known problems related to 1) pollen-vegetation relationships when pollen data is expressed in percentages, 2) the defini-tion of the spatial scale of vegetadefini-tion represented by pollen, and 3) the differences in pollen productivity between plant
a b c Natural vegetation Non−permanent agriculture Permanent agriculture 0.1 0.2 0.3 0.4 0.5 0.6 0.7 0.8 0.9 Fraction of gridcell under natural vegetation
Fig. 5. Global anthropogenic land use at AD 1 simulated by three different approaches: (a), Kaplan et al. (2009); (b), HYDE [History
Database of the Global Environment] version 3.1 (Klein Goldewijk et al., 2010); and (c), Olofsson and Hickler (2008). Note that the colour scale is relevant for maps (a) and (b). Map (c) has its own colour legend.
taxa (e.g. Prentice, 1985, 1988; Sugita et al., 1999; Gaillard, 2007; Gaillard et al., 2008). The pollen-vegetation relation-ship in percentages is not linear because of, in particular, per-centage calculations, the effects of long-distance pollen from regional sources, and the characteristics of the regional vege-tation and the deposition basins (e.g. Sugita et al., 1999; Hell-man et al., 2009). Therefore, for similar deposition basins – in terms of type (bog, lake, etc.) and size −0% and 100% of a taxon in the vegetation cover will not necessarily correspond to 0% and 100 % pollen of that same taxon, respectively. Fur-ther, e.g. 20% pollen of a given taxon may represent different percentage covers of that taxon in the vegetation (e.g. 40, 50, 60 or 80%) depending on the characteristics of the regional vegetation and the deposition basin.
The non-linear nature of the pollen-vegetation relationship has made it difficult to quantify past land-cover changes us-ing fossil pollen (e.g. Andersen, 1970; Prentice, 1985, 1988; Sugita et al., 1999; Gaillard, 2007; Gaillard et al., 2008). However, earlier developments in the theory of pollen analy-sis (Andersen, 1970; Prentice, 1985; Sugita, 1994) have con-tributed to the recent development of a new framework of vegetation/land-cover reconstruction, the Landscape Recon-struction Algorithm (LRA) (Sugita, 2007a, b). LRA solves the problems related with the non-linear nature of pollen-vegetation relationships, and corrects for biases due to dif-ferences in pollen dispersal and deposition properties be-tween plant species, landscape characteristics, species com-position of vegetation, and site size and type (bog or lake). The LRA consists of two separate models, REVEALS and
Skåne - Pollen proportio Småland - Pollen proportio
Skåne - Regional vegetation p oportion estim ted by the REVEALS Model
Småland - Regional vegetation p oportion estim ted by the REVEALS Model
Skåne - Observed vegetatio Småland - Observed vegetatio
Corylus 3% Pinus 13% Alnus 16% Picea 3% Rumex acetosa 2% Cerealia-t 4% Poaceae 15% Betula 16% Fagus 13% Quercus 5% Ulmus 2% Picea 16% Pinus 42% Alnus 5% Poaceae 5% Betula 24% Corylus 2% Quercus 2% Picea 7% Pinus 3% Alnus 4% Cerealia-t 32% Poaceae 24% Comp. SF. Cich 5% Cyperaceae 2% Betula 2% Corylus 3% Fagus 10% Ulmus 2% Secale 3% Picea 54% Pinus 13% Alnus 2% Cerealia-t 9% Poaceae 11% Betula 4% Corylus 2% Secale 2% Quercus 3% Fagus 7% Betula 3% Poaceae 19% Cerealia-t 41% Rumex acetosa 3% Pinus 3% Picea 13% Betula 6% Poaceae 18% Cerealia-t 5% Pinus 19% Picea 44% Deciduous trees Conifers Cerealia -t and Secale Poaceae (excluding Cerealia-t) other non arboreal plants
Fig. 6. Validation of the REVEALS model in southern Sweden, provinces of Sk˚ane (left) and Sm˚aland (right): comparison of pollen
percentages, REVEALS estimates, and actual vegetation for 26 taxa. See Fig. 8 for the locations of Sk˚ane and Sm˚aland. Only taxa represented by ≥ 2% are named. REVEALS was run with the pollen productivity estimates from southern Sweden (Brostr¨om et al., 2004). Note the underrepresentation in pollen percentages of cereals (yellow), Poaceae (grasses; orange) and other non-arboreal taxa (herbs and shrubs; red), and the overrepresentation of deciduous trees (light green), Betula (birch) and Alnus (alder) in particular, compared to the share of these taxa in the actual vegetation and in REVEALS estimates. Pinus (pine) is dominant among conifers (dark green) in the pollen assemblage, while Picea (spruce) is dominant in the vegetation and REVEALS estimates. Other deciduous trees: Corylus (hazel), Fagus (beech), Quercus (oak), Ulmus (elm). Cereals: Cerealia-t (cereals, rye excluded), Secale (rye); other non-arboreal taxa (herbs): Compositae Sub-Family Cichorioidae (lettuce, dandelions and others), Cyperaceae (sedges), Rumex acetosa-t (sorrels, in particuler common sorrel and sheep’s sorrel). The taxa with values <2% in pollen assemblages, actual vegetation and REVEALS estimates are: Deciduous trees –
Acer (maple), Tilia (linden), Carpinus (hornbeam), Fraxinus (ash), Salix (willows); Other non arboreal taxa – Juniperus (juniper), Calluna
(heather), Filipendula (meadowsweets), Potentilla (cinquefoils), Ranunculus acris type (buttercups), Rubiaceae (bedstraws), and Plantago
lanceolata (ribwort). For details, see Hellman et al. (2008a, b).
LOVE (LOcal Vegetation Estimates), allowing vegetation abundance to be inferred from pollen percentages at the re-gional (104–105km2area) and local (≤100 km2area) spatial scale, respectively. Extensive simulations support the theo-retical premise of the LRA (Sugita, 1994, 2007a, b). The effectiveness of REVEALS and has been empirically tested and shown to be satisfactory in southern Sweden
(Hell-man et al., 2008a, b) (Fig. 6), central Europe (Soepboer et al., 2010), and the upper Great Lakes region of the US (Sugita et al., 2010). Moreover, Hellman et al. (2008a) showed that REVEALS provided better estimates of the land-cover composition in southern Sweden than those ob-tained in earlier studies using the “correction factors” of An-dersen (1970) and Bradshaw (1981) to account for biases
1000 2000 3000 4000 5000 6000 7000 8000 9000 10 000 11 000 0 1000 2000 3000 4000 5000 6000 7000 8000 9000 10 000 11 000 0 1000 2000 3000 4000 5000 6000 7000 8000 9000 10 000 11 000 0 1000 2000 3000 4000 5000 6000 7000 8000 9000 10 000 11 000 0
Cal. year BP Cal. year BP
0 0.2 0.4 0.6 0.8 1 0 0.2 0.4 0.6 0.8 1 0 0.2 0.4 0.6 0.8 1 0 0.2 0.4 0.6 0.8 1 0 0.2 0.4 0.6 0.8 1 0 0.2 0.4 0.6 0.8 1 Pollen proporion Skåne (Krageholmssjön) 0 0.2 0.4 0.6 0.8 1 0 0.2 0.4 0.6 0.8 1 Småland (Trummen ) Deciduous trees Conifers Cerealia -t and Secale Poaceae (excluding Cerealia-t) other non arboreal plants 5700-6200 cal BP 100-350 cal BP 0-100 cal BP
Regional vegetaion proporion
esimated by the REVEALS Model Pollen proporion Regional vegetaion proporion esimated by the REVEALS Model
Fig. 7. REVEALS reconstructions of Holocene vegetation changes (right in each panel) in southern Sweden based on the pollen records
(left in each panel) from Kragehomssj¨on (province of Sk˚ane, left) and Lake Trummen (province of Sm˚aland, right) (from Sugita et al., 2008, modified). See Fig. 8 for the locations of Sk˚ane and Sm˚aland. The selected three major time-windows studied in the LANDCLIM project are indicated. REVEALS was run with 24 pollen taxa with the pollen productivity estimates from southern Sweden (Brostr¨om et al., 2004). The taxa included in the groups “conifers”, “deciduous trees”, “Cerealia-t” (cereals, rye excluded) and “other non-arboreal plants” (herbs and shrubs) are the same as in Fig. 6. Secale=rye; Poaceae=grasses.
due to between-species/taxa differences in pollen productiv-ity (Bj¨orse et al., 1996; Lindbladh et al., 2000), or applying the self-organized mapping method (neural networks) com-bined with the “correction factors” (Holmqvist and Brad-shaw, 2008).
The first REVEALS-based reconstructions of Holocene vegetation in southern Sweden indicate that changes in human impact on vegetation/land-cover over the last 6000 years, as well as landscape openness during the Early Holocene (11 500–10 000 cal. yrs BP), were much more pro-found than changes in pollen percentages alone would sug-gest (Sugita et al., 2008) (Fig. 7). The proportion of unforested land through the Holocene is strongly under-estimated by percentages of Non Arboreal Pollen (NAP, i.e. pollen from herbaceous plants). For instance, at the re-gional spatial scale, the REVEALS estimates of openness represented by non-arboreal taxa during the last 3000 years reached 60–80% in the province of Sk˚ane, and 25–40% in the province of Sm˚aland (compared to 30–40% and 3–10% of NAP, respectively). The REVEALS reconstruction of the regional vegetation of the Swiss Plateau for the past 2000 years also showed that the area of open land is underesti-mated by NAP percentages (Soepboer et al., 2010).
4 The LANDCLIM Initiative and Preliminary Results
The LANDCLIM (LAND cover – CLIMate interactions in NW Europe during the Holocene) project and research
net-work has the overall aim to quantify human-induced changes in regional vegetation/land-cover in northwestern and west-ern Europe north of the Alps (Fig. 8) during the Holocene with the purpose to evaluate and further refine a dynamic vegetation model and a regional climate model, and to as-sess the possible effects on the climate development of two historical processes (compared with a baseline of present-day land cover), i.e. climate-driven changes in vegetation and human-induced changes in land cover, e.g. via the influ-ence of forested versus non-forested land cover on shortwave albedo, energy and water fluxes.
Accounting for land-surface changes may be particularly important for regional climate modelling, as the biophysical feedbacks operate at this scale and may be missed or under-estimated at the relatively coarse resolution of Global Circu-lation Models (GCMs). Dynamic Global Vegetation Models (DVMs) (Cramer et al., 2001; Prentice et al., 2007) have been coupled to GCMs to quantify vegetation – mainly carbon cycle – feedbacks on global climate (e.g. Cox et al., 2000; Friedlingstein et al., 2003). Current DVMs are necessarily highly generalized and tend to represent vegetation struc-ture and functioning in abstract and rather simplified ways (e.g. Sitch et al., 2003). For application at the regional scale, and to fully account for biophysical feedbacks on climate, a more detailed configuration of vegetation and processes gov-erning its dynamics is needed (Smith et al., 2001; Wram-neby et al., 2009). The LPJ (Lund Potsdam Jena) – GUESS (General Ecosystem Simulator) model (LPJ-GUESS, Smith
1° R. Fyfe A.B. Nielsen
A.K. Trondman and S. Sugita PPE moss polsters F. Mazier PPE lakes Holocene record Små Skå Sw Pl
Fig. 8. Study area of the LANDCLIM project. It is devided between four principal investigators. The regions where pollen productivities
were estimated from modern pollen data (in moss polsters or surface lake sediments) and related vegetation data are indicated. REVEALS reconstructions performed within the LANDCLIM project are presented in Figs. 10 and 11 for the Czech Republic (emphasized by a thick land boarder). REVEALS reconstructions of vegetation changes over the entire Holocene will be performed for 10 target sites (indicated by stars on the map); such reconstructions are presented in Fig. 7 for the provinces of Sk˚ane (Sk˚a) and Sm˚aland (Sm˚a).
REGIONAL CLIMATE MODEL
LAND COVER-CLIMATE FEEDBACKS
PALAEO-CLIMATIC DATA Simulated REGIONAL CLIMATE DYNAMIC VEGETATION MODEL Simulated VEGETATION REVEALS MODEL Estimated REGIONAL VEGETATION
AND LAND COVER
Fig. 9. Model-data comparison scheme for the LANDCLIM project. The simple arrows represent model inputs or outputs. The double arrows represent the model-data comparison steps. RE-VEALS model (Sugita 2007a); dynamic vegetation model= LPJ-GUESS (Smith et al., 2001); regional climate model=RCA3 (Kjell-str¨om et al., 2005). For details, see text.
et al., 2001) is a dynamic, process-based vegetation model optimized for application across a regional grid that simu-lates vegetation dynamics based on climate data input. It represents landscape and stand-scale heterogeneity and, by resolving horizontal and vertical vegetation structure at these scales, more adequately accounts for the biophysical proper-ties that influence regional climate variability.
The Rossby Centre Regional Atmospheric model version 3 (RCA3) is capable of realistically simulating the Euro-pean climate of the last couple of decades (Kjellstr¨om et al., 2005; Samuelsson et al., 2010). RCA3 and its predeces-sors RCA1 and RCA2 have been extensively used for this kind of downscaling experiments for today’s climate and fu-ture climate change scenarios (Rummukainen et al., 1998, 2001; Jones et al., 2004; R¨ais¨anen et al., 2003, 2004; Kjell-str¨om et al., 2010a). LPJ-GUESS has been interactively cou-pled to RCA3 (Wramneby et al., 2009) and is being used to study the feedbacks of climate-driven vegetation changes on climate, via changes in albedo, roughness, hydrological cycling and surface energy fluxes. Preliminary results sug-gest that changes in treelines, phenology of conifer versus broadleaved trees, and LAI may modify the future climate development, particularly in areas close to treelines and in semi-arid areas of Europe (Wramneby et al., 2009).
The aims of the LANDCLIM project will be achieved by applying a model-data comparison scheme using the LPJ-GUESS, RCA3, and REVEALS models, as well as new syn-theses of palaeoclimatic data (Fig. 9). The REVEALS esti-mates of the past cover of plant functional types (PFTs) at a spatial resolution of 1◦×1◦will be compared with the out-puts of LPJ-GUESS (10 PFTs), and used as an alternative to the LPJ-GUESS-simulated vegetation (3 PFTs) to run RCA3 for the recent past (0–100 cal BP) and selected time windows of the Holocene with contrasting human-induced land-cover at 100–350 BP, 350–700 BP (Black Death), 2700–3200 BP
Table 1. PFTs used in the LANDCLIM project (see text for more explanations). The ten PFTs in the left column and the three land-surface
types in the right column are used in the dynamic vegetation model LPJ-GUESS and regional climate model RCA3, respectively. The PFTs are a simplification of the PFTs described in Wolf et al. (2008). The corresponding 24 plant taxa for which REVEALS reconstructions are performed in the project are indicated in the middle column. These plant taxa have specific pollen-morphological types; when the latter corresponds to a botanical taxon, it has the same name; if not, it is indicated by the extension “–t”.
PFT PFT definition Plant taxa/Pollen-morphological types Land surface TBE1 Shade-tolerant evergreen trees Picea
Evergreen tree canopy TBE2 Shade-tolerant evergreen trees Abies
IBE Shade-intolerant evergreen trees Pinus
TSE Tall shrub evergreen trees Juniperus
IBS Shade-intolerant summergreen trees Alnus, Betula, Corylus, Fraxinus, Quercus
Summergreen tree canopy TBS Shade-tolerant summergreen trees Carpinus, Fagus, Tilia, Ulmus
TSD Tall shrub summergreen trees Salix
LSE Low evergreen shrub Calluna
Open land GL Grassland – all herbs Cyperaceae, Filipendula
Plantago lanceolata Plantago montana Plantago media Poaceae
Rumex p.p. (mainly R. acetosa R. acetosella) /Rumex acetosa-t
AL Agricultural land – cereals Cereals (Secale excluded)/Cerealia-t, Secale
(Late Bronze Age), and 5700–6200 BP (Early Neolithic). The outputs of the RCA3 model will then be compared to the palaeoclimatic data. The REVEALS model estimates the percentage cover of species or taxa that are grouped into the PFTs used in the LPJGuess and RCA3 models as shown in Table 1. Moreover, time trajectories of land-cover changes for the entire Holocene will be generated in ten selected tar-get areas of the project’s study region (Fig. 8) to be com-pared with long-term simulated vegetation dynamics from LPJ-GUESS.
REVEALS requires raw pollen counts, site radius, pollen productivity estimates (PPEs), and fall speed of pollen (FS) to estimate vegetation cover in percentages. PPEs and FS are now available for 34 taxa in the study area of the LAND-CLIM project (Brostr¨om et al., 2008) (Fig. 8). The study area is divided between four principle investigators (Fig. 8). A protocol was established in order to standardize the strategy and methods applied for the preparation of the pollen data and the REVEALS runs (LANDCLIM website). The pollen records are selected from pollen databases, i.e. the European Pollen Database (EPD) (Fyfe et al., 2007), the PALYnologi-cal CZech database (PALYCZ) (Kuneˇs et al., 2009) and the ALpine PALynological DAtaBAse (ALPADABA), or they are obtained directly from the authors. A Spearman rank or-der correlation test was applied on the REVEALS estimates obtained using the pollen records from PALYCZ in order to test the effect on the REVEALS estimates of (1) basin type (lakes or bogs), (2) number of pollen taxa, (3) PPEs
dataset, and (4) number of dates per record used to establish the chronology (≥3 or ≥5) (Mazier et al., 2010). The results showed that the REVEALS estimates are robust in terms of ranking of the PFTs’ abundance whatever alternatives were used to run the model. Therefore, the first REVEALS esti-mates produced use pollen records from both lakes and bogs, chronologies established with ≥ 3 dates, 24 pollen taxa (en-tomophilous taxa excluded) and, for each pollen taxon, the mean of all PPEs available for that taxon in the study area (Trondman et al., 2010).
Examples of preliminary results for the Czech Republic are presented in three series of maps (Figs. 10 and 11). As expected, there are significant vegetation changes between 6000 BP and 200 BP in particular for Abies (TBE 2; ca. 5–10 times larger cover at 200 BP), summer-green trees (IBS and TBS; ca. 5 times larger cover at 6000 BP), grasslands (GL; ca. 5–10 times larger cover at 200 BP in many areas) and agricultural land (AL; 4 to 9 times larger cover at 200 BP in many areas) (Fig. 10). The maps of herbaceous PFTs (AL and GL) show significant changes in the degree of human-induced vegetation between the selected time windows, with the largest change between 2700–3200 BP and 350–700 BP, and a decrease in cover of GL between 100–350 BP and 0– 100 BP (Fig. 11), which agrees with the known historical de-velopment in many parts of Europe due to forest plantation or abandonment of grazing areas.
AL GL LSE TSD TSE TBS IBS IBE TBE 2 TBE1 10 1 0 2 3 4 5 6 7 8 9 2030 40 50 60 70 80 90 100
PFT based estimates (%) of gridcell
N 1°
A) 6000 cal BP
Fig. 10a. REVEALS estimates of ten plant functional estimates
(PFTs) for the Czech Republic at 6000 BP (A) and 200 BP (B) us-ing the PALYCZ pollen database (Kuneˇs et al., 2009) and followus-ing the LANDCLIM project’s protocol. The definition of the PFTs are found in Table 1. In this visualization of the results, the zero values (no occurrence of a PFT) are not distinguised from values >0% up to 1%. Note the large difference in the open-land PFTs between 6000 and 200 BP, with up to 80% grassland (GL, grasses and herbs) and up to 9% agricultural land (AL, cereals) at 200 BP, compared to maximum 50% grassland (except in the SE) and ≤1% agricul-tural land at 6000 BP. A thorough discussion of these results will be published elsewhere (Mazier et al., 2010).
5 Implications and future directions
Palaeoenvironmental reconstructions are critical to provide predictive models of climate and environmental changes with input data, and for model evaluation purposes. Climate models are becoming increasingly complex; they are com-posed of several modules, of which one shall represent a dynamic land biosphere. The latter is in turn composed of a large number of “sub-models” (e.g. stomata, phenology, albedo, dynamic land cover, carbon flow, soil models). All the processes involved in these “sub-models” are influenced by natural and human-induced vegetation changes. Thus, the dynamic land-cover model should also account for an-thropogenic land-cover change. It should be noted here that
AL GL LSE TSD TSE TBS IBS IBE TBE 2 TBE1 10 1 0 2 3 4 5 6 7 8 9 2030 40 50 60 70 80 90 100
PFT based estimates (%) of gridcell
N 1°
B) 200 cal BP
Fig. 10b. Continued.
biophysical feedbacks from land-cover change were not ac-counted for by the main IPCC climate models (IPCC Fourth Assessment Report, 2007).
The REVEALS model provides better estimates of the re-gional vegetation/land-cover changes, and in particular for open, herb-dominated (NAP) areas, than the traditional use of pollen percentages and earlier attempts at correcting or calibrating pollen data (e.g. Sugita 2007a; Hellman et al., 2008a, b). REVEALS thus allows a more robust assessment of human-induced land cover at regional- to continental-spatial scale throughout the Holocene. The LANDCLIM project and NordForsk network are designed to provide databases on the regional changes in vegetation/land-cover in north-western Europe that should prove to be useful to fine-tune LPJ-GUESS and evaluate RCA3.
LPJ-GUESS has been previously shown to be capable of reproducing patterns and time series of vegetation response to climate (e.g. Smith et al., 2001; Hickler et al., 2004; Miller et al., 2008). Sepp¨a et al. (2009) compared assemblages of
Pinus (pine), Picea (spruce) and Betula (birch) inferred from
Holocene pollen accumulation rates (PARs) from two south-ern Finnish lakes with predictions of the biomass of these taxa from LPJ-GUESS; a disagreement between the mod-elled and pollen-based vegetation for Pinus after 2000 years
BP was associated to a period of greater anthropogenic in-fluence in the area surrounding the study sites. REVEALS reconstructions will make it possible to further evaluate this assumption and the performance of LPJ-GUESS itself.
RCA3 was used earlier in palaeoclimatological contexts to simulate the north European climate during more than 600 out of the last 1000 years (Moberg et al., 2006), for the Last Glacial Maximum (Strandberg et al., 2010), and for a cold stadial during Marine Isotope Stage 3 (Kjellstr¨om et al., 2010b). Simulations of Holocene climate for periods older than 1000 BP and fine-tuning the coupled land-cover proper-ties in RCA3 as planned in the LANDCLIM project might contribute to further improve the robustness of the model. Moreover, RCA3 is currently applied in other parts of the world (Africa, the Arctic, South and North America), and the results show that the model is capable of simulating the climate in a range of different climate zones throughout the world. This implies that the approach of the LANDCLIM project could, in the future, be applied to regions other than Europe.
REVEALS-based land-cover reconstructions will be in-formative for evaluating other hypotheses that involve land cover-climate feedbacks. Many studies have focused on the effects of land-use change on global-scale fluxes of car-bon from terrestrial ecosystems (e.g. DeFries et al., 1999; McGuire et al., 2001; Houghton, 2003; Campos et al., 2005). However, these estimates do not extend beyond AD 1700, and estimated ALCC was mostly extracted from the digi-tal HYDE database version 2.0. The studies to date that do consider the effects of ALCC on the terrestrial carbon budget on longer time scales, including those by Claussen et al. (2005) and Olofsson and Hickler (2008), agree in the suggestion that the magnitude of past changes in terrestrial carbon balance associated with human land-use are far too small to account for a major dampening (or enhancement) of global climate variations (e.g. the Ruddiman’s hypothe-sis; Ruddiman, 2003, 2005). On the other hand, a recent data-base synthesis of ALCC in the Western Hemisphere fol-lowing European colonization and the subsequent collapse of indigenous populations suggested that the magnitude of the carbon uptake from regrowing forests in the 16th and 17th centuries could have been partly responsible for the slightly lower atmospheric CO2concentrations observed during the
Little Ice Age cold period (Nevle and Bird, 2008). These contrasting results emphasize the need for empirical data of past land-cover such as the REVEALS model-based recon-structions, which might help to fine-tune descriptions of past land-cover and lead to a better understanding of how long-term changes in ALCC might have influenced climate. The LANDCLIM results are expected to provide crucial data to reassess ALCC estimates (e.g. Olofsson and Hickler, 2008; Pongratz et al., 2008; Kaplan et al., 2009; Lemmen, 2009) and a better understanding of the land surface-atmosphere interactions at the regional spatial scale. Although biophysi-cal exchanges operate at the lobiophysi-cal to regional sbiophysi-cale, the
feed-GL 2700-3200 cal BP GL 5700-6200 cal BP GL 350-700 cal BP GL 100-350 cal BP GL 0-100 cal BP AL 5700-6200 cal BP AL 2700-3200 cal BP AL 350-700 cal BP AL 100-350 cal BP AL 0-100 cal BP N 1° 10 1 0 2 3 4 5 6 7 8 9 2030 40 50 60 70 80 90 100
PFT based estimates (%) of gridcell
Fig. 11. REVEALS estimates of the two open-land plant functional
estimates (PFTs), AL (agricultural land=cereals) and GL (grass-land=grasses and other herbs) for the Czech Republic at five time slices using the PALYCZ pollen database (Kuneˇs et al., 2009) and following the LANDCLIM project’s protocol. In this visualization of the results, the zero values (no occurrence of a PFT) are not dis-tinguised from values >0% up to 1%. Note the distinct changes and the maintenance of spatial differences through time, e.g. the high representation of grassland in the South-East from 6000 BP, and the higher representation of agricultural land in the North from 3000 BP. A thorough discussion of these results will be published elsewhere (Mazier et al., 2010).
backs can have consequences elsewhere, through remote ad-justments in temperatures, cloudiness and rainfall by means of circulation changes (Dekker et al., 2007). Comparison between studies of land cover-climate feedbacks at both re-gional and global spatial scales will increase our understand-ing of climate change.
Pollen-based reconstruction of vegetation and land-cover changes needs further collaboration for compilation of reli-able land-cover databases. The REVEALS model is a use-ful tool for this task, in addition to the currently available methods (e.g. Williams et al., 2008). REVEALS estimates of the regional vegetation/land cover are currently available for the five LANDCLIM time windows for Sweden, Finland, Denmark, Britain, Poland, the Czech Republic, Switzerland
and Northern Germany; REVEALS estimates are underway for Norway, Estonia, Southern Germany, France, Belgium, and the Netherlands. Pollen productivity estimates (PPEs) of open-land plants and major tree taxa, important parame-ters necessary to run REVEALS, are still limited outside NW Europe (Brostr¨om et al., 2008), North America (Sugita et al., 2010) and South Africa (Duffin and Bunting, 2008); how-ever, new studies are currently underway in southern Europe, Japan, China, and Africa (Cameroon), and more is to come within the Focus 4 (Past Human-Climate-Ecosystem Interac-tions; PHAROS) of the International Geosphere-Biosphere Programme - Past Global Changes (IGBP PAGES). There-fore, we expect that more objective descriptions of past land-cover will be available for several regions of the world in the near future.
Acknowledgements. The LANDCLIM (LAND cover –
CLI-Mate interactions in NW Europe during the Holocene) project and research network are sponsored by the Swedish [VR] and Nordic [NordForsk] Research Councils, respectively, and co-ordinated by Marie-Jos´e Gaillard. The two initiatives are a contribution to the IGBP-PAGES-Focus 4 PHAROS programme (http://www.pages-igbp.org/science/focus4) on human impact on environmental changes in the past. The foundation for major parts of this paper is the IGBP-PAGES Focus 4 Meeting held in July 2008 at the Royal Society, London, funded by PAGES and the Royal Society. Marie-Jos´e Gaillard thanks Frank Oldfield and John Dearing for their interest in the work performed within the NordForsk POLLANDCAL and LANDCLIM networks, and their ever-lasting support through the years. The authors are also grateful to all members of the LANDCLIM network (beside all co-authors) who contribute pollen data and the information needed to apply REVEALS. Other funding sources include the Faculty of Natural Sciences of Linnaeus University (Kalmar-V¨axj¨o, Sweden) for Marie-Jos´e Gaillard and Anna-Kari Trondman, the Estonian Science Foundation (MTT3) for Shinya Sugita, the German National Science Foundation (DFG priority program Interdynamik) for Carsten Lemmen, and the VR Linnaeus grant “Lund Centre for studies of Carbon Cycle and Climate Interaction, LUCCI” (grant number: VR 349-2007-8705) for Florence Mazier. The authors are thankful to both reviewers, Pavel Tarasov and Scott Mooney, and to the editor Thorsten Kiefer for useful comments and corrections. Scott Mooney in particuler has made many suggestions that significantly improved the language of the manuscript. Edited by: T. Kiefer
References
Andersen, S. T.: The Relative Pollen Productivity and Pollen Rep-resentation of North European Trees, and Correction Factors for Tree Pollen Spectra Determined by Surface Pollen Analy-ses from Forests, Geological Survey of Denmark, II Series, C. A. Reitzels, Kovenhavn, 96 pp., 1970.
Anderson, J., Bugmann, H., Dearing, J. A., and Gaillard, M.-J.: Linking palaeoenvironmental data and models to understand the past and to predict the future, Trends. Ecol. Evol., 21, 696–704, 2006.
Bala, G., Caldeira, K., Wickett, M., Phillips, T. J., Lobell, D. B., Delire, C., and Mirin, A.: Combined climate and carbon-cycle effects of large-scale deforestation, in: Proceedings of the Na-tional Academy of Sciences, USA, 2007, 104, 6550–6555, 2007. Betts, R.: Offset of the potential carbon sink from boreal forestation
by decreases in surface albedo, Nature, 408, 187–190, 2000. Bj¨orse, G., Bradshaw, R. H. W., and Michelson, D. B.: Calibration
of regional pollen data to construct maps of former forest types in southern Sweden, J. Paleolimnol., 16, 67–78, 1996
Bradshaw, R. H. W.: Modern pollen representation factors for woods in South-West England, J. Ecol., 69, 45–70, 1981. Brostr¨om, A., Sugita, S., and Gaillard, M.-J.: Pollen productivity
estimates for the reconstruction of past vegetation cover in the cultural landscape of southern Sweden, Holocene, 14, 368–381, 2004.
Brostr¨om, A., Nielsen, A.B., Gaillard, M.-J., Hjelle, K., Mazier, F., Binney, H., Bunting, J., Fyfe, R., Meltsov, V., Poska, A., R¨as¨anen, S., Soepboer, W., von Stedingk, H., Suutari, H., and Sugita, S.: Pollen productivity estimates – the key to landscape reconstructions, Veget. Hist. Archaeobot., 17, 461–478, 2008. Brovkin, V., Claussen, M., Driesschaert E., Fichefet, T, Kicklighter
D., Loutre, M. F., Matthews H. D., Ramankutty, N., Schaeffer M., and Sokolov, A.: Biogeophysical effects of historical land cover changes simulated by six Earth system models of interme-diate complexity, Clim. Dynam., 26, 587–600, 2006.
Campos, C. P., Muylaert, M. S., and Rosa, L. P.: Historical CO2 emission and concentrations due to land use change of crop-lands and pastures by country, Sci. Total. Environ., 346, 149– 155, 2005.
Claussen, M., Brovkin, V., Calov, R., Ganopolski, A., and Kubatzki, C.: Did humankind prevent a holocene glaciation? Comment on Ruddiman’s hypothesis of a pre-historic anthropocene, Climatic Change, 69, 409–417, 2005.
Cox, P. M., Betts, R. A., Jones, C. D., Spall, S. A., and Totterdell, I. J.: Acceleration of global warming due to carbon-cycle feed-backs in a coupled climate model, Nature, 408, 184–187, 2000. Cox, P. M., Betts, R. A., Collins, M., Harris, P. P., Huntingford,
C., and Jones, C. D.: Amazonian forest dieback under climate-carbon cycle projections for the 21st century, Theor. Appl. Cli-matol., 78, 137–156, 2004.
Cramer, W., Bondeau, A., Woodward, F. I., Prentice, I. C., Betts, R. A., Brovkin, V., Cox, P. M., Fisher, V., Foley, J. A., Friend, A. D., Kucharik, C., Lomas, M. R., Ramankutty, N., Sitch, S., Smith, B., White, A., and Young-Molling, C.: Global response of terrestrial ecosystem structure and function to CO2and
cli-mate change: results from six dynamic global vegetation models, Glob. Change Biol., 7, 357–373, 2001.
Dearing, J. A.: Climate-human-environment interactions: resolving our past, Clim. Past, 2, 187–203, doi:10.5194/cp-2-187-2006, 2006.
Denman, K. L. and Brasseur, G.: Couplings between changes in the climate system and biogeochemistry, in: Climate Change 2007: The Physical Science Basis. Contribution of Working Group I to the Fourth Assessment Report of the Intergovernmental Panel on Climate Change, , edited by: Solomon, S., Qin, D., Manning, M., et al., Cambridge University Press, Cambridge, 499–587, 2007. DeFries, R. S., Field, C. B., Fung, I., Collatz, G. J., and Bounoua,
L.: Combining satellite data and biogeochemical models to es-timate global effects of human-induced land cover change on
carbon emissions and primary productivity, Global. Biogeochem. Cy., 13, 803–815, 1999.
Dekker, S. C., Rietkerk, M., and Bierkens, M. F. P.: Coupling microscale soil water and macroscale vegetation-precipitation feedbacks in semiarid ecosystems, Global Change Biol., 13, 671–678, 2007.
Duffin, K. and Bunting, M. J.: Relative pollen productivity and fall speed estimates for southern African savanna taxa, Veg. Hist. Ar-chaeobot., 17, 507–525, 2008.
Foley, J. A., Costa, M. H., Delire, C., Ramankutty, N., and Sny-der, P.: Green surprise? How terrestrial ecosystems could affect earth’s climate, Front. Ecol. Environ., 1, 38–44, 2003.
Friedlingstein, P., Dufresne, J.-L., Cox, P. M., and Rayner, P.: How positive is the feedback between climate change and the carbon cycle?, Tellus, 55B, 692–700, 2003.
Fyfe, R. M., de Beaulieu, J.-L., Binney, H., Bradshaw, R. H. W, Brewer, S., Le Flao, A., Finsinger, W., Gaillard, M.-J., Giesecke, T., Gil-Romera G., Grimm, E.C., Huntley, B., Kuneˇs, P., K¨uhl, N., Leydet, M., Lotter, A.F., Tarasov, P.E., and Tonkov, S.: The European Pollen Database: past efforts and current activities, Veg. Hist. Archaeobot., 18, 417–424, 2007.
Gaillard, M.-J.: Detecting Human impact in the pollen record, in: Encyclopedia of Quaternary Science, edited by: Elias, S. A., El-sevier, University of London, 2570–2595, 2007.
Gaillard, M.-J., Dutoit, T., Hjelle, K., Koff, T., and O’Connell, M.: European cultural landscapes: insights into origins and develop-ment, in: Cultural Landscapes of Europe, edited by: Krzywinski, K., O’Connell, M., and K¨uster, H., Aschenbeck Media, Bremen, 35–46, 2009.
Gaillard, M.-J., Sugita, S., Bunting, M. J., Dearing, J. A., and Bittmann, F.: Human impact on terrestrial ecosystems, pollen calibration and quantitative reconstruction of past land-cover, Veg. Hist. Archaeobot., 17, 415–418, 2008.
Hellman, S., Bunting, M. J., and Gaillard, M.-J.: Relevant Source Area of Pollen in patchy cultural landscapes and signals of an-thropogenic landscape disturbance in the pollen record: A simu-lation approach, Rev. Palaeobot. Palynol., 153, 245–258, 2009. Hellman, S., Gaillard, M.-J., Brostr¨om, A., and Sugita, S.: The
RE-VEALS model, a new tool to estimate past regional plant abun-dance from pollen data in large lakes – validation in southern Sweden, J. Quaternary Sci., 23, 21–42, 2008a.
Hellman, S., Gaillard, M.-J., Brostr¨om, A., and Sugita, S.: Ef-fects of the sampling design and selection of parameter values on pollen-based quantitative reconstructions of regional vegetation: a case study in southern Sweden using the REVEALS model, Veg. Hist. Archaeobot., 17, 445–459, 2008b.
Holmqvist, B. H. and Bradshaw, R. H. W.: Classification of large pollen data sets using unsupervised neural networks, Ecol. Model., in review, 2010.
Houghton, R. A.: Revised estimates of the annual net flux of carbon to the atmosphere from changes in land use and land manage-ment 1850–2000, Tellus, 55B, 378–390, 2003.
IPCC: Climate Change 2007 – Impacts, Adaptation and Vulnera-bility Working Group II contribution to the Fourth Assessment Report of the IPCC Intergovernmental Panel on Climate Change. Cambridge University Press, 986 pp., 2007.
Jones, C. G., Ullerstig, A., Will´en, U., and Hansson, U.: The Rossby Centre Regional Atmospheric Model (RCA): Part I: Model climatology and performance characteristics for the
present climate over Europe, Ambio, 33, 199–210, 2004. Kaplan, J., Krumhardt, K., and Zimmermann, N.: The prehistoric
and preindustrial deforestation of Europe, Quaternary Sci. Rev., 28, 3016–3034, 2009.
Kjellstr¨om, E., D¨oscher, R., and Meier, H. E. M.: Atmospheric re-sponse to different sea surface temperatures in the Baltic Sea: Coupled versus uncoupled regional climate model experiments, Nordic Hydrology, 36, 397–409, 2005.
Kjellstr¨om, E., Nikulin, G., Hansson, U., Strandberg, G., and Uller-stig, A.: 21st century changes in the European climate: uncer-tainties derived from an ensemble of regional climate model sim-ulations, Tellus A, in review, 2010a.
Kjellstr¨om, E., Brandefelt, J., N¨aslund, J. O., Smith, B., Strandberg, G., Voelker, A. H. L., and Wohlfarth, B.: Simulated climate con-ditions in Fennoscandia during a MIS3 stadial, Boreas, in review, 2010b.
Klein Goldewijk, K.: Estimating global land use change over the past 300 years: The HYDE Database, Global Biogeochem. Cy., 15, 417–433, 2001.
Klein Goldewijk, K., Bouwman, A. F., and van Drecht, G.: Map-ping contemporary global cropland and grassland distributions on a 5 by 5 minute resolution, Journal of Land Use Science, 2, 167–190, 2007.
Klein Goldewijk, K., Beusen, A., and Janssen, P.: Long term dy-namic modeling of global population and built-up area in a spa-tially explicit way, HYDE 3 .1, The Holocene, 20, 565–573, 2010.
Krumhardt, K. M., Lemmen, C., and Kaplan, J. O. A.: Global dataset of human population and urbanization over the Holocene, in preparation, 2010.
Krzywinski, K., O’Connell, M., and K¨uster, H. (Eds.): Cultural Landscapes of Europe, Aschenbeck Media, Bremen, 218 pp., 2009.
Kuneˇs, P., Abraham, V., Kov´a´ık, O., Kopeck´y, M., and PALYCZ contributors: Czech Quaternary Palynological Database (PA-LYCZ): review and basic statistics of the data, Preslia, 8, 209– 238, 2009.
Kutzbach, J. E., Bartlein, P. J., Foley, J. A., Harrison, S. P., Hostetler, S. W., Liu, Z., Prentice, I. C., and Webb, T. III.: Po-tential role of vegetation feedback in the climate sensitivity of high-latitude regions: a case study at 6000 Years B.P., Global Biogeochem. Cy., 10, 727–736, 1996.
Lemmen, C.: World distribution of land cover changes during Pand Protohistoric Times Pand estimation of induced carbon re-leases, G´eomorphologie: relief, processus, G´eomorphologie, 4, 303–312, 2009.
Lewthwaite, J. W. and Sherratt, A.: Chronological Atlas, in: En-cyclopedia of Archeology, edited by: Sherratt, A., Cambridge University Press, Cambridge, 437–452, 1980.
Lindbladh, M., Bradshaw, R., and Holmqvist, B. H.: Pattern and process in south Swedish forests during the last 3000-years sensed at stand and regional scales, J. Ecol., 88, 113–128, 2000. Meehl, G. A., Stocker, T. F., Collins, W. D., Friedlingstein, P., Gaye, A. T., Gregory, J. M., Kitoh, A., Knutti, R., Murphy, J. M., Noda, A., Raper, S. C. B., Watterson, I. G., Weaver, A. J., and Zhao, Z.-C: Global climate projections, in: Climate Change 2007, The Physical Science Basis, Contribution of Working Group I to the Fourth Assessment Report of the Intergovernmental Panel on Climate Change, edited by: Solomon, S., Qin, D., Manning, M.,
et al., Cambridge University Press, Cambridge, 747–845, 2007. Mazier, F., Kuneˇs, P., Sugita, S., Trondman, A.-K., Brostr¨om, A.,
and Gaillard M.-J.: Pollen- inferred quantitative reconstructions of Holocene land-cover in NW Europe for the evaluation of past climate-vegetation feedbacks – Evaluation of the REVEALS-based reconstruction using the Czech Republic database, EGU General Assembly 2010, Geophys. Res. Abstr., 12, EGU2010-4248, 2010.
McEvedy, C. and Jones, R.: Atlas of world population history, Puffin Books, Harmondsworth, Middlesex, London, England, 368 pp., 1978.
McGuire, A. D., Sitch, S., Clein, J. S., Dargaville, R., Esser, G., Foley, J., Heimann, M., Joos, F., Kaplan, J., Kicklighter, D. W., Meier, R. A., Melillo, J. M., Moore III, B., Prentice, I. C., Ra-mankutty, N., Reichenau, T., Schloss, A., Tian, H., Williams, L. J., and Wittenberg, U.: Carbon balance of the terrestrial biosphere in the twentieth century: Analysis of CO2, climate
and land use effects with four process-based ecosystem models, Global Biogeochem. Cy., 15, 183–206, 2001.
Nevle, R. J. and Bird, D. K.: Effects of syn-pandemic fire reduction and reforestation in the tropical Americas on atmospheric CO2
during European conquest, Palaeogeogr. Paleocl., 264, 25–38, 2008.
Olofsson, J. and Hickler, T.: Effects of human land-use on the global carbon cycle during the last 6,000 years, Veg. Hist. Ar-chaeobot., 17, 605–615, 2008.
Pongratz, J., Reick, C., Raddatz, T., and Claussen M.: A re-construction of global agricultural areas and land cover for the last millennium, Global Biogeochem. Cy., 22, GB3018, doi:10.1029/2007GB003153, 2008.
Prentice, I. C.: Pollen representation, source area, and basin size: Toward a unified theory of pollen analysis, Quaternary Res., 23, 76–86, 1985.
Prentice, I. C.: Records of vegetation in time and space: the princi-ples of pollen analysis, in: Vegetation history, edited by: Huntley, B. and Webb, T. III, Kluwer Academic Publishers, Dordrecht, Netherlands, 17–42, 1988.
Prentice, I. C., Jolly, D., and BIOME 6000 Participants: Mid-Holocene and glacial-maximum vegetation geography of the northern continents and Africa, J. Biogeogr., 27, 507–519, 2000. Prentice, I. C., Bondeau, A., Cramer, W., Harrison, S. P., Hickler, T., Lucht, W., Sitch, S., Smith, B., and Sykes, M. T.: Dynamic global vegetation modelling: quantifying terrestrial ecosystem responses to large-scale environmental change, in: Terrestrial Ecosystems in a Changing World, edited by: Canadell, J. G., Pataki, D. E. and Pitelka, L. F., Springer Verlag, Berlin, 175– 192, 2007.
R¨ais¨anen, J., Hansson, U., Ullerstig, A.,D¨oscher, R., Graham, L.P., Jones, C., Meier, M., Samuelsson, P., and Will´en, U: GCM driven simulations of recent and future climate with the Rossby Centre coupled atmosphere – Baltic Sea regional climate model RCAO, Reports Meteorology and Climatology 101, Norrk¨oping, Swe-den, SMHI, 2003.
R¨ais¨anen, J., Hansson, U., Ullerstieg, A., D¨oscher, R., Graham, L. P., Jones, C., Meier, H. E. M., Samuelsson, P., and Will´en, U.: European climate in the late 21st century: regional simulations with two driving global models and two forcing scenarios, Clim. Dynam., 22, 13–31, 2004.
Ramankutty, N. and Foley, J. A.: Estimating historical changes in
global land cover: Croplands from 1700 to 1992, Glob. Bio-geochem. Cy., 13, 997–1027, 1999.
Ruddiman, W. F.: The Anthropogenic Greenhouse Era Began Thou-sands of Years Ago, Climatic Change, 61, 261–293, 2003. Ruddiman, W. F.: The early anthropogenic hypothesis a year later,
Climatic Change, 69, 427–434, 2005.
Rummukainen, M., R¨ais¨ainen, J., Ullerstig, A., Bringfelt, B., Hans-son, U., and Will´en, U.: Reports Meteorology and Clima-tology 83, Swedish Meteorological and Hydrological Institute, Norrk¨oping, Sweden, 76 pp., 1998.
Rummukainen, M., R¨ais¨anen, J., Bringfelt, B., Ullerstig, A., Omst-edt, A., Will´en, U., Hansson, U., and Jones, C.: A regional cli-mate model for northern Europe: model description and results from the downscaling of two GCM control simulations, Clim. Dynam., 17, 339–359, 2001.
Samuelsson, P., Gollvik, S., Hansson, U., Jones, C., Kjellstr¨om, E., Nikulin, G., Ullerstig, A., Will´en, U., and Wyser, K.: The Rossby Centre Regional Climate Model RCA3: Model description and performance, Tellus A, in review, 2010.
Sellers, P. J., Dickinson, R. E., Randall, D. A., Betts, A. K., Hall, F. G., Berry, J. A., Collatz, G. J., Denning, A. S., Mooney, H. A., Nobre, C. A., Nobre, C. A., Sato, N., Field, C. B., and Henderson-Sellers, A.: Modeling the Exchange of Energy, Wa-ter, and Carbon between Continents and the Atmosphere, Sci-ence, 275, 502–509, 1997.
Sepp¨a, H., Alenius, T., Muukonen, P., Giesecke, T., Miller, P. A., and Ojala, A. E. K.: Calibrated pollen accumulation rates as a ba-sis for quantitative tree biomass reconstructions, The Holocene, 19, 209–220, 2009.
Sitch, S., Smith, B., Prentice, I.C., Arneth, A., Bondeau, A., Cramer, W., Kaplan, J. O., Levis, S., Lucht, W., Sykes, M. T., Thonicke, K., and Venevsky, S.: Evaluation of ecosystem dy-namics, plant geography and terrestrial carbon cycling in the LPJ dynamic global vegetation model, Glob. Change Biol., 9, 161– 185, 2003.
Smith, B., Prentice, I. C., and Sykes, M. T.: Representation of vege-tation dynamics in modelling of terrestrial ecosystems: compar-ing two contrastcompar-ing approaches within European climate space, Global Ecol. Biogeogr., 10, 621–637, 2001.
Soepboer W., Sugita, S., and Lotter A.: Regional vegetation-cover changes on the Swiss Plateau during the past two millennia: A pollen-based reconstruction using the REVEALS model, Quater-nary Sci. Rev., 29, 472–483, 2010.
Strandberg, G., Brandefelt, J., Kjellstr¨om E., and Smith, B.: High resolution regional simulation of Last Glacial Maximum climate in Europe, Tellus A, in review, 2010.
Sugita, S.: Pollen representation of vegetation in quaternary sed-iments: theory and method in patchy vegetation, J. Ecol., 82, 881–897, 1994.
Sugita, S.: Theory of quantitative reconstruction of vegetation I: Pollen from large lakes REVEALS regional vegetation composi-tion, Holocene, 17, 229–241, 2007a.
Sugita, S.: Theory of quantitative reconstruction of vegetation II: all you need is LOVE, Holocene, 17, 243–257, 2007b.
Sugita, S., Gaillard, M.-J., and Brostr¨om, A.: Landscape openness and pollen records: a simulation approach, Holocene, 9, 409– 421, 1999.
Sugita, S., Gaillard, M.-J., Hellman, S., and Brostr¨om, A.: Model-based reconstruction of vegetation and landscape using fossil