Spatial Group Structure as Potential Mechanism to Maintain
Cooperation in Fish Shoals of Unrelated Individuals
Gabriel Cisarovsky*, Andrea Bshary†, Mahmoud Bouzelboudjen‡ & Redouan Bshary† * Department of Ecology and Evolution, University of Lausanne, Lausanne, Switzerland
† Department of Biology, University of Neuchaˆtel, Neuchaˆtel, Switzerland ‡ University of Neuchaˆtel, Computer and Telematics Facility, Neuchaˆtel, Switzerland
Correspondence
Gabriel Cisarovsky, ETH Zu¨rich, Institute of Integrative Biology, Experimental Ecology group, Universita¨tstrasse 16, 8092 Zu¨rich, Switzerland.
E-mail: [email protected]
Abstract
In public goods games, group members share the benefits created through individual investments. If benefits are shared equally, individual contribu-tions readily become altruistic, and hence, a social dilemma arises in which group interests and individual interests oppose each other. How-ever, contributions to public goods can be self-serving if each investor gains a disproportionate benefit from its own contribution. This scenario may hold for our study system, the interactions of shoaling-unrelated scalefin anthias Pseudanthias squamipinnis and the ectoparasitic blenny Pla-giotremus tapeinosoma. The blenny bites off pieces of skin, mucus and scales from anthias that in return may chase the blenny. Chasing the blenny represents a public good as it makes the parasite change victim species for its next attack. Laboratory experiments using artificial Plexiglas hosts sug-gest that one reason why individuals contribute to the public good is that the blenny may specialise on non-punishing ‘free-riders’. Here, we inves-tigated how far a spatial structure within the shoal and limited space use by the blenny may contribute to punishment being self-serving. Field observation reveals that anthias indeed live in spatially structured groups and that blennies have preferred areas for attacks. Thus, some anthias individuals are consistently more exposed to blennies than others and hence may gain disproportional benefits from their punishment. In con-clusion, spatial structure may contribute to the maintenance of punish-ment in blenny–anthias interactions even when groups are large.
Introduction
Relatively little empirical evidence exists to explain how individuals gain direct fitness benefits from mutual helping in N-player interactions. The critical difference to two-player interactions, which have been studied in much more detail (Sachs et al. 2004; Bshary & Bergmu¨ller 2008; Leimar & Hammerstein 2010; Bshary & Bronstein 2011), is that helping can-not be directed specifically to cooperative partners, which may provide ample opportunity for cheating or free-riding. The most commonly used approach to describe an N-player interaction is that individuals may contribute to a common pool, and the resulting public good is then shared equally among all group
members, irrespective of the amount each member has contributed. The standard payoff matrix used in cooperation games on humans is equivalent to an N-player prisoner’s dilemma (Fehr & Ga¨chter 2002; Mil-inski et al. 2002), which, as the cooperator does not get any direct benefit from its cooperative act, allows cooperative solutions only under quite specific scenar-ios that involve kin selection (Lehmann et al. 2007; West et al. 2007b), cultural group selection (Boyd et al. 2003) or reputational games (Nowak & Sigmund 1998) that yield benefits in other circumstances.
Alternative frameworks have recently been devel-oped that explain stable contributions to public goods. Archetti (2009a,b) and Archetti & Scheuring (2011) showed that as long as the relationship
between N contributors and the size of the public good is nonlinear, that is, either a sigmoid or step function, cooperators and free-riders will coexist in a negative frequency-dependent equilibrium. The stan-dard game that captures such a relationship is the volunteer’s dilemma (Diekmann 1985). The logic applies well to punishment of free-riders to stabilise cooperation (Raihani & Bshary 2011; Raihani et al. 2012). Alternatively, stable cooperation may arise if individuals benefit disproportionally from their own contributions (Sherratt et al. 2009). Sherratt et al. (2009) argued that their scenario fits well to public goods scenarios where production and resulting ben-efits are linked to a spatial structure. For example, the production of extracellular digestive enzymes in bacteria (West et al. 2007a) or cooperative prey cap-ture in social spiders (Schneider & Bilde 2008) mainly benefits the producer and nearby individuals rather than the entire group. Thus, contributions may become largely self-serving, as proposed by the concepts of by-product mutualism (Brown 1983) and pseudo-reciprocity (Connor 1986), which can be applied to both two-player and N-player games (Bshary 2010).
Empirical cases of public goods where benefits of contributions are potentially frequency dependent are potentially plentiful (Archetti 2009a,b) but typi-cally not studied well enough to infer payoffs. In par-ticular, separating direct fitness benefits from kin selection benefits is often impossible if individuals are related, which is the case for most social species. Apart from humans, coral reef fish appear to yield ample opportunity to study direct fitness benefits of cooperation. This is because most species are open-water spawners and the larvae are randomly mixed during their pelagic phase (but see Shapiro 1983). Thus, individuals may often interact with non-relatives. An example of such interactions is the emergence of a public good in interactions between shoaling fish species and ectoparasitic blennies of the genus Plagio-tremus (Bshary & Bshary 2010a,b). The fangblennies Plagiotremus tapeinosoma and Plagiotremus rhinorhyn-chos bite off pieces of skin, mucus or scales from their victims (Moland & Jones 2004). Mucus has numer-ous functions including protection against UV light (Eckes et al. 2008) or bacteria (Subramanian et al. 2008), ionic and osmotic regulation, or locomotion (Shephard 1994). But its calorific value and protein content (Arnal & Morand 2001) also make it a valu-able food resource (just as scales, Nico & Morales 1994) for ectoparasitic blennies. It is therefore in the victim’s interest to avoid being bitten too often, and in response to bites, victims often chase the blenny
(Bshary & Bshary 2010a). Experiments demonstrate that aggressive chasing of the blenny functions as punishment sensu Clutton-Brock & Parker (1995) as it reduces the probability of future attacks (Bshary & Bshary 2010a,b). However, for species living in shoals, a public good arises as punishment increases the probability that a blenny will switch to a different victim species for its next attack (Bshary & Bshary 2010a,b).
Individual recognition has been demonstrated in fishes in an interspecific context (Tebbich et al. 2002), and blennies are also able to discriminate between punishers and look-alike non-punishers and specifically target the latter in experiments using Plex-iglas plates (Bshary & Bshary 2010a,b). Thus, it seems that the parasite selects against free-riding by non-punishing members of the shoal. However, the experiments by Bshary & Bshary (2010b) only demonstrated that blennies distinguish between two look-alikes, while shoals may contain 100 or more individuals, making the task of individual recognition much more challenging for a blenny. According to the model by Sherratt et al. (2009), a spatial dimen-sion of the payoff function of punishment, yielding larger benefits near the event and smaller further away, would help to stabilise the self-serving function of punishment even in large groups and with imper-fect recognition of victims by the blenny. Spatial structure in the victim shoals could promote localised benefits in two ways: first, if the parasite avoids sites where it has been punished and second, if the parasite has preferred sites for attack, the effective group size is lower than the total group size. As a consequence, individuals that are frequently potential victims may gain from punishment (and may potentially be indi-vidually recognised), while individuals roaming lar-gely outside the parasite’s preferred attack areas may not gain from punishment (and may potentially remain anonymous).
A common victim of the blennies, the scalefin anth-ias, Pseudanthias squamipinnis (Bshary & Bshary 2010a), lives in shoals of 30–200 individuals without kin structure (Avise & Shapiro 1986), which excludes any kin selection benefits arising from punishment. Anthias are fish with small home ranges (Bshary 2001) and hence cannot escape a blenny by simply leaving its territory. With 8.5–28.4 strikes on anthias per hour (calculated on 17 and 11 h of observations, respectively), one could wonder whether the blenny can keep track of its past interactions (but see War-burton 2003 and references therein). However, as developed above, a punishing anthias would obtain a disproportionately high direct benefit in comparison
with other individuals (1) if a three-dimensional structure exists in groups of anthias and (2) if the blenny shows site fidelity. The combination of both effects would contribute to explain stable contribu-tions to a public good in the host–parasite system. We present here evidence for spatial structure in anthias shoals, as well as blenny site fidelity, and discuss potential implications of these results.
Methods
Study Site
Data were collected at Ras Mohamed National Park, Sinai, Egypt, between September and November 2008. The study site was at Mersa Bareika, a bay in which incoming sand through wadis led to the forma-tion of patch reefs that are separated from each other by sand rather than to the formation of a continuous reef.
The observations took place at five different reef patches (1–5) inhabited by approximately 100–200 anthias. The patches covered a ground surface of 6– 16 m2with a maximum height of<2 m (Table 1) and were situated between four and 6 m depth. The dis-tance between each patch ranged from 15 to more than 1000 m, a distance presumed to be sufficient to prevent any migration of anthias between patch reefs (Popper & Fishelson 1973).
Study Species
The piano fangblenny Plagiotremus tapeinosoma (Blee-ker, 1857), also named scale-eating or sabre-tooth blenny, is up to 14 cm long and occurs in coral reefs and lagoons of the tropical Indo-West and Central Pacific. It is a lepidophagous (i.e. scale-eating) species. It attacks its prey from behind to bite off pieces of skin, mucus or scales, quickly retreats to safety and then returns to an observation point to choose its next vic-tim (Johnson & Hull 2006; Bshary & Bshary 2010a).
Normally, it stops its biting attempts as soon as its vic-tim notices it (vicvic-tim turns around and faces it; per-sonal observation). Blennies have one hiding place, generally a deserted tube of a tube worm (Lieske & Myers 2004). Nearly all species (occasionally even predatory species) living at a given reef patch reef or visiting it are potential victims, but the blenny mainly focuses on smaller individuals (Bshary & Bshary 2010a).
One of the victims is Pseudanthias squamipinnis (Peters, 1855), the lyretail or scalefin anthias. It is a protogynous, hermaphroditic, up-to-15-cm-long coral reef fish living in the Indo-Pacific. It forms shoals with on average eight adult females per male (Shapiro 1981). It feeds on zooplankton swimming against the current in general between 0 and 7 m away from the reef, depending on shoal size (Popper & Fishelson 1973). It is considered as a resident species, staying within a relatively small, restricted area of the reef (Bshary 2001).
3-D geospatial distribution analysis of anthias and blennies
To study the 3-D spatial distribution of anthias, we marked between 21 and 28 females at each reef patch with visible implant elastomer (Northwest Marine Technology, Inc: Visible Implant Elastomer Tag, “VIE”). Each side of the fish could be marked at three places (which could be combined) just below the dor-sal fin: at the front (near the fish’s head, behind the operculum), in the middle and at the back (near the tail). Each fish was marked on only one side. Using two different colours (white and blue), but without combining them, we could create a maximum of 28 different combinations. Some additional individuals were recognisable with natural marks (Table 1). The same code identifying fishes was used for all patch reefs. For marking, the fish were caught in a 1.59 2.0 m barrier net with a mesh size of 0.5 cm. One diver caught a fish, placed it in a hand-net and
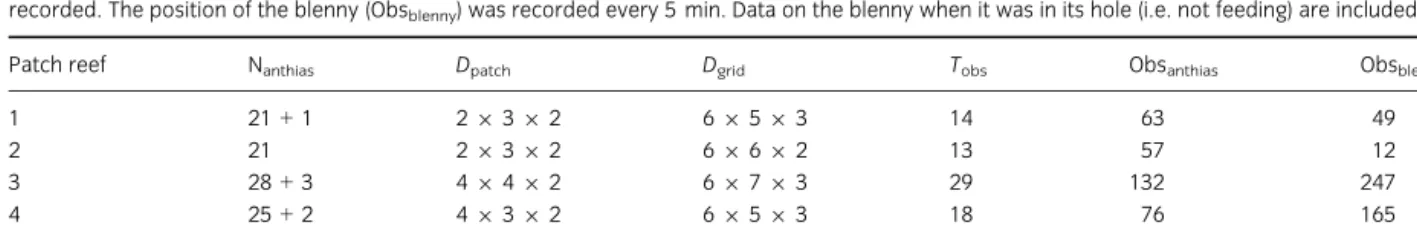
Table 1: Number of identified fishes (Nanthias: marked fishes+ individuals recognisable with natural marks), dimensions of the patch reefs (Dpatch, in metres) and the grids (Dgrid, number of cubes of 1 m3), total observation time (Tobs, in hours) and number of samplings at each patch reef. For anthias (Obsanthias), a single sampling lasted 5 min and was repeated every 15 min. During this period, the position of as many anthias as possible was recorded. The position of the blenny (Obsblenny) was recorded every 5 min. Data on the blenny when it was in its hole (i.e. not feeding) are included
Patch reef Nanthias Dpatch Dgrid Tobs Obsanthias Obsblenny
1 21+ 1 29 3 9 2 69 5 9 3 14 63 49
2 21 29 3 9 2 69 6 9 2 13 57 12
3 28+ 3 49 4 9 2 69 7 9 3 29 132 247
4 25+ 2 49 3 9 2 69 5 9 3 18 76 165
transferred it immediately to the other diver who had the elastomer injection needle ready. Fishes remained in the net for the injection and were released immedi-ately afterwards on their patch. The procedure lasted approximately 60 s. The procedure is likely to cause only minor harm to the fishes as they typically joined the shoal and foraged again right away. The fishes were not anaesthetised as this would have been a major manipulation with small benefits (not feeling the superficial injection), while the disadvantages would have been manifold: just the time until uncon-sciousness would have been longer than the marking procedure time interval; the effect of the drug is con-siderable; the waking up causes undesirable stress and would in addition increase the risk of predation as predators readily detect prey individuals that do not swim in the standard way. Our methods were approved by the Egyptian Environmental Affairs Agency in Cairo.
To divide the water volume occupied by the main body of fish, a rectangular grid of vertical ropes in a distance of 1 m from each other was constructed around the different patches (Shapiro 1986). These ropes were attached directly to the rocky substrate or to small dead coral blocks and were held vertically by floats. The third dimension was indicated with adhe-sive tape marks on the lines each metre above the sandy bottom. Thus, the water volume was subdi-vided into smaller cubic volumes (or cells) of 1 m3 (Fig. 1a), some of them being partially filled with coral. Cells were identified with coordinates in three dimensions and numbered from left to right and from the lowest layer to the highest layer. Table 1 gives the size of each patch reef and the number of grid cells. Note that the number of cells for a patch reef was not necessarily proportional to the size of the latter as this number was dependent on the movements of the fishes too. For instance, a fish swimming 2 m above a patch reef of dimensions 29 3 9 2 m = 12 m3
(width, depth and height, respectively) would add two complete layers of cells to the grid. The final number of cells on this patch reef would be 29 3 9 4 = 24 cells.
Observations by scuba diving, standing up 2 m away from the reef and moving around it, lasted 60 min per reef and per observation day. Data were collected only when fishes were foraging. Every 15 min and for a period of 5 min, the position of as many marked anthias as possible was recorded. The position of the blenny was recorded every 5 min. A given patch reef was never observed more than once per day. Between 13 and 29 h was spent on each patch reef (average: 18 h), leading to 57–132 sam-plings of positions of anthias (average: 77.6) and 12– 247 samplings of positions of blennies (average: 116.3) (Table 1). Except for patch reef 4 where one individual could not be found again, all marked indi-viduals were observed at least once again. On average, 31.8% of the individuals marked with VIE were observed during each sample of 5 min.
Data Analysis
A first analysis of the data on the spatial positions of anthias revealed that many cells of the grid were never visited by any anthias. Each of them visited on average only 14 cells of 90–126 cells. Carrying out an analysis including all cells (as in Fig. 1a) would have greatly decreased the expected number of observa-tions in each of them. Therefore, to test whether the home ranges of anthias are consistently non-overlap-ping, we divided each patch reef into four parts (along the x- and y-axes, similar to cutting a cake into four parts, Fig. 1b) of approximately the same number of cells (see Fig. 3). Because each individual was observed in a small percentage of all cells only, this method is considered to be conservative. The number of observations of each fish in each of the four parts was then calculated. A Pearson’s chi-square test of independence with 2000 Monte Carlo simulations (Sokal & Rohlf 1995) was performed in R 2.14.0 (R Development Core Team. 2011) to test for the differ-ence in space use between individuals. Only individu-als with at least 20 observations were included in the analysis. For the blenny, we tested with a simple Pear-son’s chi-square test whether it used heterogeneously (not randomly) the cells (as in Fig. 1a) it visited at least once, that is, whether it had at least one pre-ferred cell among all cells it visited. We did not include observations when the blenny was in its hid-ing place to avoid overestimathid-ing the importance of this position. Unfortunately, we could not use the
(a) (b)
Fig. 1: Graphical representation of how the patch reefs were divided into cells of 1 m3(a: for the observations of the blenny) or four areas (b: for the observations of the anthias).
blenny of patch reef 2, as the data were insufficient (12 observations).
Results
Individual Anthias Do Not All Use Space in the Same Way
Some individuals were observed more frequently than others in a certain region of the reef patch than in another (see Figs 2 and 3 for patch reef 3). The home range of each individual is only partly overlap-ping with the home range of its neighbours. On all five studied patch reefs, the distribution of observa-tions of individuals among the four parts into which the patch reefs were subdivided was dependent on the individual considered (Table 2). If we consider the cells that were visited at least once by an individual, on average only 39.7% (range 15.1–65.9%) of these cells were visited by (were shared with) another marked individual.
Anthias Tend to Stay at Their Initial Place or Return to it After a Blenny Attack
Being bitten did not make anthias change their posi-tion. For the two patch reefs where enough data could be collected, we calculated the distance between the cell where the attack occurred and the cell where the anthias was 10 s after the attack. Females stayed/ returned after having chased the blenny at their initial place in most of the cases at both patch reefs (patch reef 3: 72.4%, N = 29; patch reef 5: 67.7%, N = 99).
Blennies Show Site Fidelity
Like anthias, blennies tend to stay in a limited area of the reef, generally not far away from their hiding place. All blennies but the one of patch reef 1 were observed more frequently in some cells than others (Pearson’s chi-square test, patch reef 1: v2
2 = 4.4, p= 0.1; patch reef 3: v2 10 = 159.7, p < 0.001; patch reef 4:v2 7 = 156.4, p < 0.001; patch reef 5: v222= 404.6, Percentage of observations 0 20 40 60 80 100 60 22 44 24 32 53 38 64 62 25 60 75 69 101 39 43
Fig. 2: Use of the four areas (as in Fig. 1b) of patch reef 3 by the 16 indi-viduals that were observed more than 20 times. Each bar represents one individual, where the percentages of usage of each area are depicted in different shades of grey, while each shade denotes the same area for all individuals. Numbers at the top of each bar represent sample sizes.
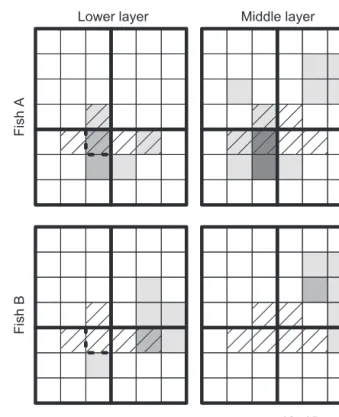
Fish A
Fish B
Lower layer Middle layer
0 1–5 6–9 10–15
Fig. 3: A case illustration: the space use of two anthias individuals (A and B) in the two lowest layers that comprise patch reef 3. The third, upper layer was omitted as only one observation was recorded there (for individual A). Grey tones correspond to classes of number of obser-vations. The zones delimited by thicker lines are the four parts used for the analysis of space use by anthias (see Methods, Fig. 1b). Dashed grid cells represent the home range of the blenny. The cell with thicker dashed outer line is the cell where the blenny had its hiding place. Table 2: Pearson’s chi-square test of independence (with 2000 Monte Carlo simulations) for the distribution of observations of individual anth-ias among the four parts into which the patch reefs were. Nind: number of marked individuals observed at the patch reef; Nobs: total number of observations
Patch reef Nind Nobs v2 p
1 9 263 113.6 0.0005
2 15 433 257.8 0.0005
3 16 811 502.4 0.0005
4 12 433 183.3 0.0005
p< 0.001). Figure 3 illustrates the distribution of the blenny at patch reef 3. At patch reef 1, 100% (N= 42; patch reef 3: 93.2%, N= 146; patch reef 4: 100%, N= 125; patch reef 5: 74.4%, N = 129) of all observa-tions were in the cell in which the blenny’s hole was located or in adjacent cells.
Discussion
Previous studies on interactions between sabre-tooth blennies and their victim host species found that vic-tim punishment against a cheater occurs even in locally abundant species (Bshary & Bshary 2010a) where punishment constitutes a public good (Bshary & Bshary 2010a,b). Contributions to public goods are instable in the standard public goods game (Olson 1965; Hardin 1968), which assumes anonymous interactions without the possibility to sanction cheat-ers and without communication. In humans, stable contributions to public goods may be achieved via institutionalised or peer punishment (Ostrom 1999; Fehr & Ga¨chter 2002), via reputation (Milinski et al. 2002) that may be linked to partner choice (Rocken-bach & Milinski 2011), and by allowing subjects to communicate with each other (Ostrom 1999; Janssen et al. 2010). These mechanisms will probably be rarely found in other animals owing to cognitive limi-tations (Brosnan et al. 2010). The aim of the current study was to assess whether in the absence of internal control mechanisms, a spatial structure may contrib-ute to alter payoffs in a way that contributions to the public good become self-serving.
We found that the space use is not the same among marked anthias of a shoal. The analysis of the position of anthias at the moment of the blennies’ attacks and 10 s after them shows that females very frequently returned to the exact same place. Both findings sup-port the hypothesis that anthias live in spatially struc-tured shoals. Shoal structure has also been reported for guppies. However, these studies focussed on near-est neighbours and demonstrated that individuals group according to size (Croft et al. 2003) and accord-ing to personality type (Croft et al. 2009), without testing whether individuals have preferred locations. Finally, blennies also showed a site preference. Taken together, these results suggest that individuals who share their home range more closely with the blenny are at higher risk of being attacked. Hence, anthias in the blenny’s core area share the public good of pun-ishment with fewer individuals than one would expect if one simply counted all conspecifics, which reduces effective group size and thus the risk that pun-ishment turns into a tragedy of the commons. Instead,
individuals that are frequently in the vicinity of the blenny may gain disproportional benefits from pun-ishment, which could make the act self-serving (Sherratt et al. 2009). On the other hand, individuals that are rarely exposed to the blenny would gain little from punishment as the blenny would likely move away anyway. Thus, if victims can flexibly react to the level of exposure to a blenny, one would predict that with increasing group size, the variation between indi-viduals in their propensity to punish would increase, with an increasing number of individuals not punish-ing. Bshary & Bshary (2010b) indeed observed a nega-tive correlation between group size and overall probability of punishment. However, it remains to be tested whether this result is indeed attributable to an increasing proportion of non-punishers with low interaction frequencies with the blenny.
Why individuals close to a blenny do not try to obtain a spot within the shoal further away with a reduced likelihood of being attacked currently remains unclear. On possibility could be that the blenny prefers to remain close to the centre of the shoal to reduce its predation risk (Hamilton 1971) and that its main victims remain because of similar antip-redation benefits.
Punishment may yield direct benefits in two possi-ble ways. First, the possi-blenny could recognise the indi-vidual that punished and simply avoid it in future. Second, if individual recognition is impaired but the blenny can remember where it was chased (Rodrı´guez et al. 2001; Broglio et al. 2003), it could focus its attention elsewhere for its next attack. The latter sce-nario would very likely yield a public good because a shift in location is often linked to a change in micro-habitat, which in turn increases the probability of encountering alternative host species (Williams 1991). But even if the blenny remains in the area, a public good may emerge if a blenny’s response to being punished is similar to that proposed for predator response to having captured armed or noxious prey, namely that the predator avoids look-alikes for some time (Huheey 1988). Both scenarios may occur according to a study on interindividual variation in blennies with respect to foraging strategies (A. Bshary & R. Bshary, unpubl. data), which is visible in the field data presented in Fig. 1 in Bshary & Bshary (2010b). Some blennies seem to focus on particular victim species while others do not, and some blennies appear to focus on particular victims while others appear to focus on particular locations (A. Bshary & R. Bshary, unpubl. data).
In conclusion, the results complement previous research on this host–parasite system (Bshary &
Bshary 2010a,b; A. Bshary & R. Bshary, unpubl. data) that focussed more on individual recognition as a mechanism by which punishers may gain dis-proportionate benefits from their acts. Spatial group structure of victims combined with the parasite’s preference for certain locations may reinforce the self-serving nature of punishment in individuals that are regularly exposed to the blenny. Overall, the results on interactions between blennies and the vic-tims support recent developments in modelling that argue that the assumptions of the iterated N-player prisoner’s dilemma framework may not often be met in nature. Changes in the assumptions about the relationship between N contributors and payoff func-tion (Archetti 2009a,b; Archetti & Scheuring 2011; Raihani & Bshary 2011) or the introduction of a spa-tial structure (Sherratt et al. 2009) may readily explain self-serving punishment and the emergence of public goods.
Acknowledgements
We thank the Egyptian Environmental Affairs Agency for the permission to conduct research in the park, the park rangers and Ingo Riepl for local support, and Laurent Keller for supporting GC. We are grateful to Nichola Raihani and two anonymous reviewers for critical and constructive reading of earlier drafts. The study was financed by a grant of the Swiss Science Foundation to RB.
Literature Cited
Archetti, M. 2009a: Cooperation as a volunteer’s dilemma and the strategy of conflict in public goods games. J. Evol. Biol.22, 2192—2200.
Archetti, M. 2009b: The volunteer’s dilemma and the optimal size of a social group. J. Theor. Biol.261, 475—480.
Archetti, M. & Scheuring, I. 2011: Coexistence of coopera-tion and defeccoopera-tion in public goods games. Evolucoopera-tion65, 1140—1148.
Arnal, C. & Morand, S. 2001: Importance of ectoparasites and mucus in cleaning interactions in the Mediterra-nean cleaner wrasse Symphodus melanocercus. Mar. Biol. 138, 777—784.
Avise, J. C. & Shapiro, D. Y. 1986: Evaluating kinship of newly settled juveniles within social groups of the coral reef fish Anthias squamipinnis. Evolution40, 1051—1059.
Boyd, R., Gintis, H., Bowles, S. & Richerson, P. J. 2003: The evolution of altruistic punishment. Proc. Natl. Acad. Sci. USA100, 3531—3535.
Broglio, C., Rodrı´guez, F. & Salas, C. 2003: Spatial cogni-tion and its neural basis in teleost fishes. Fish Fish.4, 247—255.
Brosnan, S. F., Salwiczek, L. & Bshary, R. 2010: The inter-play of cognition and cooperation. Philos. Trans. R. Soc. Lond., Ser. B: Biol. Sci.365, 2699—2710.
Brown, J. L. 1983: Cooperation: a biologists dilemma. Adv. Study Behav.13, 1—37.
Bshary, R. 2001: The cleaner fish market. In: Economics in Nature (Noe¨, R., van Hooff, J. A. R. A. M. & Hammer-stein, P., eds). Cambridge Univ. Press, Cambridge, pp. 146—172.
Bshary, R. 2010: Decision making: solving the battle of the fishes. Curr. Biol.20, R70—R71.
Bshary, R. & Bergmu¨ller, R. 2008: Distinguishing four fundamental approaches to the evolution of helping. J. Evol. Biol.21, 405—420.
Bshary, R. & Bronstein, J. 2011: A general scheme to pre-dict partner control mechanisms in pairwise cooperative interactions between unrelated individuals. Ethology 117, 271—283.
Bshary, A. & Bshary, R. 2010a: Interactions between sabre-tooth blennies and their reef fish victims: effects of enforced repeated game structure and local abundance on victim aggression. Ethology 116, 681—690.
Bshary, A. & Bshary, R. 2010b: Self-serving punishment of a common enemy creates a public good in reef fishes. Curr. Biol.20, 2032—2035.
Clutton-Brock, T. H. & Parker, G. A. 1995: Punishment in animal societies. Nature373, 209—216.
Connor, R. C. 1986: Pseudo-reciprocity: investing in mutualism. Anim. Behav.34, 1562—1566. Croft, D. P., Arrowsmith, B. J., Bielby, J., Skinner, K.,
White, E., Couzin, I. D., Magurran, A. E., Ramnarine, I. & Krause, J. 2003: Mechanisms underlying shoal com-position in the Trinidadian guppy, Poecilia reticulata. Oi-kos100, 429—438.
Croft, D. P., Krause, J., Darden, S. K., Ramnarine, I. W., Faria, J. J. & James, R. 2009: Behavioural trait assortment in a social network: patterns and
implications. Behav. Ecol. Sociobiol. 63, 1495—1503. Diekmann, A. 1985: Volunteer’s Dilemma. J. Conflict
Resolut.29, 605—610.
Eckes, M. J., Siebeck, U. E., Dove, S. & Grutter, A. S. 2008: Ultraviolet sunscreens in reef fish mucus. Mar. Ecol. Prog. Ser.353, 203—211.
Fehr, E. & Ga¨chter, S. 2002: Altruistic punishment in humans. Nature415, 137—140.
Hamilton, W. D. 1971: Geometry for the selfish herd. J. Theor. Biol.31, 295—311.
Hardin, G. 1968: The tragedy of the commons. Science 162, 1243—1248.
Huheey, J. E. 1988: Mathematical models of mimicry. Am. Nat.131, S22—S41.
Janssen, M. A., Holahan, R., Lee, A. & Ostrom, E. 2010: Lab experiments for the study of social-ecological systems. Science328, 613—617.
Johnson, M. L. & Hull, S. L. 2006: Interactions between fangblennies (Plagiotremus rhinorhynchus) and their potential victims: fooling the model rather than the client? Mar. Biol.148, 889—897.
Lehmann, L., Keller, L., West, S. & Roze, D. 2007: Group selection and kin selection: two concepts but one process. Proc. Natl. Acad. Sci. USA104, 6736—6739. Leimar, O. & Hammerstein, P. 2010: Cooperation for direct
fitness benefits. Philos. Trans. R. Soc. Lond., Ser. B: Biol. Sci.365, 2619—2626.
Lieske, E. & Myers, R. F. 2004: Coral Reef Guide Red Sea. HarperCollins, London.
Milinski, M., Semmann, D. & Krambeck, H. J. 2002: Repu-tation helps solve the ‘tragedy of the commons’. Nature 415, 424—426.
Moland, E. & Jones, G. P. 2004: Experimental confirma-tion of aggressive mimicry by a coral reef fish. Oecologia 140, 676—683.
Nico, L. G. & de Morales, M. 1994: Nutrient content of piranha (Characidae, Serrasalminae) prey items. Copeia 1994, 524—528.
Nowak, M. A. & Sigmund, K. 1998: Evolution of indirect reciprocity by image scoring. Nature393, 573—577. Olson, M. 1965: The Logic of Collective Action. Harvard
Univ. Press, Cambridge.
Ostrom, E. 1999: Coping with tragedies of the commons. Annu. Rev. Polit. Sci.2, 493—535.
Popper, D. & Fishelson, L. 1973: Ecology and behavior of Anthias squamipinnis (Peters, 1855) (Anthiidae, Teleo-stei) in coral habitat of Eilat (Red Sea). J. Exp. Zool. 184, 409—423.
R Development Core Team. 2011: R: A Language and Environment for Statistical Computing, 2.14.0 edn. R Foundation for Statistical Computing, Vienna, Austria. Raihani, N. J. & Bshary, R. 2011: The evolution of
punish-ment in N-player public goods games: a volunteer’s dilemma. Evolution65, 2725—2728.
Raihani, N. J., Thornton, A. & Bshary, R. 2012: Punish-ment and cooperation in nature. Trends Ecol. Evol.27, 288—295.
Rockenbach, B. & Milinski, M. 2011: To qualify as a social partner, humans hide severe punishment, although their observed cooperativeness is decisive. Proc. Natl. Acad. Sci. USA108, 18307—18312.
Rodrı´guez, F., Lo´pez, J. C., Vargas, J. P., Broglio, C., Go´mez, Y. & Salas, C. 2001: Spatial memory and
hippocampal pallium through vertebrate evolution: insights from reptiles and teleost fish. In: 3rd Euro-pean Conference on Comparative Neurobiology. Pergamon-Elsevier Science Ltd, Mjurcia, Spain, pp. 499—503.
Sachs, J. L., Mueller, U. G., Wilcox, T. P. & Bull, J. J. 2004: The evolution of cooperation. Q. Rev. Biol.79, 135—160.
Schneider, J. M. & Bilde, T. 2008: Benefits of cooperation with genetic kin in a subsocial spider. Proc. Natl. Acad. Sci. USA105, 10843—10846.
Shapiro, D. Y. 1981: Behavioral changes of protogynous sex reversal in a coral reef fish in the laboratory. Anim. Behav.29, 1185—1198.
Shapiro, D. Y. 1983: On the possibility of kin groups in coral reef fishes. In: Ecology of Deep and Shallow Coral Reefs. (Reaka, M. L., ed). National Oceanic and Atmo-spheric Administration, Washington, D.C., pp. 39—45. Shapiro, D. Y. 1986: Intra-group home ranges in a
female-biased group of sex-changing fish. Anim. Behav.34, 865—870.
Shephard, K. L. 1994: Functions for fish mucus. Rev. Fish Biol. Fish.4, 401—429.
Sherratt, T. N., Roberts, G. & Kassen, R. 2009: Evolution-ary stable investment in products that confer both an individual benefit and a public good. Front. Biosci.14, 4557—4564.
Sokal, R. R. & Rohlf, F. J. 1995: Biometry: The Principles and Practice of Statistics in Biological Research, 3rd edn. W. H. Freeman and Company, New York.
Subramanian, S., Ross, N. W. & MacKinnon, S. L. 2008: Comparison of antimicrobial activity in the epidermal mucus extracts of fish. Comp. Biochem. Physiol. B: Biochem. Mol. Biol.150, 85—92.
Tebbich, S., Bshary, R. & Grutter, A. S. 2002: Cleaner fish Labroides dimidiatus recognise familiar clients. Anim. Cogn.5, 139—145.
Warburton, K. 2003: Learning of foraging skills by fish. Fish Fish.4, 203—215.
West, S. A., Diggle, S., Buckling, A., Gardner, A. & Griffins, A. S. 2007a: The social lives of microbes. Annu. Rev. Ecol. Evol. Syst.38, 53—77.
West, S. A., Griffin, A. S. & Gardner, A. 2007b: Evolution-ary explanations for cooperation. Curr. Biol.17, R661— R672.
Williams, D. M. 1991: Patterns and processes in the distribution of coral reef fishs. In: The Ecology of Fishes on Coral Reefs (Sale, P. F., ed). Academic Press, San Diego, CA, pp. 437—474.