Accessibility Impact Analysis of New Public Transit Projects in Cairo, Egypt
By
Adham Kalila
B.Eng in Civil Engineering McGill University Montreal, Canada (2012)
Master of Science in Transportation Massachusetts Institute of Technology
Cambridge, Massachusetts (2018)
Submitted to the Department of Urban Studies and Planning in partial fulfillment of the requirements for the degree of
Master of Science in Urban Planning
at the
MASSACHUSETTS INSTITUTE OF TECHNOLOGY
June 2019
© 2019 Adham Kalila. All Rights Reserved
The author hereby grants to MIT the permission to reproduce and to distribute publicly paper and electronic copies of the thesis
document in whole or in part in any medium now known or hereafter created.
Author________________________________________________________________________ Department of Urban Studies and Planning 05/21/2019
Certified by____________________________________________________________________ Professor Sarah Williams
Department of Urban Studies and Planning Thesis Supervisor
Accepted by___________________________________________________________________
Professor of the Practice, Caesar McDowell
Co-Chair, MCP Committee Department of Urban Studies and Planning
2
Accessibility Impact Analysis of New Public Transit Projects in Cairo, Egypt
By
Adham Kalila
Submitted to the Department of Urban Studies and Planning on May 21, 2019 in Partial Fulfillment of the Requirements for the Degree of Master of Science in Urban Planning
Abstract
The New Urban Communities (NUC), built around Cairo, developed to relieve congestion and pull away residents from the crowded core, have not successfully attracted a significant number of residents. Since NUCs are not well connected by official public transport to the inner city, their residents rely on private cars and informal or expensive private mass transit to reach the job markets of inner Cairo. Although in official strategy plans, no direct link is drawn between the difficulty of moving between and within NUCs and their low occupancy rates, NUCs can be attractive places to live for diverse socio-economic groups if their accessibility to jobs and points of interest were improved. There is growing interest from the World Bank and the Egyptian government to invest in public transport routes in the Greater Cairo Region to improve job accessibility and relieve traffic congestion. Applying existing methods to measure the impact of different routes on job accessibility requires data on the location and density of jobs which is not readily available in many data-poor cities in the global south. A novel method was applied to produce a job density data set, combining scraped location and categorical data on businesses from online directories with official census and survey data on job numbers and industry types. This thesis explores the locations of employment opportunities in the absence of official data and the accessibility of the population to these opportunities in the Greater Cairo Region in order to assess the different levels of accessibility to jobs by public transport and inform the priorities of future investment in public transport provision. The research results in recommendations on where 3 routes, out of 10 given corridors, should be placed based on the impact of these new transit lines towards job accessibility. Using location-based accessibility models combined with a novel approach to developing job location data, the work identifies bus routes that performed the best in getting the largest number of people to jobs given considerations of socio-economic equity.
Thesis Supervisor: Sarah Williams
3
Contents
1 INTRODUCTION ... 8
1.1 RESEARCH QUESTION AND HYPOTHESIS ... 12
1.2 STRUCTURE OF THE THESIS ... 13
2 LITERATURE AND HISTORY REVIEW ... 14
2.1 A POLITICAL HISTORY OF CAIRO ... 14
2.1.1 New Urban Communities in Egypt ... 19
2.2 A REVIEW OF CAIRO TRANSPORT STUDIES ... 21
2.3 A REVIEW OF ACCESSIBILITY STUDIES ... 23
2.3.1 More Complex Measures of Accessibility ... 26 2.3.2 Software and Implementation Methods ... 28 3 DATA COLLECTION ... 29 3.1 OPPORTUNITIES DATA ... 29 3.1.1 Web Scraping and Category Selection ... 30 3.1.2 Data Cleaning ... 32 3.2 PUBLIC TRANSPORT ROUTE DATA ... 33 3.2.1 Existing Transport Data ... 33 3.2.2 Frequency Data Collection ... 35 3.2.3 Future Transport Data ... 36
3.3 CORRIDOR SELECTION FOR POTENTIAL PUBLIC TRANSPORT INTERVENTION ... 38
3.4 POPULATION DATA ... 39
4
4.1.1 Limitations of the Accessibility method chosen ... 42
4.2 H3 HEXAGONS AS UNIT OF ANALYSIS ... 43
4.2.1 Boundaries of the Greater Cairo Region Study Area ... 43
4.3 THE OPPORTUNITIES (SPATIAL EMPLOYMENT) MODEL ... 45
4.4 CREATING THE GTFS ... 47
4.5 THE IMPLEMENTATION OF THE MODEL ... 50
5 RESULTS ... 52
5.1 CURRENT SITUATION IN THE GREATER CAIRO REGION ... 52
5.1.1 Population GCR 2018 ... 52
5.1.2 Job Distribution ... 54
5.1.3 Job Accessibility ... 57
5.2 COMPARISON OF CORRIDORS FOR INTERVENTION ... 60
5.2.1 Equity Considerations ... 61
5.2.2 Single PPTI Results ... 62
5.2.3 Double PPTI Results ... 65
5.3 FINAL RECOMMENDATIONS ... 68
6 CONCLUSION ... 70
6.1 DETAILS ON THE FINDINGS OF THE STUDY ... 71
6.2 NON-ACCESSIBILITY FINDINGS ... 73
6.3 FUTURE WORK ... 75
5
LIST OF FIGURES
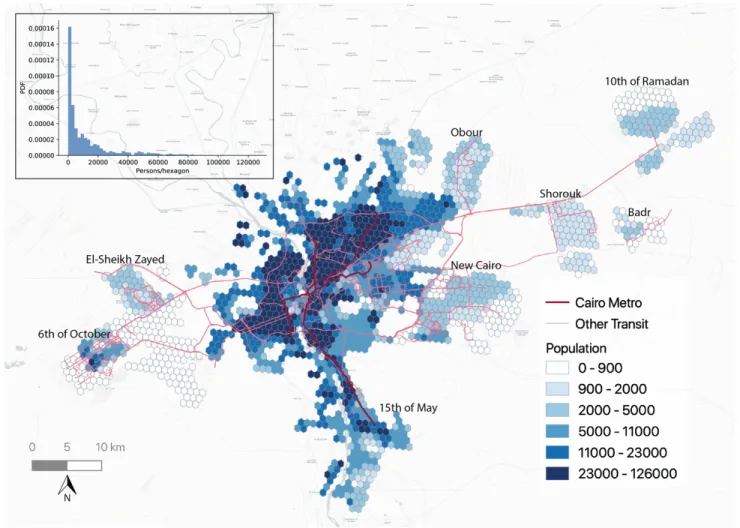
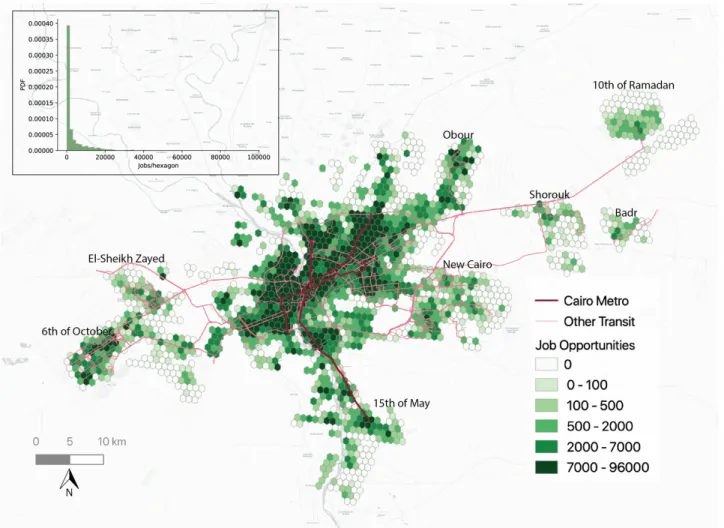
Figure 3. 1 Future Transport Projects and NUC locations in the GCR. Source: Transport for Cairo ... 38 Figure 4. 1 Areas included in the study within the GCR and their delineations as Central, Inner, or Outer ... 44 Figure 4. 2 Accessibility Mode Flow Chart Diagram ... 50 Figure 5. 1 Distribution of Population by H3 Hexagon. (Top Left) Histogram of the distribution number of persons/ hexagon. Map showing population on choropleth map and Transit in Cairo. ... 54 Figure 5. 2 Distribution of Job Density by H3 Hexagon. (Top Left) Histogram of the distribution number of jobs/ hexagon. Map showing job denisty on choropleth map and Transit in Cairo. ... 56 Figure 5. 3 Distribution of Accessibility Indicators of jobs accessible within one hour of travel by transit by H3 Hexagon. (Top Left) Histogram of the distribution number of percentage of jobs accessible/hexagon. Map showing job denisty on choropleth map and Transit in Cairo. ... 58 Figure 5. 4 Map of the normalized ration of Job Accessibility over Population by hexagon. Transit in Cairo is also shown for reference ... 60 Figure 5. 5 Map of Real Estate Prices [EGP/m]. Source: Aqarmap.com online real estate brokerage website ... 62 Figure 5. 6 Map of the Corridors along which distint PPTIs are considered. Eah Corridor is given a scenario letter from B to M. Future transport projects included in the analysis are shown for reference. ... 63 Figure 5. 7 Map of Improvement in Accessibilty indicator by Hexagon after the choice of PPTI recommendations ... 69
6
LIST OF TABLES
Table 2. 1 New Urban Communities listed by Generation of Inception ... 20
Table 2. 2 Types of Accessibility Measures in order of increasing complexity. Source: Zegras 2005 ... 25
Table 3. 1 Categories used to scrape online sources for business locations in the GCR ... 31
Table 3. 2 Details of the Agencies and types of Buses mapped by Transport for Cairo ... 34
Table 4. 1 Total Count of Jobs by Governorate (Source CAPMAS 2017) ... 46
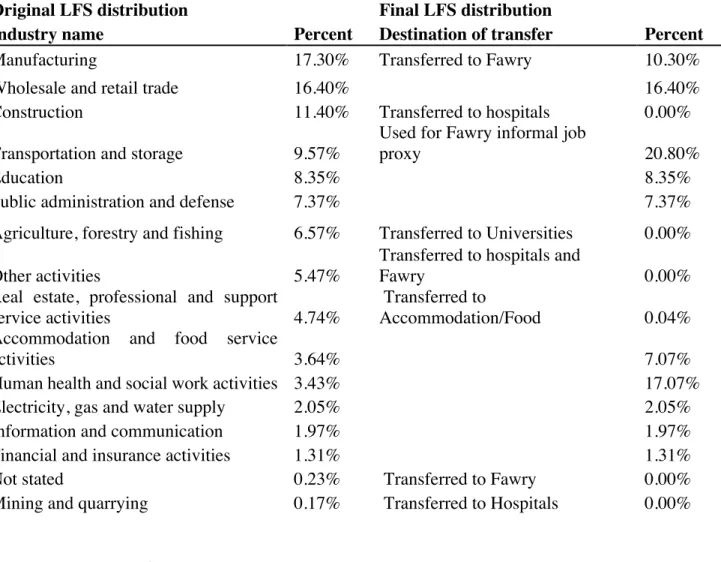
Table 4. 2 Original Distribution of Jobs by Industry according to the Labor Force Survey (LFS) and the Final Distribution after alterations ... 47
Table 4. 3 Shows the base GTFS data and the assumptions made about frequency ... 48
Table 5. 1 Top Ten Neighborhoods of GCR ranked by population in hexagon and by population in entire neighborhood ... 53
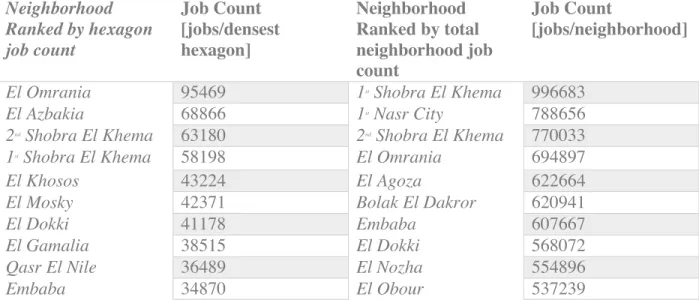
Table 5. 2 Top Ten Neighborhoods of GCR ranked by Job Count in hexagon and by Job Count in entire neighborhood ... 55
Table 5. 3 Interpretations of the Normalized Accessibility over Population Ratios ... 59
Table 5. 4 Single PPTI Accessibility Model Results for NUCs ... 64
Table 5. 5 Single PPTI Accessibility Model Results for Non-NUCs ... 64
Table 5. 6 Double PPTI Accessibility Model Results for NUCs ... 66
7 Table 5. 8 Triple PPTI Accessibility Model Results for NUCs ... 67 Table 5. 9 Double PPTI Accessibility Model Results for Non- NUCs ... 67
8
1 Introduction
Egypt, the most populous country in the Middle East and North Africa, is home to almost 100
million Egyptians living along the banks of the River Nile. Since the second world war, Egypt has
witnessed several changes in local and global ideologies of development after independence.
Economically, the state went from total social responsibility to a Neo-liberal approach of
governing the multitude of independent capitalist ventures. The transportation sector followed a
similar route. It was also influenced by global trends towards disinvestment from rail transport in
favor of private motor vehicle transport. Today, it is actively removing its urban tram networks in
Cairo and investing in road infrastructure to support its 1970s style suburbs. In reality, those
suburbs are not achieving their potential because of their inadequate connection to existing job
markets in Cairo.
Road transport is the predominant mode of transport in Egypt in terms of passenger and freight
movement. The national government continues to expand the road network throughout the country.
Motorization rates are increasing: Private car ownership is increasing at triple the rate of population
growth. Motorcycles, Auto Rickshaws (Tok-tok) and other forms of motorized transport are
proliferating, particularly in secondary cities.
Despite the plethora of laws attempting to govern transportation in Egypt, there is no published
holistic vision as to the role that public transport should play in the future of the country’s cities:
9 expense of any alternate vision to effectively utilize other modes of transport. The devolution of
paratransit licensing across multiple public institutions resulted in complex inter- and intra-city
paratransit networks that compete with the formal systems in a race to the bottom; issues of
transport justice and public transport access, service levels and safety are systematically ignored
leading affluent residents to claim that they have no choice but to use their cars to commute to and
from work as public transport is not regarded as a viable alternative to the car.
Egypt’s modern history has always been marked by class differences. From before the
establishment of the republic in 1953, the Europeans and aristocrats led lives that were socially
and materially unrecognizable to the rural Egyptian population. After the social shake-up that
followed the 1952 revolution, the divisions continued but were defined less by race and language
than by institutional membership (like the civil service or professional syndicates) before the
market liberalization of the 1970s or ‘infitah’, and eventually socio-economic demographics after.
Today’s decision makers invariably hail from the class that can afford to use private cars as its
main mode of transport. Their concept of public space, housing, transportation, and the right to the
city is influenced by this privilege that is taken for granted.
The planning and governance of Cairo’s transportation network is developed by those who own
cars, and therefore is biased toward their needs. Sidewalks are rarely kept in working condition if
they are present at all. Cycling is dangerous and little effort is made to accommodate it (Kingsley,
2013). Public transport vehicles and services are started in good conscience but left to deteriorate
with no plan for maintenance (World Bank, 2014). Even cars, the most highly prioritized of modes,
10 movements, leaving important decisions of right-of-way to be negotiated at every intersection in
a game of survival of the fittest (BBC, 2009). The current transportation situation in Egypt reflects
a broader institutional inability to implement a functional system. The authorities build tunnels,
overpasses, and highways for a mere 13.5% of Cairenes who drive, consume subsidized fuel, and
pollute the city, disregarding the majority who walk, cycle, and ride collective transport. What is
left is a transportation political ecosystem that is encouraged to spend its meager resources on the
least efficient mode, the private car.
The official response to population growth and congestion in the cities was then to encourage the
suburbanization of desert land through New Urban Communities (NUCs) ranging in their distance
to downtown Cairo from about 10 to 50 km yet barely connected to it except by a few highways.
Cairo’s high population density is regarded as the cause of roadway congestion, and the
deterioration of quality of life that follows. New low-density NUCs are heralded as the solution.
Yet, the NUCs significantly increase total vehicle-miles travelled (VMT), due to their distances to
the labor market of Cairo, and sprawling area sizes. NUCs thus increase contribution to pollution
and CO2 emissions.
On the other hand, the world is waking up to the consequences of its rapid modernization and its
effect on the climate and the Earth’s natural ecosystems. In this era of climate change
consciousness since the early 2000s, research and theory in urban planning have focused on ways
to measure and mitigate the need for urban transportation to achieve accessibility. It is widely
accepted that people move around the city to fulfill their needs and maximize their utility (Maat et
11 accessibility measures the ability of people to reach a desired set of opportunities using
transportation modes available to them given the constraints of time, money, and individual ability.
These measures try to quantify theories that have existed in the urban planning field since the mid
20th century. It is clear from mere observation that NUCs would not score very high on any
measure of accessibility since inner Cairo retains most opportunities for work and leisure.
NUCs have not lived up to expectations. David Sims calculated that two-thirds of Cairo’s residents
live within 15 kilometers of the center, with the NUCs attracting on average a fifth of their target
population. He estimated that over half of affordable public housing units developed within the
NUCs remain vacant (Sims, 2015), indicating that the allure of informal housing or ‘Ashwayeat’
is not only in its relative affordability. More recent official figures given in defense of the NUC
occupancy rates list the first phase of New Cairo at 65% residents to target population, El Sheikh
Zayed city at 50%, Shorouk City at 55%, and 6th of October City at 75%. These figures, however,
are neither publicly available nor do they cover the entire spectrum of NUCs within the GCR for
an accurate comparison. (Mohie 2018a)
Inadequate services, long commutes to work and the added cost of travelling long distances are
problems for existing residents and deterrents for reallocation to the NUCs. This was confirmed in
field research conducted in the housing complex of Masakin Uthman (Shalabi, 2015), as well as
the city of Asmarat (Mohie 2018b), both public housing complexes intended for rehousing
residents of informal neighborhoods. Instead, citizens are attracted to the ‘Ashwayeat’, which
promise better accessibility to jobs and services. Moreover, deteriorating traffic congestion in the
12 city’s core job market. An objective method of measuring such an imbalance between job locations
and worker’s ability to reach such jobs is found in accessibility analyses. The challenge to the
decision-makers is that accessibility analyses are dependent on the availability of data, which is
recently becoming essential to any data-driven consideration of interventions. It is also very
dependent on the local context in which it is applied. Such data is only recently becoming available
for Cairo, opening the space for the first such in-depth summary of the transportation ecosystem
of Egypt.
1.1 Research Question and Hypothesis
This thesis explores the locations of employment opportunities in the absence of official data and
the accessibility of the population to these opportunities in the Greater Cairo Region in order to
assess the different levels of accessibility to jobs by public transport and inform the priorities of
future investment in public transport provision. Currently, New Urban Communities (NUC) are at
a disadvantage with regards to accessing job and business opportunities which are concentrated in
the inner city agglomeration. With limited funding and opportunity to improve the situation
through new bus routes on certain corridors, this thesis provides a data-driven approach for
prioritizing the implementation of new transit routes. This thesis focuses on recommending three
bus or light rail routes in the GCR chosen from 10 corridors that can withstand the required
13
1.2 Structure of the Thesis
This study is split by chapters. The second chapter reviews the literature on accessibly measures
and other studies produced about the GCR. It also provides a brief history of political changes in
the country over the past century especially with regards to transportation policy. Chapter 3 details
the data used for the analysis and its origins. Some data were collected from the field, others
obtained from official sources and finally, some were scraped from online directories. Chapter 4
details the methods used in computing the accessibility and the results. Chapter 5 provides a
description of the results of the model and its limitations as well as recommendations on corridors.
Finally, the concluding chapter, chapter 6, reviews the contributions of this study and recommends
14
2 Literature and History Review
The following chapter describes the work that has been done previously in the two main fields
with which this thesis is concerned; accessibility studies and the Greater Cairo Region (GCR) in
Egypt. Transportation studies as we know them today are the result of extensive work done in the
mid 20th century. Likewise, Egypt owes its current transportation situation to its modern history
going back no more than two centuries. The following section will outline Egypt’s political history
as it relates to Cairo’s transportation infrastructure. It will be followed by a literature review of
studies on accessibility. Finally, a summary of transportation studies conducted on Cairo will be
given and the current work will be placed in its local context.
2.1 A Political History of Cairo
Modern Egypt traces its most relevant history only two centuries back to the reign of Muhammad
Ali Pasha, who ruled Egypt in the 19th century as a state of the Ottoman Empire. His descendants
went on to rule as Khedives of Egypt, then an autonomous vassal state which became the Arab
Republic of Egypt in 1953 after a military coup (Sayyid-Marsot, 1985). It has since had five
consequential presidencies that have each contributed to its ongoing development. Transportation
has been an essential part of its progress whether planned by the authorities or left to free
15 The major cities in Egypt, Alexandria and Cairo, saw some of the earliest private investment in
mass transportation in the world in 1863 and 1906 respectively in addition to a wide array of
private bus operators inside the cities (APTA Website). On the other hand, intercity transport was
the operated by the Egyptian National Railways, which was completed by the first world war in
1914. Prior forms of collective transport like horse-drawn omnibuses and cabbies were banned
from using the trams’ newly paved streets (Tadamun, 2017). These early forms of private
entrepreneurial paratransit services adapted by offering complimentary services from the tram
stations or when the trams stopped working at night. These varied enterprises ultimately gave way
to public institutions under Gamal Abdel Nasser’s socialist policies after the revolution of 1952
brought him to power.
Nasser’s policies resulted in the nationalization of previously private tram and bus companies
using law 61 of 1963 which gave the president the power to create public authorities by decree to
operate utilities for the good of the public. The most prominent of these public authority companies
are the Alexandria Transport Authority (ATA) and the Cairo Transport Authority (CTA)
established in 1965 and 1966 respectively. They reorganized and subsumed all hitherto
nationalized intra-city transport services in their respective cities, while the inter-city railways
were reorganized to conform to the new public authority model (Hegazy, 2018). These utility
companies still exist today but major changes in their role and reach have been implemented ever
since, most notably when Nasser died and his successor, president Mohamed Anwar Sadat shifted
16 As soon as Sadat took power following Nasser’s death in 1970, he switched to a neo-liberal
economic policy commonly known as ‘infitah’. He passed a new law with the first 6 months into
his presidency, law 22 of 1971, to organize public transport of passengers by car. While it still
ensured a monopoly for public authorities to operate the public utility of passenger transport, it
also defined such a utility and stressed its cooperative operation alongside new modes within
specified boundaries and routes. The new mode was specified for private cars that “each do not
carry less than 8 passengers at minimum” (law 22/1971, Egypt)
With the replacement of this law in 1974 and again in 1975 with revised versions, the government
was given the right to grant concessions to the private sector to operate transit services. These
enabled the legal operation of paratransit vehicles, commonly using Peugeot 504 station wagons.
Originally intended for long-range inter-city travel; the law was eventually used to justify services
within urban areas. After the signing of the peace accords in 1978 and the flow of American aid
money to the Egyptian government, the Greater Cairo Bus Company was established and the
production of local station wagons was financed.
Sadat’s successor, Hosni Mubarak, continued with the same economic policy and dependence on
foreign aid after his assumption of power in 1981. One major development during his time in office
is the Cairo Metro. A national authority was established in 1983 to manage and implement plans
for an intra-city metro network that had been proposed since the 1930’s; operations of the largely
over-ground first line commenced in 1987. A 1990 law regulating construction in proximity of the
17 had in effect been a national project led by the state government rather than the local authorities
of the city of Cairo ever since.
A law issued in 1996 to reorganize the Ministry of Transportation expresses less concern with
different modes of transport and proper cost-benefit analysis than its 1976 counterpart. The
Ministry of Transport was reorganized four times over the Mubarak presidency, none of which
included any clauses relating to public transport, paratransit regulation, or cooperation with local
layers of government. Evidently, the focus of the government’s policies regarding transportation
during the Mubarak regime focused primarily on highway-building and not a coordinated plan
which includes various forms of public transportation.
After A 2006 World Bank recommendation to enhance governance, planning, service delivery and
sustainability, the Greater Cairo Transport Regulatory Authority (GCTRA) was established by
presidential decree number 349 in 2012, and accorded a budget from the general budget starting
fiscal year 2016. While its launching charter is progressive (Its jurisdiction theoretically
encompasses the Giza, Cairo and Qalubiya governorates comprising the GCR) and its powers
include various innovative mechanisms for fund-raising and operating. However even with these
funding mechanisms, GCTRA remains ineffectual and understaffed. With a yearly budget of
around 80,000 USD, it is hardly an active stake holder in any public transport project in Cairo. For
Comparison, the Massachusetts Bay Transportation Authority (MBTA) has been spending a
minimum of 246 million USD per year (D’Alessandro, 2009).
The current administration, led by president Abdel Fattah El-Sisi, is continuing in the tradition of
18 Unfortunately, that set of priorities is combined with an almost obsolete post world war 2 outlook
on modernization and city-building. This outlook, which is still the orthodoxy among Egyptian
planners, combines modernist high-rise developments in the city center that cater to a global elite
with low-density single-family housing on the outskirts that require a heavy dependence on private
cars to operate.
At the same time, foreign aid agencies and western governments committed to curbing the worst
effects of climate change are encouraging the development of better public transit. This has had a
direct impact on the stated objectives of countries like Egypt which are recipients of a significant
amount of foreign aid and are active in their participation in world governing bodies like the United
Nations. One of the commitments that pushes the authority in Egypt to spend some resources on
collective modes of transport is its stated objectives in the Sustainable Development Strategy:
Vision 2030 document.
The Sustainable Development Strategy: Vision 2030 document (SDS) is a working plan
encompassing economic, social and environmental goals for the country. It was drafted in line
with the Sustainable Development Goals Agenda of the United Nations. The SDS document was
produced after a 2-year participatory process which included civil society, the private sector, and
ministries and government agencies. Private vehicle transport is recognized in the SDS as a
significant contributor to pollution, CO2 emissions, and traffic congestion. It also recognizes the
19 In the SDS document, the low occupation rates of New Urban Communities (NUC) are also
recognized as a significant challenge, and tackled from multiple perspectives: incentives for
relocation, housing situation and distribution, living costs etc. However, no direct link is drawn
between the difficulty of moving between and within NUCs and their low occupancy rates. This
thesis will study the effect of new transit projects targeting the NUCs and their connectivity to the
job market.
2.1.1 New Urban Communities in Egypt
During Sadat’s presidency in the 1970s, growing concerns about the rapid illegal urbanisation of
agricultural land around major cities led to the establishment of the New Urban Communities
(NUC) Authority in law 59 of the year 1979. Its mandate was to create “new civilized centers for
achieving community stability and economic prosperity” and the “redistribution of inhabitants far
from the Nile Valley” (NUCA Website) to utilise the 96% of land area that is desert and avoid
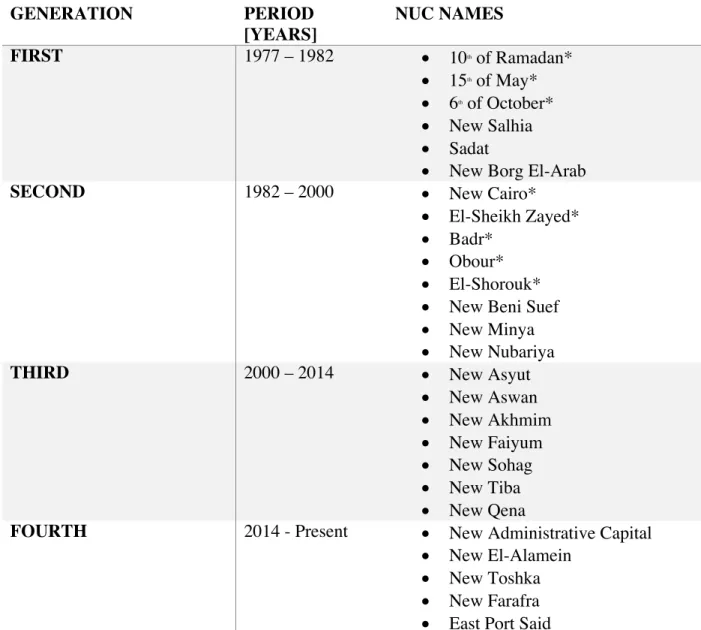
losing scarce agricultural land around the Nile Valley. Table 2. 1lists the new towns by period of
conception, starting from 1977 until today with the latest project around the GCR being the New
Administrative capital 50 km to the East of Cairo or 30 km East of New Cairo (Egyptian Ministry
20
Table 2. 1 New Urban Communities listed by Generation of Inception
GENERATION PERIOD [YEARS] NUC NAMES FIRST 1977 – 1982 • 10th of Ramadan* • 15th of May* • 6th of October* • New Salhia • Sadat
• New Borg El-Arab
SECOND 1982 – 2000 • New Cairo*
• El-Sheikh Zayed* • Badr*
• Obour* • El-Shorouk* • New Beni Suef • New Minya • New Nubariya
THIRD 2000 – 2014 • New Asyut
• New Aswan • New Akhmim • New Faiyum • New Sohag • New Tiba • New Qena
FOURTH 2014 - Present • New Administrative Capital • New El-Alamein
• New Toshka • New Farafra • East Port Said
* indicates NUCs in the Greater Cairo Region, included in this study. Source: http://www.newcities.gov.eg/
Today, the creation of new towns has taken on a life of its own, divorced from its original intentions
to depopulate the Nile Valley and avoid construction on agricultural land. The last four decades
have given rise to industries such as cement and steel manufacturers, real estate developers and
others that benefit from the creation of value in otherwise barren desert land. The government
21 leave middle to upper class housing to the private market (Fahmi, 2008). It facilitated investment
in the NUCs by providing infrastructure, such as roads and sewers, and cheap land prices.
However, the result was a rise in gated communities and unaffordable housing projects for all but
the highest-earning portion of residents (Fahmi, 2008). Some NUCs, such as Badr, 6th of October,
and New Cairo, have industrial areas with factories which were meant as anchors and jobs for
residents. However, these designated areas failed to attract the envisioned target populations due
in part to little transportation infrastructure and access to inner Cairo (Fahmi, 2008).
2.2 A Review of Cairo Transport Studies
There are several published studies about travel demand and planning in Cairo that were conducted
by multi-lateral agencies. The Japan International Cooperation Agency (JICA) is probably the
earliest and most prolific in Egypt. JICA started producing studies on different transportation
modes in Egypt since the early 1970s which included studies on the rehabilitation of airports,
highways, bridges, waterway transport, railways, metro, and trams. They are credited most with
producing an origin destination demand model for Cairo in 2002 named the Cairo Regional Area
Transportation Study (CREATS). They have also produced several master plans for transportation
planning as well as studies on the expansion of the Cairo Metro for Egypt (JICA, 2009; JICA,
2010; MiNTS, 2012). Unfortunately, the results of the travel demand studies are not publicly
available as a dataset and the master plans produced do not go into technical detail on the effects
or causes of the issues they attempt to solve.
On the other hand, the World Bank has produced several studies on Traffic in Cairo in 2006, 2010,
22 of traffic in Cairo and estimate the amount of money that such traffic jams cost the Egyptian
economy. Finally, a consortium of Egyptian and Danish consulting firms published a series of
reports titled Cairo Urban Transport Infrastructure Development Project (CUTID) (ACE, 2016).
The documents outlined the challenges faced by the formal transportation institutions in Cairo and
outlined ways to improve them both with regards to governance as well as technical changes.
Namely, with regards to governance, the CUTID report clearly recommends cutting back on the
number of employees within the Cairo Transport Authority and, apart from daily scheduling and
operational management, shift the planning functions to a new administrative unit similar to the
idea for GCTRA. On the technical side, it suggests the usage of Key Performance Indicators to
measure and set goals for operational efficiency. It lists as necessary steps the implementation of
a redesign of the bus network to simplify and consolidate the routes to a radial and concentric
circle plan in addition to a more data-driven method of analytics which uses real time data and
automatic fare collection systems (ACE, 2016).
Finally, the Ministries and government entities such as the National Authority for Tunnels and the
Central Agency for Public Mobilization and Statistics periodically release reports1. These are
usually summaries of projects underway or enumerations of infrastructure projects such as bridges
and tunnels. They do not conduct and publish analyses that aim to understand the effects of these
projects on the lives of citizens.
1 Monthly or quarterly enumeration reports accessible on
23 The reports and studies made by consulting firms or foreign aid agencies are more analytical in
nature than those of the government of Egypt. However, their recommendations are more structural
and organizational, rather than technical which may be due to a focus on the fundamental issues.
For example, the CUTID study proposed changes in the distribution and training of drivers and
depot managers in the Cairo Transport Authority. Otherwise, the study was exploratory and
produced travel demand profiles that are agnostic of the network supply-side solutions as in the
CREATS report. What is missing from the studies on transportation in Cairo is an operationalized
model of the effects of the proposed changes as measured by indicators, especially using data and
modern computing methods. Therefore, the current study aims to fill this gap in the transportation
and accessibility literature on The Greater Cairo Region in Egypt by producing original research
into the effects on job accessibility of implementing new protected bus routes on distinct travel
corridors, especially as a solution to the lack of connectivity witnessed in the NUCs.
2.3 A Review of Accessibility Studies
Martens (2017) defines accessibility as a personal resource that gives a person the possibility of
participation in desired activities out of the home, where choice is a function of place of residence,
level of income, and personal ability. This personal resource is shaped by land use patterns, the
distribution of services and opportunities over space and the transport system connecting distant
areas. Moreover, telecommunication networks are recognized for their ability to substitute travel
with interactions over distance, effectively altering accessibility as well (Litman, 2003). High
accessibility indicates a relative ease of reaching and benefiting from what the city has to offer
24 A growing number of studies looks at the impact of accessibility on access to the job market using
different approaches. Fol and Gallez (2014) identify four types of study approaches: Comparisons
of commuting time or distances between different social groups, attempts to measure the impact
of job accessibility on wages and maintaining jobs, comparisons of the impact of different living
locations on integration within the job market, and examinations of job market differences based
on location. Additionally, Jones and Lucas (2012) study the effect of transit costs on constraining
individuals from reaching their desired destinations.
Accessibility measures serve to describe the supply of transport services and the quality of
transport networks from the perspective of a group, mode, location, or activity (Litman 2017).
They are intricately linked with social groups: Several characteristics such as age, sex, income,
physical ability, time constraints and access to prohibitively expensive travel modes impact the
accessibility of individuals and result in different travel decisions between inhabitants of the same
geography. Geurs and Van Wee (2003) identify four components that affect accessibility. They
capture the effects of geographically dependent opportunities, the realities of the mode chosen for
transportation, the time availability of the person seeking access, and finally the individual’s
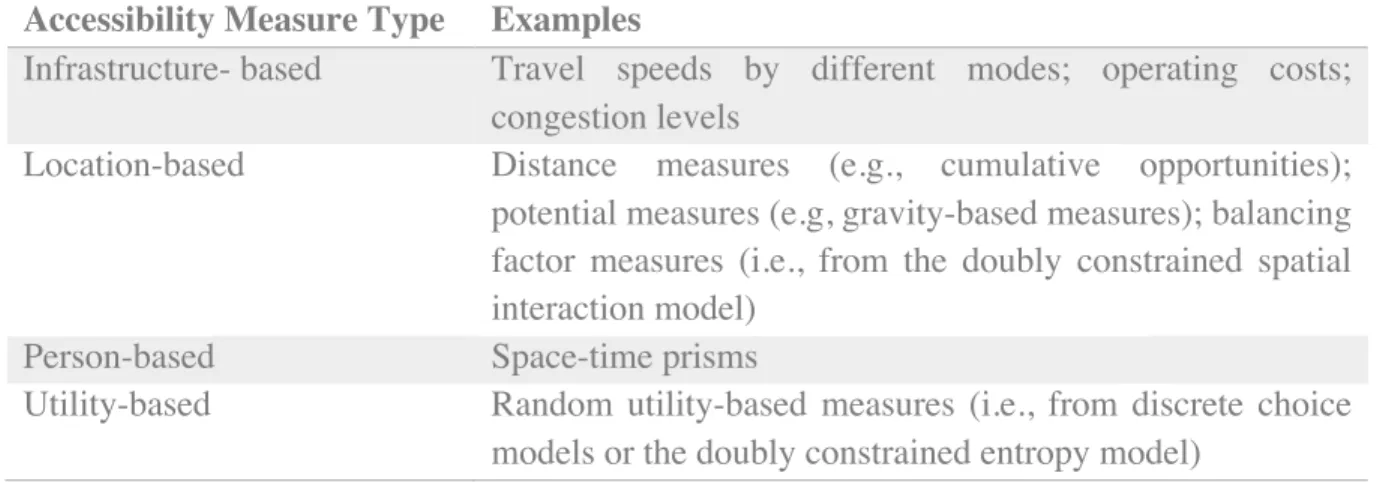
capabilities and privileges. They also categorize the distinct measures of accessibility into four
types, shown in Table 2. 2. As one goes down the table, the measures increase in complexity and
25
Table 2. 2 Types of Accessibility Measures in order of increasing complexity. Source: Zegras 2005
Accessibility Measure Type Examples
Infrastructure- based Travel speeds by different modes; operating costs; congestion levels
Location-based Distance measures (e.g., cumulative opportunities); potential measures (e.g, gravity-based measures); balancing factor measures (i.e., from the doubly constrained spatial interaction model)
Person-based Space-time prisms
Utility-based Random utility-based measures (i.e., from discrete choice models or the doubly constrained entropy model)
Martens (2006) claims that current transport planning policies favor the improvement of mobility,
or the movement of people, over accessibility, the opportunities available given certain
circumstances, by prioritizing easy-to-measure variables such as time travel (Infrastructure-based
in Table 2. 2). He recommends correcting for this by:
1. evaluating transport improvements in terms of accessibility over mobility, meaning
taking into account the difference to the number of opportunities (e.g. jobs, public
services) made by a given intervention (location-based in Table 2. 2) and
2. prioritizing the increase of accessibility to those whose accessibility is low over
those whose accessibility is higher to begin with, to reflect the principle of
diminishing returns.
To my knowledge, such a mobility-focused accessibility study with equitable priorities has not
been applied before to transport projects in Egypt and will form the basis of the methods in this
26 Under location-based measures are distance-based measures. These measures simply count the
number of opportunities of a specific type that are reached within a threshold cost of time or money
(Ingram, 1971; Wachs and Kumagai, 1973; Allen et al, 1993). Wachs et al improve upon the simple
location-based distance measure by summing opportunities of a certain job type and for certain
income categories. This specification would produce a more accurate picture of the accessibility
of individuals by taking into account actual socio-demographic realities in the measure.
Unfortunately, such data is unavailable for the Greater Cairo Region and was not used. Instead,
the accessibility measure used is what Wachs called “aggregated over all income categories …and
employment classes” and results in an average picture of the opportunities provided to residents
of each place via transit.
2.3.1 More Complex Measures of Accessibility
There are even more complex measures that improve upon the distance-based measures described
above, namely the location-based potential measures, person-based, and utility-based. A brief
description of their characteristics is provided in this section.
Several location-based accessibility measures emerged in the mid 20th century that do not capture
actual travel behavior, but rather the potential thereof. Hansen (1969) proposed a seminal
gravity-based measure, analogous to the force of gravity because it is proportional to the attractive weights
in every potential location (like jobs) and inversely proportional to the cost of traversing the
distance between them. The distance term is multiplied by a factor, beta, a travel friction coefficient
that reflects the different groups’ abilities to overcome such distance. For example, older or less
27 Moreover, the decay of the attractiveness is exponential with distance as this follows more closely
the observed travel behavior in humans (Handy and Niemeier, 1997). A major limitation of the
Hansen model is its focus on the ‘supply side’ without regard to the demand or the number of
people that these opportunities aim to serve. To overcome this, some studies introduce factors that
account for the competition between employees for jobs and employers for workers (Wilson,
1970). Shen (1997) shows that this is equivalent to weighting the accessibility of each place by its
population when aggregating the accessibility of a region. Although these accessibility measures
have been around for at least three decades in their current form, they have not yet been widely
operationalized in developing world cities like Cairo.
Person-based measures account for the variability in the constraints on the individual. Such an
approach may be useful for social evaluations of land-use (Geurs and Van Wee, 2003) but require
a highly disaggregate level of data on socio-economic characteristics of the population.
Utility-based measures are modelled after similar approaches in the field of econometrics. A utility (or
disutility) is assigned to each mode of travel and the choice of mode is computed using multinomial
logit (Ben-Akiva and Lerman, 1979). The interpretation of the utility-based measures is less
applicable to this study which compared different applications of the same mode.
For the current study with the aim of recommending key bus routes for the implementation of new
public transit in the GCR, the ideal accessibility measure would be location-based. Theoretically,
a potential measure like the gravity-based measure can be used with an assumption of the cost of
time for the local population. However, since this study will eventually be part of a study that
28 different parts of the world was essential. The more straight-forward distance measure with a
cut-off cost of one hour is widely used in World Bank reports. This is due to its ease of calculation and
its lack of need for assumptions for the function of cost needed for the gravity-based measure.
Moreover, its results are easily interpreted as they are a simple count of the number of jobs. For
this reason, it was decided upon as the method used to measure the different effects of the key bus
routes on accessibility to opportunities, especially job opportunities.
2.3.2 Software and Implementation Methods
The methods intended to be used in the study, namely the quantification of the improvement of
job access to the residents of the GCR as a direct result of the implementation of new transit
projects, are already implemented in commercial software. One such software that was considered
for use is Conveyal analyst. Established in 2013, Conveyal offers a web-based tool for getting
insights using accessibility measures from changes to the transit network. For a number of reasons,
it was decided to perform the analysis using original code written for this study and run locally.
Automating the process of computing accessibility indicators was not possible on Conveyal given
the desired hexagonal units of analysis. Moreover, control of the output shapefiles and regional
weighted averages was also not possible to the level of detail required. Although Conveyal offers
more robust techniques which ran the analysis for a very large variety of times of day, effectively
making the results time-agnostic, it was ultimately decided to use original script to run the analysis.
This ensured that the decisions on all of the parameters and the granularity of the outputs, which
29
3 Data Collection
As is common in many developing countries, official data on population and jobs is hard to find
and access. In Egypt, the official government agency in charge of collecting census data, the
Central Agency for Public Mobilization and Statistics (CAPMAS), collects information on a
variety of statistics that represent the nation of Egypt. These data include agriculture, health,
income, expenditure, consumption, marriage and divorce, road fatalities, and for our purposes,
population and total job counts. To conduct the job accessibility analysis, a dataset was produced
as a proxy for job density since no official job density information was accessible.
The job accessibility model used combines several disparate sources of data to represent the
availability of job opportunities to citizen by their location of origin. To compute such a
calculation, the following data sets were needed: • Job locations as destinations for mobility
• Public transport network and street network as enabling mobility • Population data as relative weights
3.1 Opportunities data
In traditional transportation analyses, travel demand is usually used to quantify the numbers of
30 large samples of citizens are asked to fill out transportation surveys. Other more modern techniques
utilize passively collected location data such as Call Detail Records (CDR) or Location Based
Services (LBS) on smartphone apps to identify home and work locations and model a city-wide
travel demand pattern (Gonzalez, 2008). Since CDR and LBS data are not publicly available for
the Greater Cairo Region (GCR), accessibility is measured without travel demand information as
the sum of opportunities within reach of a destination.
a proxy for demand is the number of opportunities within reach since commute to work trips
constitute the most common trip purpose (ITDP 2019). The opportunities dataset will be a
geospatial dataset of locations of business with approximate count of employment opportunities
as an attribute.
3.1.1 Web Scraping and Category Selection
A few major web-based directory services were scraped in January of 2019 to identify the types
and locations of businesses in the GCR. These included the YellowPages, Google, and two other
sources specific to Egypt. One is Shamseya, a local social enterprise that works with hospitals and
maintains an accurate dataset of hospital locations. The other is the locations of point of sale
machines for a local bill payment service named Fawry which is located in all of the city’s cigarette
kiosks and many supermarkets – this helped us identify smaller business that might not be included
in Google.
For the scraping of the online directory website YellowPages, a search term that defined the
31 greatest trip generators were identified using the Traffic Engineering Handbook (Kraft, 2009) and
shown Table 3. 1.As the goal for the opportunities dataset is to capture employment opportunities
and not points of interest, establishments with high numbers of branches (as indicated by
YellowPages or Google) and high numbers of employees (as indicated by NAICS averages) were
prioritized over ones with high numbers of patrons.
A similar procedure was followed with the Google Places API, with some differences in what was
supplied to the API. Whereas YellowPages gave an exhaustive list of locations with attributes,
which could then be disaggregated by governorate and category, Google needed a location around
which it would return points of interest. So the study area was covered with a grid of points 1 km
apart and these points were used to request business locations around it. The data from
YellowPages represented a much larger portion of the final data set than that from Google. The
maximum businesses returned by the API for each location point is set by Google to be 20, ranked
by proximity to our grid point. The categories used to collect the business locations are shown
along with the source website in Table 3. 1.
Table 3. 1 Categories used to scrape online sources for business locations in the GCR in January 2019
Category Source Category Source
Factory YellowPages Hotels & Resorts YellowPages
Ministries & Government
Organizations YellowPages Zoos YellowPages
Hospitals Shamseya Clubs YellowPages
Office YellowPages Retail YellowPages
Banks Google Maps Malls (Shopping) YellowPages
Supermarkets YellowPages Restaurants YellowPages
32
Clinic YellowPages Universities, Colleges &
Institutes YellowPages
Call Center YellowPages Schools - International YellowPages
Police Google Maps School - Governmental YellowPages
Schools - Languages YellowPages
3.1.2 Data Cleaning
Since the locations of businesses were acquired from separate sources and, in the case of Google,
from distinct location point origins, there were some duplicates in the results. This is the case when
there are less than 20 business results around a single grid location, so the results from neighboring
grid locations returned duplicates of the same businesses. First, the duplicates within the Google
results were identified by using a buffer around each point and computing the name similarity
between it and its neighbors. If a similarity in names was found to be greater than 50 %, the
supplicate was removed. However, words in the business names that described the category (like
bank, hospital, and school) as well as filler words and articles (like the, of and and) were also not
considered in the similarity.
In the case where a business was found from more than one source, the higher quality instance was
kept and the other removed. This was done by visual inspection of the attributes.
Using the total number of jobs published by CAPMAS for the three governorates that make up the
GCR and the relative proportions of industries from the Labor Force Survey (LFS) from the
Economic Research Forum, the spatial distribution of jobs is estimated by distributing the job
33 locations and business categories are scraped from publicly available online sources as described
in the previous section.
3.2 Public transport Route data
3.2.1 Existing Transport Data
Job accessibility analysis requires public transport supply figures. A routing algorithm was used
to identify the areas that are within one hour’s commute from each origin (representing home
locations) around the city, up to date and accurate information about the modes, their stops, and
their frequencies is necessary for the routing algorithm to produce reach polygons. Fortunately,
data on the existing transport systems of the New Urban Communities (NUCs), both formal and
informal, were collected in a project by Transport for Cairo (TfC) in the winter of 2017-18 (TfC,
2018).
Since there is a wide variety of transport services in the GCR, ranging from the very formal and
highly regulated Cairo Metro to the highly informal and very demand responsive tomnayas, an 8
seater Suzuki vehicle that offers express services from origin to destination once filled with
passengers. A couple of new tech companies have also risen to fill a gap in higher end collective
transport needs such as SWVL and Buseet. These services, along with their counterpart bus services
from the major Transport Networking Companies (TNC) UBER Bus and Careem Bus, were
excluded from the accessibility analysis as they do not offer comparable services to the much more
frequent and cheaper formal and informal services. They also only operate during rush hours. For
these reasons, they were deemed not to add much to the existing widely-used network of metro,
34 The route data collected by TfC on formal and informal busses was published in GIS and GTFS
format. It includes several distinct operators such as the formal government owned Cairo Transport
Authority, the Cairo Metro, and Mwasalat Misr, as well as private formal concession buses and
informal paratransit Box (a mini truck with seats in the back) and microbuses. The details of the
routes are located in Table 3. 2. Operational data such as frequencies were acquired for the formal
operators, the CTA and Cairo Metro from published reports (CUTID 2016).
Table 3. 2 Details of the Agencies and types of Buses mapped by Transport for Cairo
Service Scope
Number of Trips
Network
Length (km) Operational Data
Box Paratransit
all intra-city services originating and ending
within six NUCs 21 115 Partially Available
Paratransit 14 seater microbuses
all intra-city services originating and ending
within six NUCs 146 3757 Partially Available
CTA buses
all intra-city services originating and ending
within six NUCs 53 2061 Partially Available
Minibuses licensed by CTA
all intra-city services originating and ending
within six NUCs 29 1008 Partially Available
Cooperative paratransit 29 seater
all intra-city services originating and ending
within six NUCs 13 392 Partially Available
Paratransit 8 seater Suzuki Chevrolet or DMF
all intra-city services originating and ending
within six NUCs 104 738 Partially Available
Mwasalat Misr Buses Entire Network Available
35 3.2.2 Frequency Data Collection
To complement the data previously collected on route locations, frequency or headway data was
needed to produce a more accurate model of the city’ transportation network. Funding for the data
collection was provided by the World Bank as part of the multimodal study for key bus route and
park and ride facility location recommendations. Since resources of time and money were
constrained, not all available routes were included in the frequency data collection process. Rather,
157 out of about 365 trips were identified to intersect within 200 meters of the corridors of interest
to the study and whose intersection length was greater than the mean.
The final list of trips from which relevant frequency data was collected included 15-seater
Paratransit microbuses (P_O_14) as well as CTA large buses (CTA), CTA licensed minibuses
(CTA_M), 29-seater cooperative buses (COOP) as well as s small proportion of 8-seater
paratransit tomnayas (P_B_8). The data collectors stood at selected terminals and stations for 45
minute intervals on different days of the week as well as Saturdays. Since the job accessibility
analysis is computed for the morning rush hours, frequency is needed for the 6 to 10 AM morning
period. If a trip was observed during that interval, its headway was used directly. Otherwise, for
trips without a morning collection period, evening rush hour was taken instead. However, for trips
without morning or evening rush hour, average headway on the other times it was observed was
taken. Finally, if it was not selected for data collection, a trip’s headway was set as the average
36 3.2.3 Future Transport Data
Since the analysis aims to recommend public transport interventions that may be implemented in
the medium range future of about 3 to 5 years, other projects that are slated for completion within
that timeframe are included so as not to produce redundant recommendations. For the decision on
which projects to include, a number of sources were consulted. First, the projects included in a
public presentation by the previous Minister of Transport, Dr. Hesham Mahdi were included if
they were set to be completed within 3 to 5 years (Egyptian Ministry of Transport, 2018). Then,
publicly available documents from the National Authority for Tunnels outlined the medium term
plans for the expansion of the Cairo Metro. Finally, experts from the World Bank familiar with the
ongoing transport situation in Egypt advised on which projects would be concluded in the 3 to 5
year horizon and which were expected in 15 years or so. Other projects which are only stated in
studies and recommendations but have no guaranteed funding were excluded from the analysis.
The future projects are shown on the Map of the GCR in Figure 3. 1.
The base scenario with no interventions is set to 2022. So the projects that are under construction
with a completion date around that time were included in the base scenario. These are: • The 3rd and 4th phases of the Cairo Metro Line 3 as well as the first phase of Line 4
o Line 3 phases include an extension on the western side to Rod El-Farag in Giza and
on the Easter side to the Cairo Airport.
o Line 4 Phase 1 will run from Hadayek El-Ashgar in Giza to El-Malek El-Saleh
station in Cairo
• The ‘Electric Train’, a light rail system linking the New Administrative Capital in the Far Eastern desert to NUC’s near it and eventually to the periphery of the GCR
37 • New Bus routes by Mwasalat Misr termed ‘BRT Lite’ that will link the western NUCs to
inner city Cairo.
The stops for these future transport projects were acquired from secondary sources such as
presentations given by officials from the Egyptian Ministry of transportation and the National
Authority for Tunnels. However, frequency data does not yet exist. Therefore, Line 3 and 4
frequencies were taken from existing Metro frequencies. For the Electric train, speed and headway
38
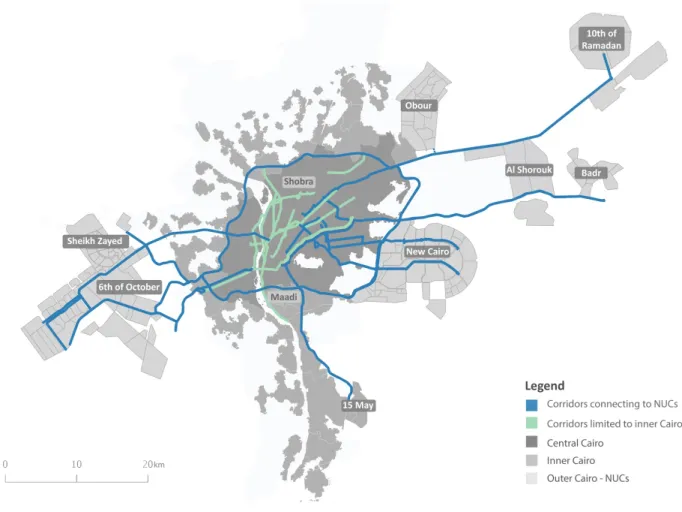
Figure 3. 1 Future Transport Projects and NUC locations in the GCR. Source: Transport for Cairo
There are a couple of other more ambitious projects that are being planned for implementation on
a time horizon farther than the scope of this study. 2 monorail linkages, one to link each of the
Eastern and Western NUCs to the center of Cairo, are still in the stage of bidding as of early 2019
(Egypt Today, 2019a). The other project is a high speed rail that connects Ain Sokhna city (130
km East of Cairo) with El-Alamein city (270 km North West of Cairo) via the new administrative
capital and Cairo proper (Ali, 2019b). These projects are expected to be fully realized in 10 or 15
years and will not be considered in future base line scenario in the accessibility model.
3.3 Corridor Selection for Potential Public Transport Intervention
In order to recommend 3 key bus corridors for the implementation of a public transport
intervention, we must start from a pool of possible alternatives. To ensure a realistic
recommendation that does not require the creation of new rights-of-way or the acquisition of
private or undeveloped land, the selection was made from existing main road arteries that were
included in previous studies on transportation in Cairo. The studies that supplied the list of
corridors considered were the WB Traffic Study (2014) and CUTID Study (2016). The corridors
were modified to start and end at existing public transport terminals. Since the data collected on
public transport were comprehensive for the NUCs and the final recommendations are focused on
linking the NUCs to inner Cairo, the corridors selected were those that originated and ended
39
3.4 Population Data
Population numbers were acquired for 2018 from the census of the Central Agency for Public
Mobilization and Statistics (CAPMAS), the official agency that conducts statistical and population
studies in Egypt. It was manually digitized from pdf to our geospatial database. The lowest
granularity we found was at the shiyakha level, which translates to the jurisdictional area of the
Sheikh, or an old man. In modern Egypt these area units vary in size with a median area of 5 square
km for all of Egypt, and 2 square km in the GCR, which had about 640 shiyakhas. These population
numbers were evenly distributed into smaller units of size which will be used in our analysis.
Before applying the 2018 adjustments, a few issues in the data were resolved. Some shiyakhas in
the census dataset had zero population in inner and central zones of Giza, Qalyubia and Cairo
which was confirmed to be a mistake after a quick satellite image check. A simple method of filling
in these areas was used.
First, the shiyakha’s population from the previous census report, released in 2015 was used after
it was increased by an annual rate equal to the growth rate of Cairo from CAPMAS figures between
2015 and 2018. If the population in 2015 was also zero, like in 6th of October Industrial districts
and Smart Village, it remained so. The natural increase used was 1.6% annually as calculated from
comparing 2015 to 2018 populations of Cairo on the CAPMAS website. If there was still a
population less than ten persons, the median density by zone (inner, central, and outer) per area
40 people between nine locations in the GCR dataset. The final GCR population in our dataset was
20.3 million people, in agreement with official reports (CAPMAS, 2017).
41
4 Methodology
The method used for the accessibility analysis is a constraint-based approach computed as the
percent of the total city jobs reachable from a place within a constraint, chosen to be a threshold
travel time of one hour. This method is widely used by international development agencies like
the World Bank as it is easily computed with limited data about job supply and transportation
network. It is also easily understood and communicated to a variety of stakeholders. Finally, since
it has been used consistently by the World Bank in different areas where they operate, it is easily
comparable between different parts of the globe.
In this chapter, we focus on the specific methodology used to transform our data and apply the
model for comparing accessibility across the different potential public transport interventions
(PPTIs). Similar to the previous chapter, we will go through the key data sets needed for the model
and finally, the details of running the model itself. The model uses the following equation to
compute an accessibility metric for each unit study area,
!""#$$%&%'%()* =,-.//01(23%(%#$- ∗ 5- ,-.//01(23%(%#$
-Where W is a binary variable of 1 if j is within 1 hour from i by public transport and 0 otherwise
and divided by the sum of the opportunities in the Greater Cairo Region (GCR). This will create
an accessibility score that is a percentage of the entire GCR jobs accessible to each area within one
42 To compute regional accessibility for each NUC as well as the entire metropolitan region, the
Accessibility will be weighted by the population that resides in the area unit of analysis and the
mean will be taken over that region as follows,
7#8%039' !""#$$%&%'%() :3;%"9(01 =,*!""#$$%&%'%()* ∗ <0/2'9(%03* ,*<0/2'9(%03*
4.1.1 Limitations of the Accessibility method chosen
The accessibility measure described above has some limitations. First, it only considers two of the
components of accessibility, namely transport and land use. It does not take into account the times
at which the public transport is functioning nor the times at which the destination opportunities are
available. Since our analysis prioritizes the weekday work commuter, we assume the availability
throughout the system at normal Cairo working hours for both the transport system as well as the
opportunities. Another limitation of the model is that it uses a threshold of 60 minutes travel time
which excludes commuters who are willing to travel more or less. The individual component of
accessibility, one which describes the commuter’s ability to part-take in the opportunities, is
missing. Theoretically, this component would account for the willingness or ability of an
individual to partake in a specific opportunity; medicine related employment opportunities are only
relevant to people working in the field of medicine, not the entire population. To take this into
account in the analysis, we would require data on socio economic, educational, social, religious,
and other personal preferences of all residents. This would limit the actual number of opportunities
perceived to be available to an individual so that it matches more closely with reality. This would
require a level of data granularity not yet reached in many places in the world. We overcome this
43 of containing citizens that may respond to all the available employment opportunities. In other
words, the doctors/engineers/actors are not all segregated in one area but live throughout the city
in equal probability.
4.2 H3 hexagons as unit of analysis
For the analysis to be replicated evenly across the entire study region, it was necessary to split the
region into even sized modular units. This simplifies the analysis and the visualization of results
since the area is normalized and all its attributes like job count and population can be directly
compared. For the sake of reproducibility and consistency, Uber’s H3 Hexagonal system was
chosen and used for the entire GCR at a resolution of 8 in their scaling system (Brodsky, 2018).
4.2.1 Boundaries of the Greater Cairo Region Study Area
Since the study spans several administrative regions, a few decisions were made regarding the
extent of each administrative boundary that would be included in the analysis. To delineate the
boundaries of the study area a few simple rules were followed, visualized in Figure 4. 1:
1. First, Central Cairo, Giza, and Qalubiya were defined as the urban agglomeration
within the ring road.
2. Second, Inner Cairo, Giza, and Qalubiya were taken as the urban settlements, as
defined by the Atlas of Urban Expansion (Angel S., 2016)
3. Finally, the entire administrative boundaries New Urban Communities were taken
44
Figure 4. 1 Areas included in the study within the GCR and their delineations as Central, Inner, or Outer
About of 10% of Qalubiya governorate which falls within or is contiguous to the ring road was
also included in the Central parts of the GCR. The drawback with using the Atlas of Urban
expansion is its age; It is based on satellite images taken in 2013 yet it represents a very robust
method of accounting for where the citizens actually reside in a city with such high informal
housing. Finally, since the main goal of the study is to establish the benefit to NUCs achieved
through new public transport, their entire administrative boundaries were included to measure the
changes in access to yet unbuilt parts of the periphery. NUC administrative boundaries as well as
45 For the H3 unit of analysis, the data sets such as population and job locations were counted as
points in the hexagon polygons and the counts were saved as attributes of the hexagons in the
geospatial information system shape file. Job data were acquired by careful manipulation of the
scraped business locations to account for the officially published job counts in the GCR.
4.3 The Opportunities (Spatial employment) Model
A proxy for the opportunities needed in the accessibility model was derived, named the spatial
employment model, using the locations of businesses and several official sources for the counts of
jobs in each type of business. Since it is in essence a data-derived spatial distribution of the reported
total of jobs, it is termed a spatial employment model. In order to guarantee that we do not over or
underestimate the actual number of opportunities in the GCR, we started with the employment
totals published officially by CAPMAS coupled with the Labor Force Survey of 2015 acquired
from the Economic Research Forum, a research network in Cairo.
The following method was applied:
1. Categorized every point in our scraped Opportunities data set according to the industries
listed in the LFS - with some points like Fawry, not yet categorized
2. Summed the total of points found in each category and each governorate and divided the
governorate total employment numbers by these counts. This resulted in the average job