HAL Id: hal-00921263
https://hal.archives-ouvertes.fr/hal-00921263
Submitted on 20 Dec 2013
HAL is a multi-disciplinary open access
archive for the deposit and dissemination of
sci-entific research documents, whether they are
pub-lished or not. The documents may come from
teaching and research institutions in France or
abroad, or from public or private research centers.
L’archive ouverte pluridisciplinaire HAL, est
destinée au dépôt et à la diffusion de documents
scientifiques de niveau recherche, publiés ou non,
émanant des établissements d’enseignement et de
recherche français ou étrangers, des laboratoires
publics ou privés.
The effect of conducting boundaries on Lapwood-Prats
convection
D. Andrew Rees, Abdelkader Mojtabi
To cite this version:
D. Andrew Rees, Abdelkader Mojtabi. The effect of conducting boundaries on Lapwood-Prats
con-vection. International Journal of Heat and Mass Transfer, Elsevier, 2013, vol. 65, pp. 765-778.
�10.1016/j.ijheatmasstransfer.2013.05.071�. �hal-00921263�
O
pen
A
rchive
T
OULOUSE
A
rchive
O
uverte (
OATAO
)
OATAO is an open access repository that collects the work of Toulouse researchers and
makes it freely available over the web where possible.
This is an author-deposited version published in :
http://oatao.univ-toulouse.fr/
Eprints ID : 10557
To link to this article : DOI:10.1016/j.ijheatmasstransfer.2013.05.071
URL :
http://dx.doi.org/10.1016/j.ijheatmasstransfer.2013.05.071
To cite this version : Rees, D. Andrew and Mojtabi, Abdelkader The effect of
conducting boundaries on Lapwood-Prats convection. (2013) International
Journal of Heat and Mass Transfer, vol. 65. pp. 765-778.
Any correspondance concerning this service should be sent to the repository
administrator:
[email protected]
The effect of conducting boundaries on Lapwood-Prats convection
D.
Andrew S. Rees
a.*,
A.
Mojtabi
ba Department of Mechanical Engineering, University of Bath, Bath BA2 7AY, UK
b Université de Toulouse, INPT, UPS, IMFf (Institut de Mécanique des Fluides de Toulouse), Allé Camille Soula, F-31400 Toulouse, France
Article history:
Received 29 December 2012 Accepted 31 May 2013 Available online 22 july 2013
Keywords:
Porous medium Horizontal throughflow Conducting boundaries Unear theory
We investigate the onset of convection in a uniform, constant-thickness, horizontal porous layer which is heated from below. The layer is bounded above and below by thermally conducting but impermeable lay-ers. Our aim is to determine the effect on the onset of convection of the interaction between the presence ofthese outer conducting layers and a horizontal background flow. A linear stability analysis is performed and a dispersion relation is derived from which the stability characteristics of the layer are computed. Convection ce lis are found move along the layer at a speed which is lower than that of the imposed flow due to a thermal drag caused by the presence of the bounding solid layers. Neutra! curves and streamline/ isotherm patterns are presented in order to understand the physical rote played by the governing nondi-mensional parameters. Wh en the diffusivity of the solid layers is much lower than the diffusivity of the porous layer there exists a regime where the neutra! curve can exhibit two minima, and at one point in parameter space there exists a neutra! curve with a quartic minimum.
1. Introduction
Convection in a horizontal porous layer heated from below continues to be a source of research attention. Whilst there is undoubtedly a widespread range of practical topics for which heat and mass transfer in porous layers provide a good mode!, convec-tive flows nevertheless are source of fun dam entai interest from the points of view of phenomenology (such as pattern selection) and the application of the la test analytical and numerical methods.
Horton and Rogers [1] and Lapwood [2] were the first to study the onset of convection for what may be termed the classical Darcy- Bénard problem, namely that of a uniform, isotropie hori-zontal porous layer which is saturated by a Newtonian fluid, and which is subject to a uniformly hot lower bounding surface and a uniformly cold upper surface. Convection arises in an infinitely long layer wh en the Darcy-Rayleigh number exceeds 41!:2. The first mode to appear has the wavenumber, n, which corresponds to convection rolls with a square cross-section. Weakly nonlinear theory, which applies when the flow is just supercritical, shows that two-dimen-sional rolls form the stable planform for convection, as opposed to hexagonal cells, square or rectangular cells, or more exotic shapes -see Rees and Riley [3,4] and Rees [5]. When the bounding surfaces are heated by means of a constant heat flux, then the critical Darcy-Rayleigh number is reduced to 12 and the critical wavenumber is zero (Nield [6]). Recent weakly nonlinear studies by Rees and Mojt-abi [7] suggest that the the postcritical stable planform of this
*
Corresponding author. Tel.: +44 1225 386775.E-mail address: [email protected] (D. Andrew S. Rees).
constant-heat-flux form of the Darcy-Bénard problem is three dimensional. More detail may be found in the chapters by Rees [8], Tyvand [9], Rees et al. [10] and Nguyen-Quang et al. [11], and the books by Pop and Ingham [12] and Nield and Bejan [13].
In the present paper we will study one particular type of layered system. Layering arises naturally in the real world and an early paper by Rana et al. [14] was aimed at describing convection in the Pahoa reservoir in Hawaii, a system which was modelled using three porous sublayers. This numerical study displayed how the familar two dimensional convection patterns for the single-layer problem are modified substantially when layering is present. A more comprehensive approach was undertaken by McKibbin and D'Sullivan [15], who determined the conditions for the onset of convection in both two- and three-sublayer configurations. The ex-tra degree of freedom which arises wh en a porous layer consists of as few as two sublayers means that the neutra! curve can exhibit more unusual shapes than the standard one where one minimum is present. There is a regime in parameter space where two minima are possible; typically one of these corresponds to a local convec-tion pattern (i.e. mainly confined to the sublayer with the higher permeability- the higher wavenumber case) orto a global pattern (the lower wavenumber). Rees and Riley [16] also presented a three-layer case where modes with three different wavenumbers become unstable at the same Darcy-Rayleigh number.
Of more specifie interest to us here are the three-layer configu-rations where the outer layers are impermeable heat-conducting solids. If the outer layers are relatively thin, then such a configura-tion may be used to mode! experimental studies where a saturated porous medium must be bounded by sorne impermeable barrier;
Nomenclature A,B,C,D,E constants c phase velocity d conductivity ratio g gravity k disturbance wavenumber k thermal conductivity K permeability p pressure Pe Péclet number Ra Darcy-Rayleigh number t time u horizontal velocity w vertical velocity x horizontal coordinate z vertical coordinate Greek symbols a diffusivity ratio
p
thermal expansion coefficientsee Rees and Mojtabi [7] and Mojtabi and Rees [17]. An early paper by Riahi [18] considered infinitely thick solid sublayers and he used weakly nonlinear theory to show that the convection plan-form may, when the conductivity of the solid layers is small, take the form of three-dimensional cells with a square planform. His analysis was extended to solid layers of finite thickness by Rees and Mojtabi [7].
A different, but practically important, modification of the classi-cal Darcy-Bénard problem was undertaken by Prats [19] who con-sidered the effect of a horizontal pressure gradient. When Darcy's law applies, this pressure gradient induces a uniform fluid velocity along the layer, unlike the parabolic velocity profile which arises in plane-Poiseuille flow. Prats showed that the convection cells found by Horton and Rogers ]1] and Lapwood [2] move along the layer with exactly the velocity of the background flow. A simple coordi-nate transformation to a frame of reference which moves with the background flow removes the background velocity from the governing equations, even when under strongly supercritical con-ditions. Thus the vertical heat transfer and ali the nonlinear dynamics are unaffected by this forced convection component.
The aim of the present work, then, is to determine how the presence of conducting boundaries affects the simple result of Prats [19], namely, that the phase velocity of the convection cells is precisely the same as the velocity of the background flow. It is a simple piece of a priori reasoning that the presence of stationary bounding surfaces will impose a thermal drag on the cells, and therefore the velocity of the cells should lie between zero and that of the background flow. But the present paper also addresses the question of whether this three-layer system displays any unusual behaviour over and above having a simple minimum in the neutra! curve.
The linear stability analysis which we present is facilitated by the derivation of a dispersion relation which takes the form of a complex 4 x 4 determinant. Setting the real and imaginary parts to zero simultaneously yields both the critical Darcy-Rayleigh number and the phase velocity of the cells. We present neutra! curves and the variation of the critical values of the Darcy-Ray-leigh number, wavenumber and phase velocity as a function of the diffusivity ratio, conductivity ratio, thickness ratio and the Péclet number. The behaviour of these curves is explained by means of a selection of streamlinefisotherm plots. We find that the classical unimodal neutra! curve does indeed occasionally take
y constant
r
exponentc5 thickness ratio
(} fluid temperature
e
disturbance fluid temperatureK thermal diffusivity
Â.,O" exponential growth rate
J1. dynamic viscosity
p density
l/1
streamfunction'P disturbance streamfunction
Subscripts and superscripts
1,2,3 sublayer
c
critical value ref reference valuederivative with respect to
z
11 dimensional
a more exotic form, and this corresponds to when the diffusivity of the solid layers is substantially less than that of the porous layer.
2. Goveming equations
We investigate the effect of conducting boundaries on what we shall cali the Lapwood-Prats problem, namely the Darcy-Bénard problem modified by the presence of a horizontal forced convec-tive pressure gradient. The detailed configuration we consider is shown in Fig. 1 and it is comprised of a uniform isotropie saturated porous layer of thickness, h2, which is bounded by two uniform,
impermeable but thermally conducting plates with thicknesses,
h1 and h3 • These plates do not necessarily have identical
conductiv-ities or thicknesses and the derivation of our stability analysis will maintain this, but we will present detailed results only for those cases where the solid layers are identical in every respect. This three-sublayer composite system is taken to be of infinite extent in both horizontal directions.
The origin of the coordinate system is located at the bottom of the composite layer, while
x
andz
are the horizontal vertical coor-dinates, respectively. Constant but different temperatures are imposed at the external surfaces of the composite layer, i.e. atz
= 0 and atz
= h1+
h2+
h3 , where the lower surface is hotterthan the upper surface. The somewhat unusual formula given in Fig. 1 for the temperature of the upper surface means that the overall temperature difference across the porous layer is AT. The Darcy-Rayleigh number will be defined using this value, this al-lows our results to be compared easily with single-layer systems, or systems where the solid layers are exceptionally thick.
For convenience the sublayers are numbered, 1, 2 and 3, begin-ning with the lowest sublayer. We will assume that the ensuing convection is restricted to being two-dimensional and therefore the full governing equations for the porous layer are,
(1)
(2)
T=To
Fig. 1. Definition sketch of the configuration being studied. The porous layer is sandwiched between two impermeable but thermally conducting layers. The value, AT, is the temperature drop across the porous layer.
where ali quantities are given in the Nomenclature. The respective equations for conductive heat transfer in the solid sublayers are,
8Tt
(8
2TtセtエI@
(pc)t
at
= kt 8X2 + az2and
The boundary and interface conditions are,
Z
=
0: Tt=
Trer, aTt aT2z.
=
ht :w
=
o,
Tt=
h
ktaz.
=
k2az ,
(4) (5) aT2 aT3 (6)z
=
ht + h2:w
=
o,
T2=
T3, k2 az.=
k3 az. , k2 (ht h2 h3)z
= ht + h2 + h3 : T3 = -h 2 A.T kt+ k2 + k3 + Tref·The imposed horizontal pressure gradient is of such a magnitude that it induces the velocity field, (u,v) = (U,O).
The following scalings may be introduced in order to render nondimensional the goveming equations:
A h A-h h A t -
ィセHーcィ@
t
X = 2X, Z - t + 2Z, - -k-2- , ( A A A ) k2 ( )u, v,
w = h2(pC)fu, v,
w, (7)which are based on the height and the properties of the porous layer.
We thereby obtain the nondimensional equations:
(8) (9) (10) (11)
and
The diffusivity ratios, OCt and oc3 , are defined according to,
kt (pCh k3(pCh
OCt = k2(pC)t' ct3 = k2(PClJ.
The Darcy-Rayleigh number is defined to be, Ra= p2(pC)1gph2KtlT
J1.k2
(12)
(13)
(14)
and it is based upon the height of the porous layer and the temper-ature difference across it. The two conductivity and thickness ratios as follows,
dt
=
kt/k2, d3=
k3/k2, Ot=
htfh2, 03=
h3/h2. (15) The background velocity is now (u,w) = (O,Pe), where the Péclet number is given by,h2U
Pe = k2(pC)f. (16)
For two-dimensional flow we may define the streamfunction,
l/J,
using,81/1
81/1
U = - - and W =
-az ax (17)
and the full goveming equations become
セBG@
セBG@
8()8x2
+
8z2 =Ra ax' (18)8()2
81/1
8()2 81/J 8()2 セ@ ()2 セ@ ()2Tt+
ax az - az ax = 8x2+
8z2 , (19)in the porous layer, and
(20)
in the bounding sublayers. The boundary and interface conditions are
Ra
100 80 606
=
PNLセLセLO@
4 0 / ' 2 0 10k
Ra
k
QRPLM セ MMセMMMMセMMMMMMLMMMMMセMMMMMMRa
100 80 60 4 0 2 0 P ッᄋl⦅MMMMセMMMMセMMMMセセMMMMセMMMMセQッ@k
c
c
c
6
=
0.01
1. 0 Q]セZZZZZZZ ZZZZZZZZZZ[ZZZZZ[セ セ]セセMMMMMェ@6
=
10 0.8 0. 6 1; li 0. 4 0. 2d= 0.2
PNPPセMMMMセMMMMセMMMMMMセMMMMセMMMMセQP@k
d=l
PNPPセMMMMセMMMMセMMMMMMセMMMMセMMMMセQP@k
k
Fig. 2. Neutra! cmves (left) and the corresponding values of the wavespeed, c, (right) for ex= 1 and Pe = 1 for the stated values of d. The following values of èJ were used:
{J = 10,3,1,0.3,0.1,0.03 and 0.01. The dotted line corresponds to {J = 10 and the dashed line to {J = 0.01.
3. Unear stability equations
Z=O:
t/1=0,
We perturb about the basic state by setting,(21)
--
...
---
..
-
...
...
... ...-
--, , ,' ---k=0.5 k=l 1 , ,' , 1...
-
..--
...
--
-
---... ---.....
..
..-
......
-...-
...---
---
---
---
... ...
, , ... ... , ...-
...,
... " 1..
-
... ... " ... ' , ' ' , , , ... 1 , , , 1...
-... ----...
-
... -, , , , ... ...--
-
....
-
.---
-..
... ... _,. , 1 ' k=2Fig. 3. Streamlines ( continuous Ii nes) and isotherms (da shed Ii nes) for d = lJ = ac = Pe = 1. Showing the effect of having different wavenumbers.
d=5 ---. d= 0.2
1111:
ᄋᄋセセセセᄋᄋNᄋᄋセセセZセセセ・ウ」[@
.
^ᄋセᄋ@
...•.•...•. · •.ᄋᄋᄋセ@
.•.••. . . d=l. ·.·
.... /.' \ < .
\, __ セMMM NM⦅M⦅MM···.···
••.••••••....
/.' '
. . .
0=3 0 = 0.1
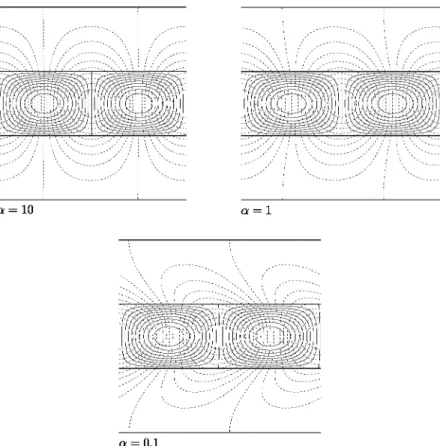
Fig. 5. Streamlines (continuous !ines) and isotherms (dashed !ines) for œ = Pe = 1 and d = 5. The wavenumber is k = 1. Showing the effect of having different values of b.
12 0
8
=
0.01
Ra
c 1.0r
8
=
10 100 0.8 80 0. 6 60 0. 4 4 0 2 08
=
10
0. 2 Q;=
10
00 10 0.00 10k
k
12 0Ra
c 1.0 100 0.8 80 0. 6 60 0. 4 4 0 2 0 0. 2 Q;=
0.1
00 10 10k
k
Fig. 6. Neutra! curves (left) and the corresponding values of the wavespeed, c, (right) ford= 1 and Pe = 1 for the stated values of œ. The following values of{) were used:
{) = 10,3,1,0.3,0.1,0.03 and 0.01. The dotted line corresponds to {) = 10 and the dashed line to {) = 0.01.
where k is the wavenumber and c is the phase velocity of the cell pattern. The linearized stability equations now take the ordinary differentiai form,
'P" - k2'P +Ra k82 = 0, (23)
・セM (k2- ikcfcxt)E>t =
o,
(24)・セM (k2
+
ik(Pe- c))E>2+
k'P =o,
(25)・セM (k2 - ikcjcx3)83 =
o,
(26)where the boundary conditions are:
\ :
-
.·....
\··..
セ@
. : .. / . ·. \ .. __ .-....
·..
·...
·...•...
··.·.
.
. . . ....•...
--- --' ' ' ' ' ' ' ' , , __ -- , ' ' ' ' ' ' ' ' ' , -- -a= 10 a=1 \ ---,-,'',,',/
':, ' ' a= 0.1Fig. 7. Streamlines (continuous !ines) and isotherms (dashed !ines) for li= d = Pe = 1. The wavenumber is k = 2. Showing the effect of having different diffusivity ratios, IX.
4. The dispersion relation
In layer 1 the solution which satisfies the boundary condition at z= -.51 is 0t =Asinh.A.t(Z+bt), where ( .kc)t/2 .A.t=
セMャ。エ@
(28) (29)and hence 0; =A.A.t cosh.A.t (z+ bt). Ifwe now apply the z= 0 inter-face conditions which are given by (27) we find that,
82 (0) =A sinh .A.t Dt, Pセ@ (0) = A.A.t dt cosh .A.tbt. (30) Given that the constant, A, is arbitrary, these two conditions for ®2(0) and 0;(0) may be combined to remove A, which thereby
yields the following boundary condition of the third kind, (31) For la ter convenience we rewrite Eq. (31) as 02 (0) = y1
0;
(0) wheretanh.A.tbt Yt = .A.tdt
The corresponding boundary condition at z = 1 is 0 (1) = 2 tanh.A.3b3 0 , (1)
.A.3d3 2 '
or, in compact form, as 02(1) = -y30;(1) where
( kc)t/2 and .A.3 = k 2 - i a 3 . (32) (33) (34)
Therefore we are in a position to consider only the solutions within the porous layer (Eqs. (23) and (25)) where the full dynamic ther-mal of a mode with wavenumber k in the outer bounding layers is modelled completely by the complex boundary conditions, Eqs. (31) and (33).
Solutions ofEqs. (23) and (25) take the form, exp (rz), where r satisfies the determinantal equation,
l
r
2-k2 Rak 1k r 2 -
セ@
+ ik(c- Pe) =O. Hence r = ±.A., ± (J, where.A.2 =
セ@
+ ik(Pe- c)/2 + k[Ra- (Pe- c)2 /4]t12,u2
=セ@
+ ik(Pe- c)/2- k[Ra- (Pe- c)2 /4]112. Ifwe now set'l' = _Ra k [A sinh A.z + B cosh A.z + C sinh az + D cosh az]
rMセ@ セMセ@
,
th en
0 2 = A sinh A.z + B cosh A.z + C sinh az + D cosh az. Application of 'P(O) = 0 leads to
_B_+_D_=O .A.2 - セ@ a2 - k2 ,
while the condition, '1'(1) = 0, gives, A sinh .A. + B cosh .A. C sinh a + D cosh a
0 12 _ セ@
+
a2 _ セ@ = · (35) (36) (37) (38) (39) (40) (41) The application of the boundary condition, Eq. (31) at z = 0 gives,100
Ra
cjPe1.o
80 0.8 60 0.6 40 0.4 20 0.2d
=
1,
a
=
1,
6
=
1
00sk
0.00sk
100Ra
cjPe1.o
80 0.8 60 0.6 40 0.4 20 0.2d
=
1,
a
=
0.2,
6
=
1
00sk
0.00sk
100Ra
c/PeJ.o
80 0.8 60 0.6 40 0.4 20 0.2d
=
1,
a
=
1,
6
=
5
00sk
0.00sk
100Ra
c/PeJ.o
80 0.8 60 0.6 40 0.4 20 0.2d
=
5,
a
=
1,
6
=
1
00sk
0.00sk
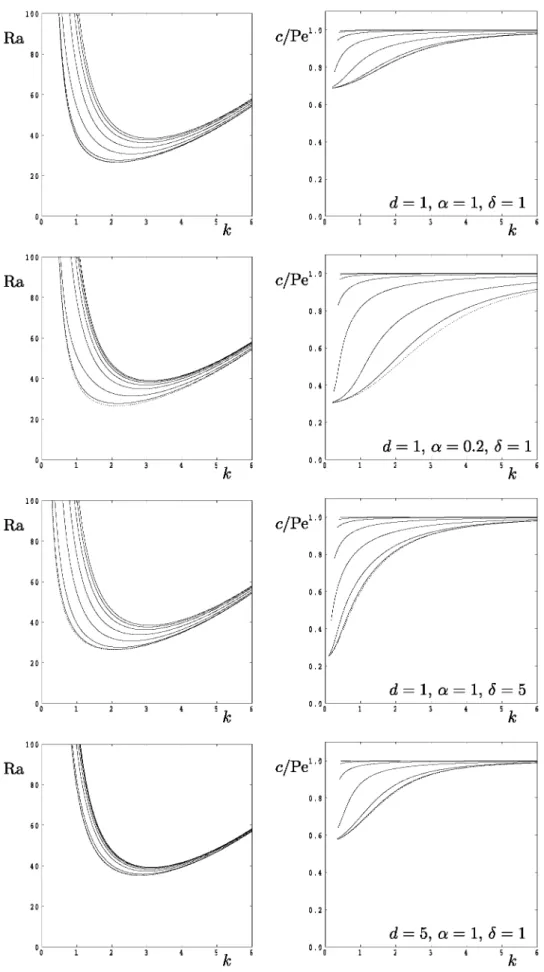
Fig. 8. Neutra! curves (left) and the corresponding values of the scaled wavespeed, cfPe, (right) d = 1 for the stated values of d,œ and /J. The following values of Pe were used: 0,1,3,10,30,100,300 and 1000. The dotted (lowest) line corresponds toPe= 0 and the dashed (upperrnost) line toPe= 1000.
, .
---Pe=O Pe = 10
• • • • • • • • • • • • • • • • • • •
••••••••••••••••••••
セᄋᄋᄋᄋ@
__ .---Pe= 1 Pe = 100
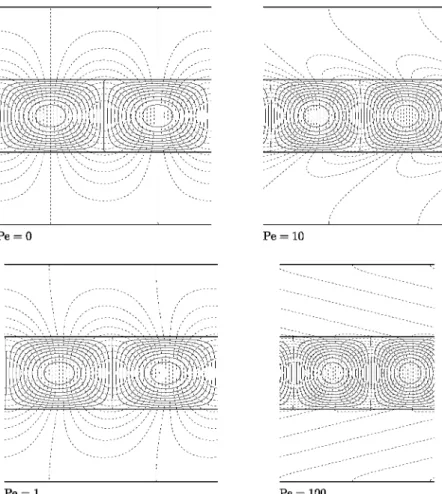
Fig. 9. Streamlines (continuous !ines) and isotherms (dashed !ines) ford=
o
=ex= 1. Showing the effect of having different values of the Péclet number. Each wavenumber corresponds to the minimum in the respective neutra! curves.while the boundary condition, Eq. (33), yields A sinh À
+
B cash À+
C sinh a+
D cash a= -y3[À(Acosh À+ Bsinh À)+ a(Ccosh a+ Dsinh a)]. (43)
These last four equations always admit zero solutions for A,B, C and
D except for when Ra and c take their appropriate eigenvalues. These are found by insisting that the following complex determi-nant is precisely zero:
0
;.>_Jl 0 11>-JC
sinh). cosh). sinh 11 cosh 11
).2 -Il ).2 -Il 112 -k2 112 -Il
=0.
-).yi 1 -11)11 1
sinh). + ).y3 cosh). cosh). + ).y3 sinh). sinh 11 + 11y3 cosh 11 cosh 11 + 11y3 sinh 11
(44)
This determinant generally takes complex values and therefore the setting of it ta zero means that two quantities are determined as eigenvalues, namely Ra and c. This was done by means of a straight-forward two-dimensional Newton-Raphson iteration scheme and the results obtained are essentially exact. Later, we present sorne rather unusally-shaped neutra! curves which arise at an extreme value of one of the governing parameters; we therefore modified our Fortran90 code from real*8 ta real*l6 in arder ta check if such unusual curves arase from the accumulation of round-off error - it was found that these real *8 results had not suffered any deg-radation in accuracy due ta round-off error.
The locations of the minima in the neutra! curves are generally found by differentiating an explicit expression for Ra with respect ta k and setting this ta zero. In the present problem Ra and c are given implicitly by the determinant given in (38). We therefore
performed a numerical differentiation of the kind described in de-tail in Rees and Genç [20] ta find such minima.
The full system described above is one with seven independent parameters (ot.
o
3 , dt. d3, œt. œ3 and Pe) when it is assumed that thevalues Ra, k and c are determined from the computation of critical values. However, we reduce the system ta four parameters by insisting that the layer is symmetric, i.e. the bounding layers are identical in every way. Therefore we set Ot =
o
3=
o,
dt = d3=
dand œt = œ3
=
œ.5. Results and discussion
The result of our computation is presented in three different forms: neutra! curves, streamline and isotherm plots and the variation of critical values. Even with four independent nondimen-sional parameters it is virtually impossible ta give comprehensive results. Therefore we will concentrate on giving a good physical understand of the raies played by the nondimensional parameters. We have chosen ta use the case,
o
= d = œ = Pe = 1, as therefer-ence case against which most of our results will be compared.
5.1. The influence of variations in d and
o
Fig. 2 keeps the values of Pe and œ fixed at 1. Neutra! curves are shawn for three values of d in separate graphs and for a range of values of
o
in each graph. In addition to the behaviour of Ra as a function of the wavenumber, k, we also show the variation of the phase speed, c, with k.The neutra! curves show the very familiar unimodal shape with a single minimum. We note that in those cases which we have computed, including those not present in this paper, the lowest
3.5 4 0 Raq5 kc 3.0 3 0 2.5 25 2.0 2 0 1.5 15 1.0 10 0.5 o_ 4 -3 -2 -1 3 4 o. o_ 4 -3 -2 -1 3 4 log lü§ log10 § 1. 0 5 1. 0 0
""
0. 9 5\
0. 9 0 0. 8 5 -3 -2 -1Fig. 10. Critical values for Ra,k and cas a function of â for cc= Pe = 1 and ford=
w-
3, w-2,1o-l,t0°,10l,1o2 and 103•value afRa always lies between 12 and 4·n?. The latter arises when the solid plates are either very thin indeed (c5
«
1), which may be seen as the dashed !ines here, or very highly conducting ( d»
1 ), while the former arises when the solid plates tend towards being insulating (d«
1). These values are well-known in the context of the onset of convection in a single layer; see Nield and Bejan [13].As the values of d and c5 vary, the general behaviour of the neu-tra! curves shawn in Fig. 2, where we concentrate specifically on the critical values of the Darcy-Rayleigh number and wavenumber ( Rac and kc, respectively), are as might be expected. For example, when d = 0.2, the values of Rac and k vary greatly as the thickness
of the bounding layers, c5, varies. Sufficiently thin bounding layers
( c5 = 0.01) of law conductivity do not alter the onset cri teri on very
much from that of the classical Darcy-Bénard problem, namely Rac = 4n? and kc = n. On the other hand, when c5 increases ta large values, the lack of conductivity in the bounding layers yield an on-set problem which is close ta that of the classical Darcy-Bénard problem with constant heat flux boundaries. Thus the critical val-ues are close to Rac = 12 and kc = 0 when d is small and c5 is large. It is also clear that the phase speed of the dis turban ces depends strongly on the wavenumber. The thermal disturbances do not penetrate far into the bounding layers when k is large, and there-fore the moving cells are unaffected by the presence of the outer layers, which is why the nondimensional phase velocity is close ta 1. Similarly, the bounding layers are essentially ineffective when they are thin. On the other hand, when there is a substantial pen-etration of the bounding layers by the thermal field, the phase
velocity is affected. This is particularly true for small wavenumbers where the thermal penetration is of the same arder as the wave-length of the cells.
Many of the above observations are displayed in Figs. 3-5. These Figures, and others la ter correspond ta a snapshot of stream-lines and isotherms at one point in time, the whole pattern then being understood ta move ta the right at the computed phase speed.
In Fig. 3 we demonstrate the changing thermal penetration as the disturbance wavenumber changes. In particular we see the penetration decreasing as k increases, and hence the disturbance phase speed increases, although here it does sa by only a small amount. The phase speed is in the region of 0.9, which corresponds ta the very small lag which may be seen in the isotherms in the bounding layers. Later we will see cases where the lag is greater, and this is brought about by small values of IX or large values of Pe. Similar variations in the thermal penetration into the bounding layers are seen in Fig. 4, but this is caused by having difference val-ues of d. When d is large, the bounding layers are relatively highly conducting which causes the layers to tend towards a uniform temperature. When d is small, there is a very substantial variation in the temperature of the bounding layers. The isotherms in the porous layer when d = 0.2 are close to being vertical at the
inter-faces with the bounding layers, which is why small-d cases mimic constant heat flux single-layer convection.
The effect of variations in c5 on the streamlines and isotherms are shawn in Fig. 5. The case with c5 = 3 is qui te typical of cases with
40 Rac35 3 0 25 20 15 10 0-L_4 MMMセSMMMセRMセMQ@ _ ⦅Q⦅MMMM」セMセMセS@ _ _j4 3 4 log10 d log10d QNPULMMセMセMセMLMMセMセMセMセ@ 0 · 8 0-L_4 MMMセS@ MM⦅セRMMMセQMMMM]GMMセMセMMMMM」SセMMMMMBT@ log10 d
Fig. 11. Critical values for Ra,k and cas a function of d for ex= Pe = 1 and for lJ = 10-4, w-3,10-2,10-l,ta-0·5,10°, 10°·5,101 and 102• The dotted line corresponds to lJ = 10-4•
substantially thicker bounding layers, and the thermal disturbance is confined naturally to a region which is just thicker than the por-ous layer. As {> decreases to values of 1 and below, there is a
decreasing amount of room for the thermal disturbance to develop within the bounding layers. The phase speed of the cells also in-creases towards 1 as a result of this.
5.2.
The influence of variations in
IXand
{>Fig. 6 shows how the neutra! curve and the corresponding phase speed of the ce lis vary for different values of IX and {> for large fixed values, d = 1 and Pe = 1. Results for IX= 10 and IX = 0.1 are
dis-played here, while the intermediate IX = 1 case may be found as the
d = 1 case in Fig. 2, for comparison. There is little variation in the neutra! curves as IX varies over these two orders of magnitude,
but the disturbance phase speed depends strongly on IX. When IX
is large, the bounding surfaces are able to react quickly to the mov-ing cells within the porous layer, which causes the phase speed to be close to 1. But when IX is small, and especially when k is also
rel-atively small, then heat penetration into the bounding layers is slow, and this reduces greatly the disturbance phase speed.
An illustration of this is given in Fig. 7 when the wavenumber is given by k = 2. The streamlines and isotherms for the case IX = 1 0 give no indication that there is a horizontal flow in the porous layer, and therefore we may conclude that the bounding layers are reacting very quickly to the moving cells in the porous layer.
When IX= 1, there is an indication of cellular movement, but this
is most pronounced when IX= 0.1, where the thermal drag caused
by the low diffusivity in the bounding layers is clearly evident.
5.3. The influence of variations in Pe.
Fig. 8 illustrates how variations in the Péclet number affects the neutra! curves and the associated phase speeds. Here we have plot-ted values of cjPe in order to compare different cases easily. The Pe = 0 case actually corresponds to Pe = 10-4 as an approximation to the Pe --+ 0 limit.
In ali cases one finds that increasing values of the Péclet number causes the system to tend towards the Lapwood-Prats problem where Rac = 4n2, kc = n and Cc= Pe. That this should happen may
be understood by appealing to the fact that when cells pass a given point on the interface between the porous layer and one of the bounding layers, that point will experience very rapid oscillatory changes in the heat transfer. There will be very little time available for the heat in a hot cell to warm up the bounding layer before a cold cell replaces it. Thus the thermal penetration is small when Pe is large, and the phase speed will be almost the same as the va-lue ofPe.
Sorne streamlines and isotherms are displayed in Fig. 9 for the cases,
Pe
= 0, 1, 1 0 and 1 00. In this Figure we have chosen to usethe wavenumber corresponding to the respective critical values. We see that the isotherms in the bounding layers become
3. 2 Rac 40.0 kc 3. 0 2.
8
2.6
2. 4 2. 2 2. 0 2 5. 01.8
2 2. 51.6
RPNPPl⦅MMMMセMMMMセMMMMMMセMMMMセMMMMセ@ 10 10Pe
Pe
u/Pe1.
0 0.8
0.6
0. 4 0. 2 0. 0 0 10Pe
Pe
Fig. 12. Critical values for Ra,k,c and cj Pe as a function of Pe for d = 1 and cc= 10 and for セ@ = 10,1 ,0.5,0.2,0.1 ,0.05,0.02 and 0.01. The dotted line corresponds ta セ@ = 0.01. increasingly deformed as the Péclet number increases. At the same
time the thermal penetration decreases, thereby confirming the above discussion. In addition the critical wavenumber increases towards n, which is equivalent ta the disturbance wavelength decreasing towards 2. In the most extreme case, for which Pe = 1 00, the presence of the thermal disturbance in the bounding layers is shawn only by the zero isotherms. These isotherms tend towards the horizontal as Pe increases stiJl further.
5.4. Variation of critical values
We now summarise much of the above and many more cases in Figs. 1 0-12.
Fig. 10 shows how Rac,kc and Cc vary with {J for selected values of
d while Pe =oc= 1. Bath the critical Rayleigh and wave numbers in-crease as d inin-creases but dein-crease as {J increases. There is a very distinct value of {J beyond which these critical values do not change
and this is because the width of the bounding plates is grea ter than the thickness of the disturbance field. As the bounding plates de-crease in thickness ( decreasing o) the composite layer eventually returns ta one which is identical ta the single-layer Darcy-Bénard problem. However, the critical phase velocity bas a more compli-cated dependence on d. When d takes very large or very small val-ues either the bounding surfaces resemble very closely the classical Darcy-Bénard problem and are essentially at constant tempera-ture, or else no beat passes into the bounding layers, thereby mim-icking the constant-beat-flux form of the Darcy-Bénard problem.
In bath cases the bounding surfaces play a minimal raie and the phase speed of disturbances is approximately the same as the Péclet number. At intermediate values of d, there is a thermal inter-action between the porous and the bounding layers and therefore the phase speed decreases.
Variations of the critical values with d for chosen values of {J are
displayed in Fig. 11. With regard ta Rac and kc. we see the full tran-sition between the constant beat flux (Rac = 12 and
kc
= 0) and the constant temperature ( Rac = 4n2 and kc = 12) versions of theDarcy-Bénard problem as d increases. Although we do not show it here, for the sake of brevity, the numerical data suggest strongly that there is a form of similarity solution when d
«
1, namely that Rac and kc each collapse onto one curve when plotted againstdfo.
Decreasing values of d and {J correspond respectively ta thecon-stant beat flux and the concon-stant temperature single layer models, and therefore the transition between the two depends in a fairly simple way on the relative sizes of d and
o.
Fig. 12 shows the effects of increasing values of Pe on the critical parameters. As discussed above in connection with Fig. 9, an increasing value of Pe causes a return ta the Prats case because the cells are moving tao quickly ta transfer beat into or from the bounding layers. Thus Rac---> 4n2, kc---> 1t and Cc/Pe---> 1 asPe---> oo.
5.5. Unusually-shaped neutra! curves
We complete our survey of the dependence of the onset cri te-rion on its four governing parameters by exploring one part of
300 3. 0
Ra
c
250 2. 5 200 2. 0 150 1.5 100 1.0 50 0.5Pe=3
--00 7 0.00 10k
k
200Ra
175c
1.0 150 0.8 125 0.6 100 75 0. 4 50 0. 2 25Pe
=
1
00 7 10k
k
60 0. 3 0c
Ra
55 0. 2 5 50 4 5 0. 2 0 4 0 0. 15 35 0.10 30 0. 0 5 25Pe
=
0.3
200 5 10k
k
Fig. 13. Neutra! curves (left) and the corresponding values of the wavespeed, c, (right) ford= 1 and Pe = 1 for the stated values of cc. The following values of cc were used: cc= 100,30,10,3,1,0.3,0.1, 0.03,0.01,0.003 and 0.001. For the case, Pe = 0.3, the value cc= 0.0003 was also used. The dotted line corresponds to cc= 100 and the dashed line to cc=O.Ol.
the parameter space where the neutra! curves no longer have the standard unimodal shape. As mentioned earlier in the Introduction section, multimodal curves are well-known and often arise in lay-ered systems, such as those studied by Rees and Riley [16] and Proctor and jones [21]. For the present system we also obtain mul-timodal curves, but these are not always a single-valued function of the wavenumber. We show three different cases in Fig. 13,
and there correspond to different values of the Péclet number, and each subfigure shows neutra! curves for a variety of values of IX where, in every case, we have d = b = 1.
When Pe = 3 the left hand branch of the neutra! curve first
develops a kink as IX decreases which then evolves into a curve with two minima. The right hand minimum always remains the one with the lower value of Ra. At still smaller values of IX the spike
Ra 70 65 60 55 50 45 40 3 5 3 0 0 5 k
Fig. 14. Neutra! cuiVes displaying two minima for the case d = 1 and Pe = 1. From the lowest to the uppermost, the cuiVes correspond to IX= 128.75 {ô= 0.231589),
IX= 135 (ô= 0.270102), IX= 200 {ô= 0.323819), IX= 500 (ô= 0.346877) and IX= 1000
(ô= 0.348371). The bullet symbols denote local minima while the empty circles are local maxima.
in the neutra! curve bends to the left, although this is difficult to see directly here: its presence is clear in the numerical data but it may also be inferred by the behaviour of Cc. The Pe = 1 case displays the same behaviour but the left-leaning spike appears at a much larger value of k. The presence of the spike is somewhat misleading since c varies as one traverses the neutra! curve. A three-dimensional plot of Ra where k and
c are bath horizontal
coordinates would find the curve travelling in the c-direction at the tip of the spike.When Pe = 0.3 the overall evolution of the neutra! curve is slightly different as rx decreases. lnstead of first developing two minima, the curve now first becomes multivalued prior to creating a new local maximum and minimum. We see that when rx = 0.0003 the neutra! curve has now developed three minima and two maxima.
By continuity this behaviour must persist in a region of param-eter space close to d =
o
= 1, although we have not investigated therange of existence of these exotically-shaped curves.
Finally, in Fig. 14, we display sorne cases where the neutra! curves have two minima corresponding to the same Rayleigh number, and allow these minima and the intermediate maximum to merge together. We have taken the values Pe = d = 1 for this one illustration. The lowest curve corresponds to a parameter set which is very close to that corresponding to the quartic point, which we estimate as being at rx = 128.64 and
o
= 0.2303 and where Rac=35.7544 and kc=2.516. Other quartic points will existas either or bath of Pe and d are varied.6. Conclusions
In this paper we have sought to present concisely as much information as we can on the stability characteristics of a porous layer heated from below which is bounded bath above and below by conducting impermable layers and where there is an overall background flow along the layer which is driven by an extemal pressure gradient. The behaviour of the resulting neutra! curves
cannat always be predicted by means of a simple "addition" of the known effects of conducting bounding layers (viz. a smooth variation between the properties of constant temperature surfaces and constant heat flux surfaces) and of a background flow (viz. a movement of the cells along the layer whwere the phase velocity is identical to that of the background flow). While it is clear that, when Pe takes small values then the stability characteristics are close to that for a zero-Pe layer with conducting bounding layers, and when Pe takes sufficiently large values then we have essen-tially the situation described by Prats [19] and which is indepen-dent of the bounding layers, the transition between these two extremes is not straightforward in ali cases. We have found that it is possible for the neutra! stability curve to have more than one minimum. But in general the presence of the bounding layers serves to redu ce the phase speed of the convection ce lis relative to that found by Prats [19].
References
[ 1] C.W. Horton, F.T. Rogers, Convection currents in a porous medium,]. Appt. Phys 16 (1945) 367-370.
[2] E.R. I.apwood, Convection of a fluid in a porous medium, Proc. Cambridge Philos. Soc 44 {1948) 508-521 .
[3] DAS. Rees, D.S. Riley, The effects ofboundary imperfections on convection in a saturated porous layer: non-resonant wavelength excitation, Proc. R. Soc. London A421 (1989) 303-339.
[4] DAS. Rees, D.S. Riley, The effects ofboundary imperfections on convection in a saturated porous layer: near-resonant wavelength excitation, ]. Fluid Mech. 199 {1989) 133-154.
[ 5] DAS. Rees, Stability analysis of Darcy-Bénard convection, Lecture Notes for the Summer School on Porous Medium Aows, Neptun, Constanta. Romania (25-29 june 2001 ).
[6] DA Nield, Onset of thermohaline convection in a porous medium, Water Resour. Res. 11 {1968) 553-560.
[7] DAS. Rees, A. Mojtabi, The effect of conducting boundaries on weakly nonlinear Darcy-Bénard convection, Trans p. Porous Media 88 (2011) 45-63.
[8] DAS. Rees, The stability of Darcy-Bénard convection, in: K. Vafai (Ed.), Handbook of Porous Media, Marcel Dekker, 2000, pp. 521-558.
[9] P.A. Tyvand, Onset of Rayleigh-Bénard convection in porous bodies, in: D.B. lngham, 1. Pop (Eds.), Transport Phenomena in Porous Media Il, Elsevier, New York, 2002, pp. 82-112.
[10] D.A.S. Rees, A. Selim, ].P. Ennis-King, The instability of unsteady boundary layers in porous media, in: P. Vadasz (Ed.), Emerging Topics in Heat and Mass Transfer in Porous Media, Springer, 2008, pp. 85-11 O.
[11] T. Nguyen-Quang, F. Guichard, T.H. Nguyen, Spatial pattern formation of motile microorganisms: From gravititactic bioconvection to protozoan culture dynamics, in: K. Vafai (Ed.), Porous Media: Applications in Biological Systems and Technology, CRC Press, 2010, pp. 535-567.
[12] 1. Pop, D.B. Ingham, Convective Heat Transfer: Mathematical and Computational Modeling of Viscous Fluids and Porous Media, Pergamon, Oxford, 2001.
[13] D.A. Nield, A. Bejan, Convection in Porous Media, third ed., Springer, New York, 2006.
[14] R. Rana, R.N. Horne, P. Cheng, Natural convection in a multi-layered geothermal reseiVoir, A.S.M.E.C: ]. Heat Transfer 101 (1979) 411-416. [15] R. McKibbin, M.J. O'Sullivan, Onset of convection in a layered porous medium
heated from below,]. Fluid Mech. 96 (1980) 375-393.
[16] D.A.S. Rees, D.S. Riley, The three-dimensional stability of finite-amplitude convection in a layered porous medium heated from below, ]. Auid Mech. 211 {1990) 437-461.
[17] A. Mojtabi, D.A.S. Rees, The effect of conducting bounding plates on the onset of Horton-Rogers-I.apwood convection, lnt.]. Heat Mass Transfer 54 (1-3) (2011) 293-301.
[18] N. Riahi, Nonlinear convection in a porous layer with finite conducting boundaries,j. Auid Mech. 129 {1983) 153-171.
[19] M. Prats, The effect of horizontal fluid motion on thermally induced convection currents in porous mediums,]. Geophys. Res. 71 (1967) 4835-4838. [20] D.A.S. Rees, G. Genç, The onset of convection in porous layers with multiple
horizontal partitions, Int.j. Heat and Mass Transfer 54 (2011) 3081-3089. [21] M.R.E. Proctor, C.A. jones, The interaction oftwo spatially resonant patterns in
thermal convection. Part 1: Exact 1:2 resonance,]. Fluid Mech. 188 (1988) 301-355.