HAL Id: hal-01382471
https://hal.archives-ouvertes.fr/hal-01382471
Submitted on 17 Oct 2016
HAL is a multi-disciplinary open access
archive for the deposit and dissemination of
sci-entific research documents, whether they are
pub-lished or not. The documents may come from
teaching and research institutions in France or
abroad, or from public or private research centers.
L’archive ouverte pluridisciplinaire HAL, est
destinée au dépôt et à la diffusion de documents
scientifiques de niveau recherche, publiés ou non,
émanant des établissements d’enseignement et de
recherche français ou étrangers, des laboratoires
publics ou privés.
Two-degree-of-freedom vortex-induced vibrations of a
circular cylinder at Re=3900
Simon Gsell, Rémi Bourguet, Marianna Braza
To cite this version:
Simon Gsell, Rémi Bourguet, Marianna Braza. Two-degree-of-freedom vortex-induced vibrations of
a circular cylinder at Re=3900. Journal of Fluids and Structures, Elsevier, 2016, 67, pp.156-172.
�10.1016/j.jfluidstructs.2016.09.004�. �hal-01382471�
O
pen
A
rchive
T
OULOUSE
A
rchive
O
uverte (
OATAO
)
OATAO is an open access repository that collects the work of Toulouse researchers and
makes it freely available over the web where possible.
This is an author-deposited version published in : http://oatao.univ-toulouse.fr/
Eprints ID : 16249
To link to this article : DOI:10.1016/j.jfluidstructs.2016.09.004
URL : http://dx.doi.org/10.1016/j.jfluidstructs.2016.09.004
To cite this version : Gsell, Simon and Bourguet, Rémi and Braza,
Marianna Two-degree-of-freedom vortex-induced vibrations of a
circular cylinder at Re=3900. (2016) Journal of Fluids and Structures,
vol. 67. pp. 156-172. ISSN 0889-9746
Any correspondence concerning this service should be sent to the repository
administrator: staff-oatao@listes-diff.inp-toulouse.fr
Two-degree-of-freedom vortex-induced vibrations of a circular
cylinder at Re=3900
Simon Gsell, Rémi Bourguet
⁎, Marianna Braza
Institut de Mécanique des Fluides de Toulouse, UMR 5502 CNRS-INPT-UPS, Allée du Prof. Camille Soula, F-31400 Toulouse, France
Keywords:
Vortex-induced vibrations Two-degree-of-freedom oscillator Turbulentflow
Direct numerical simulation
A B S T R A C T
The vortex-induced vibrations of an elastically mounted circular cylinder are investigated on the
basis of direct numerical simulations. The body is free to move in the in-line and cross-flow
directions. The natural frequencies of the oscillator are the same in both directions. The Reynolds number, based on the free stream velocity and cylinder diameter, is set to 3900 and
kept constant in all simulations. The behavior of the coupledflow-structure system is analyzed
over a wide range of the reduced velocity (inverse of the natural frequency) encompassing the
lock-in range, i.e. where body motion andflow unsteadiness are synchronized. The statistics of
the structural responses and forces are in agreement with prior experimental results. Large-amplitude vibrations develop in both directions. The in-line and cross-flow oscillations are close to harmonic; they exhibit a frequency ratio of 2 and a variable phase difference across the lock-in range. Distinct trends are noted in the force-displacement phasing mechanisms in the two
directions: a phase difference jump associated with a sign change of the effective added mass and
a vibration frequency crossing the natural frequency is observed in the cross-flow direction,
while no phase difference jump occurs in the in-line direction. Higher harmonic components
arise in the force spectra; their contributions become predominant when the cylinder oscillates close to the natural frequency. The force higher harmonics are found to impact the transfer of
energy between theflow and the moving body, in particular, by causing the emergence of new
harmonics in the energy transfer spectrum.
1. Introduction
Vortex shedding from a bluff body immersed in a flow is accompanied by unsteady forces exerted by the fluid on the body. In the case offlexible bodies with bluff cross-section, these unsteady forces may lead to structural vibrations. Vortex-induced vibrations (VIV) occur when the body oscillation and the unsteady wake synchronize, a mechanism referred to as lock-in. VIV are encountered in a variety of natural and industrial systems. In civil and offshore engineering, these vibrations lead to fatigue or even failure of the structures and their prediction is thus crucial. On the other hand, VIV can also be used as mechanical energy converter in the context offlow energy harvesting (e.g.Grouthier et al., 2014). The physical analysis and the prediction of VIV have motivated a number of studies, as reviewed byBearman (1984),Sarpkaya (2004),Williamson and Govardhan (2004), andPaïdoussis et al. (2010).
During the last decades, VIV have been extensively studied through the canonical problem of a rigid circular cylinder elastically mounted or forced to oscillate in the cross-flow direction, as a paradigm of more complex configurations (e.g.Feng, 1968; Mittal and Tezduyar, 1992; Hover et al., 1998; Khalak and Williamson, 1999; Govardhan and Williamson, 2000; Carberry et al., 2001;
http://dx.doi.org/10.1016/j.jfluidstructs.2016.09.004
⁎Corresponding author.
Blackburn et al., 2001; Shiels et al., 2001; Leontini et al., 2006). Significant body vibrations occur on a well-defined range of the reduced velocity, which is defined as the inverse of the oscillator natural frequency non-dimensionalized by the inflow velocity and the body diameter. In this range called lock-in range, the body oscillation frequency is the same as the unsteady wake frequency. The body response amplitude exhibits a bell-shaped evolution as a function of the reduced velocity. For large mass ratio between the body and thefluid, and large damping, two branches of response are observed, the initial and lower branches (following the terminology ofKhalak and Williamson, 1996). Decreasing the mass ratio and damping results in the appearance of an upper branch, between the initial and lower branches (Khalak and Williamson, 1997a, 1999). The vibration amplitudes are larger in the upper branch and may reach one cylinder diameter. When the mass ratio is large, the lock-in frequency significantly departs from the Strouhal frequency (i.e. the shedding frequency downstream of a stationary body) but it remains close to the natural frequency of the oscillator, as observed in the experiments ofFeng (1968). At lower mass ratios, the lock-in frequency can shift away from the natural frequency of the oscillator; such deviation may be connected to the variability of the effective added mass related to the unsteady fluid forces (Moe and Wu, 1990; Khalak and Williamson, 1997a).
Previous studies have shown that adding a degree of freedom in the in-line direction, viz. the direction aligned with the current, can considerably alter the cross-flow response. In their experiments,Jauvtis and Williamson (2004)(referred to as J & W in this paper) identified an amplification of the cross-flow vibration in the upper branch, called super-upper branch, with amplitudes up to 1.5 diameters. In the in-line direction, the maximum amplitudes are close to 0.3 diameters.Dahl et al. (2010)pointed out the effect of the ratio between the in-line and cross-flow natural frequencies on the system responses.
Numerical simulation is a useful tool to study VIV: it provides a simultaneous vision of the wake patterns,fluid forcing and body responses, which allows a coupled analysis of theflow-structure system. However, the numerical simulation of VIV in conditions close to those encountered in nature or in the experimental works remains challenging. In particular, the simulation offlows at high Reynolds number (Re, based on the inflow velocity and the cylinder diameter) requires massive computational resources and often, additional modeling (e.g. turbulence closure). This explains why most of the numerical works concerning VIV have been dedicated to low Reynolds number configurations, even though the Reynolds number is known to have a significant impact on the system behavior (Govardhan and Williamson, 2006; Raghavan and Bernitsas, 2011; Bearman, 2011). Recent studies have shown that with the improvement of numerical methods and the development of computational resources, the investigation of VIV in the turbulent regime via numerical simulation becomes possible (e.g.Al-Jamal and Dalton, 2004; Lucor et al., 2005; Sarkar and Schlüter, 2013; Navrose, 2013; Lee et al., 2014; Zhao et al., 2014). The present work aims at contributing to this effort.
In the present study, the response of an elastically mounted circular cylinder free to move in the in-line and cross-flow directions is investigated on the basis of direct numerical simulation (DNS) results, at Re=3900. This value of the Reynolds number was often selected in prior studies concerningflows past fixed cylinders as a typical case of the early turbulent regime (e.g.Beaudan and Moin, 1994). Thefluid–structure system behavior is computed over a wide range of reduced velocities encompassing the lock-in range. The Reynolds number is kept constant in all simulations so that the reduced velocity is the only varying parameter. The DNS approach involves the prediction of the three-dimensionalflow around the cylinder, as illustrated inFig. 1, which represents an instantaneous iso-surface of the Q criterion (Hunt et al., 1988) colored by iso-contours of the spanwise vorticity around a cylinder subjected to VIV. However, this paper does not aim at providing a detailed analysis of the three-dimensional wake patterns; instead, the objective here is to focus on the interaction between the moving body and theflow through the span-averaged fluid forces, with a particular
Fig. 1. Three-dimensional wake downstream of a freely vibrating cylinder: instantaneous iso-surface of the Q criterion (Q=0.1) colored by iso-contours of the spanwise vorticity (ω ∈ [ − 0.85, 0.85]z ) in the region of maximum vibration amplitudes (U* = 6). The trajectory of the cylinder is represented by a line at the end of the body and arrows indicate the direction of the oncomingflow. Part of the computational domain is shown.
attention paid to the phasing and spectral content of the forcing andflow-structure energy transfer.
The methodology employed in this work is described inSection 2. The results are presented inSection 3: the body response is quantified inSection 3.1, the occurrence of wake-body synchronization is analyzed inSection 3.2and thefluid forces are examined inSection 3.3. The principalfindings of the present work are summarized inSection 4.
2. Physical model and numerical method
The physical system considered in this study is presented inSection 2.1. The numerical method is described inSection 2.2and data post-processing inSection 2.3.
2.1. Physical system
A sketch of the physical configuration is presented inFig. 2. An elastically mounted circular cylinder of diameter D and mass per unit lengthρcis immersed in a cross-flow. The flow is characterized by its velocity U, density ρfand dynamic viscosityμ. The
Reynolds number based on U and D, Re=ρ UD μf / , is set to 3900. The flow dynamics is governed by the three-dimensional incompressible Navier–Stokes equations. The cylinder is free to oscillate in the in-line (x-axis) and cross-flow (y-axis) directions. The structural stiffness and damping ratio in the i-direction (x or y) are designated by kiandξi. All the physical quantities are made
non-dimensional by D, U andρf. The non-dimensional cylinder displacement, velocity and acceleration in the i-direction are denoted by
ζi, ζ˙iand ζ¨i. The force coefficient in the i-direction is defined as Ci= 2 /F ρ DUi f
2, where F
idenotes the span-averaged force in the i
direction. The non-dimensional mass is defined as m=ρ ρ Dc/f 2; it is set to 2. The body dynamics in the i direction is governed by a forced second-order oscillator equation:
⎛ ⎝ ⎜ ⎞ ⎠ ⎟ ζ πξ U ζ π U ζ C m ¨ + 4 * ˙ + 2 * =2 . i i i i i i i 2 (1) The reduced velocity in the i-direction is defined as Ui* = 1/fnat i,, where fnat i, is the non-dimensional natural frequency in vacuum,
fnat i, =D πU k ρ/2 i/c. In the following, the structural stiffnesses are the same in both directions; the reduced velocity and natural
frequency of the oscillator are referred to as U* =Ux* =Uy*and fnat =fnat x, =fnat y,. The damping ratio is set equal to zero in both directions to allow maximum amplitude oscillations (ξ = 0i ).
2.2. Numerical method
The behavior of the coupledflow-structure system is predicted by direct numerical simulation of the three-dimensional Navier– Stokes equations over a range of U*. The computations are performed with thefinite-volume code Numeca Fine/Open (www.
numeca.com)which employs a preconditioned multigrid method (Liu et al., 1998). The viscousfluxes are determined with a second-order purely central scheme and the inviscid fluxes are computed with a second-order central scheme with a scalar artificial dissipation term (Jameson et al., 1981). A second-order time integration is performed using a dual-time stepping method and a Runge–Kutta scheme.
The Navier–Stokes equations are expressed in the cylinder frame which avoids any grid deformation. The frame motion is taken into account by adding inertial terms in the Navier–Stokes equations (Newman and Karniadakis, 1997). At each time step, Eq.(1)is solved implicitly following the same iterative pseudo-time integration scheme as for thefluid equations. The right hand side terms of (1)as well as the inertial terms added in thefluid equations are updated at each inner iteration.
Theflow is discretized on a non-structured grid in a rectangular computational domain. The cylinder is placed at x y( , ) = (0, 0). It
is recalled that the lengths are non-dimensionalized by D. The domain extends from x = − 30 at the inlet to x=90 at the outlet, and fromy = − 30to y=30 in the cross-flow direction. The spanwise length of the cylinder is discussed in the following. Periodic boundary conditions are used in the spanwise and cross-flow directions. An unsteady Dirichlet boundary condition is used at the inlet of the domain and is updated at each inner iteration according to the velocity of the frame moving with the body. In the present computations, the free stream velocity in the moving frame always remains positive and a standard outflow condition is used at the outlet. All the computations are initialized with a static body.
A convergence study has been performed in order to set the numerical parameters. Some results are reported inTable 1. The cross-flow vibration frequency and fluid forces obtained for different sets of numerical parameters are compared atU* = 6(i.e. in the range of maximum vibration amplitudes, as shown inSection 3.1). In this table and in the following,‾ denotes the time-averaging operator and′ designates the root-mean-square (RMS) value. Three grids are considered. In grids M1 and M2, the spanwise length of the cylinder is set to 3 diameters (from z = − 1.5 to z=1.5). The grid M1 is composed of6 × 106cells. The grid size in the wall-normal direction at the cylinder surface is nΔ = 1.5 × 10⁻³. The grid M2 presents afiner resolution around the body and a larger number of cells nzin the spanwise direction; it is composed of 11.5 × 10⁶ cells. The grid M1bispresents the same resolution as M1 but the
spanwise length of the cylinder is set to 10 diameters (20 × 106cells). The effect of the time stepΔtis also investigated. As part of the
dual-time stepping method, the time integration is made through a series of sub-iterations; a number of 50 sub-iterations has been found sufficient to ensure convergence of the inner loop. The reference set of parameters considered for comparison inTable 1is case 1. In case 2, the refined mesh M2 is used with the same time step as in case 1. In case 3, the mesh M2 is also used but the time step is divided by 2. In case 4, the mesh M1bisis used and the other numerical parameters are the same as in case 1. In all cases, the
relative variation of the results with respect to case 1 does not exceed 1.6%. The numerical parameters of case 1 were selected in this study. In addition to the above convergence study, the simulation results are compared, in the next section, to experimental data reported byJauvtis and Williamson (2004)for a similar physical system; as shown in the following, the present numerical results match the experimental data, which confirms the reliability of the simulation approach.
The simulations were performed on 72 computer cores. The time per iteration was approximately equal to 2.25 min. Depending on the reduced velocity, between 5000 and 20,000 iterations were necessary to obtain statistical convergence of the physical quantities. In order to cover the range of reduced velocities under study, 13 cases were simulated.
2.3. Data processing
The amplitudes of motionζxmandζymare defined as the average of the highest 10% of the response amplitudes, as inDahl et al.
(2010), Hover et al. (1998). In the in-line direction, the displacement fluctuation ζ∼x=ζx−ζx is considered to calculate the
amplitude. The Hilbert transform is used to determine the instantaneous phase and frequency of the forces and displacements (Huera-Huarte and Bearman, 2009). Considering a real signal s which is a function of time t, the analytic signal is defined as
/
s ta( ) = ( ) +s t i ( ( ))s t , where/ s( )is the Hilbert transform of s. In exponential form, the analytic signal is written as s ta( ) =S t ea( ) iϕ t( ),
where Sa and ϕ are the instantaneous amplitude and instantaneous phase of s. The instantaneous frequency is defined as f= (1/2 ) × (π dϕ dt/ ). As generally done in this context (e.g.Cagney and Balabani, 2014; Grouthier et al., 2014; Narendran et al., 2015), the signals were high-passfiltered in order to avoid low-frequency fluctuations which are not occurring through lock-in. The cut off frequency is equal to half of the time-averaged body oscillation frequency. A span and phase averaging of theflow quantities is used in order to determine the wake patterns inSection 3.2. The phase averaging is performed over four oscillation cycles. For each cycle, a series offive snapshots close to the targeted phase are selected. The phase-averaged fields are thus computed with 20 snapshots.
3. Results
The results of the present work are reported in this section. The body responses in both directions are described inSection 3.1. The structural oscillations develop under wake-body synchronization, which is the object ofSection 3.2. Thefluid forces are analyzed inSection 3.3.
3.1. Body responses
Fig. 3depicts the responses of the body over the range of reduced velocities investigated. The amplitudes of displacement in both directions are presented and compared with the experimental results of J & W. It is recalled that in the paper of J & W the reduced
Table 1
Influence of the numerical parameters on the cross-flow vibration frequency, time-averaged and RMS fluid force coefficients at U* = 6 (region of maximum vibration amplitudes). For each case, the relative variation with respect to the case of reference (case 1) is indicated in brackets.
Case Mesh Cells( × 10 )6 Lz nz Δt fy Cx C ′x C ′y
1 M1 6 3 60 0.05 0.129 2.89 1.12 1.55 2 M2 11.5 3 80 0.05 0.129 (0.0%) 2.86 (1.0%) 1.11 (0.9%) 1.55 (0%) 3 M2 11.5 3 80 0.025 0.131 (1.6%) 2.91 (0.7%) 1.13 (0.9%) 1.55 (0%) 4 M1bis 20 10 200 0.05 0.128 (0.8%) 2.91 (0.7%) 1.13 (0.9%) 1.57 (1.3%)
velocity is based on the oscillator natural frequency in water while the natural frequency in vacuum is used to define U*in the present
paper; the results of J & W reported inFig. 3have been adapted to match the present definition of U*. The Reynolds number in the experiments ranges from 1000 to 15,000, and can thus differ from the value in the present simulations (Re=3900). Otherwise, the present system is comparable to the experimental system of J & W. In particular, the mass ratio mexp≈ 2 and the low structural damping ratio ξexp≈ 0.5 × 10⁻²in the experiments are close to the present configuration. The three branches of response reported by J & W can be identified in the present numerical results: the initial branch (IB), the upper branch (UB) and the lower branch (LB). In the initial branch, the cross-flow amplitudes are in agreement with the data of J & W (Fig. 3(a)). In the upper branch, the maximum amplitude predicted by the simulation at U* = 6.5 (about1.2D) is lower than the amplitude measured experimentally at the same reduced velocity; it is recalled that some deviations are expected due to the difference in the value of Re. Between U* = 6.5 and
U* = 7, the oscillation amplitude sharply decreases. In the lower branch, numerical and experimental results are in agreement for
U* < 11. For higher reduced velocities, the cross-flow amplitudes predicted by the simulations are higher than in the experiments.
This range of reduced velocities corresponds to the onset of the desynchronized state (described inSection 3.2) and has been observed to be very sensitive to structural damping. As the effect of structural damping is not directly the object in this study (here the damping is set to zero), this aspect is briefly addressed in Appendix A. Overall, the cross-flow amplitudes issued from the simulations and the experiments are consistent over the lock-in range. In the in-line direction, the simulations are in agreement with the data of J & W (Fig. 3(b)). Substantial amplitudes of in-line oscillation are noted in the initial and upper branches. In the lower branch, the in-line amplitudes are small compared to those occurring in the cross-flow direction, but still they are not negligible. The cross-flow frequency ratio fy* =f fy/nat is plotted inFig. 3(c). The present results match the experimental data of J & W. The oscillator natural frequency fnatand the wake frequency in the static body case (Strouhal frequency, St) are indicated by dashed lines
in this plot. It can be observed that the response of thefluid–structure system significantly departs from these frequencies, as also mentioned in prior studies. In the following, the behavior of the system in the three branches of response will be illustrated by considering three representative values of the reduced velocity, U* = 3, 6 and 9, i.e. one typical case for each branch (Fig. 3(a)).
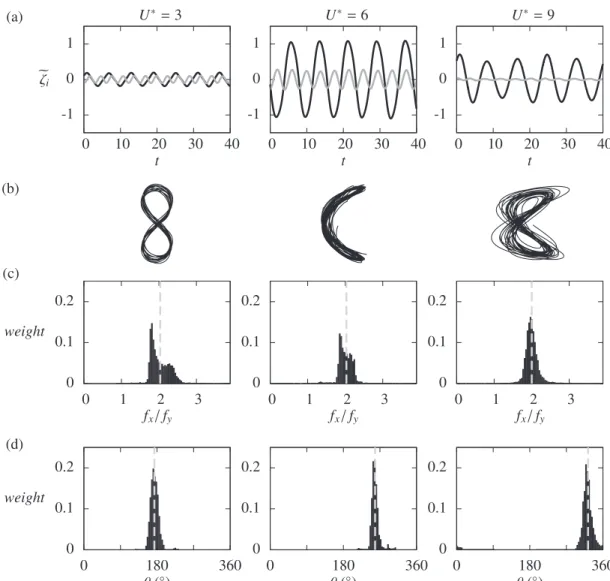
Fig. 4exemplifies the mechanisms of synchronization between the in-line and cross-flow displacements, in the three branches of response. InFig. 4(a), selected time series of thefluctuating in-line and cross-flow displacements are plotted as functions of the non-dimensional time t, for the above mentioned values of U*. The corresponding trajectories of the body in the (x,y) plane are depicted inFig. 4(b).Fig. 4(c) shows the histograms of the instantaneous in-line/cross-flow response frequency ratio f f/x y. The instantaneous
frequencies are determined via the Hilbert transform as explained in Section2.3. In each plot, the time-averaged value of f fx/yis indicated by a dashed line. Despite a certain variability in the histogram shapes, the in-line response frequency is, on average, twice the cross-flow response frequency, for all studied cases. This ratio is expected due to the symmetry of the physical system with respect to the(0, , )x z plane. The body thus exhibits figure-eight and crescent-shaped trajectories, as observed in Fig. 4(b). Considering an average frequency ratio f fx/y = 2, the phase difference between the in-line and cross-flow displacements can be
Fig. 3. Responses of the body in the range of lock-in: (a) cross-flow and (b) in-line maximum amplitudes of oscillation and (c) cross-low frequency ratio, as functions of the reduced velocity. The results are compared to the experimental data of J & W.
defined as θ=ϕζ − 2ϕζ
x y, whereϕζxandϕζyare the instantaneous phases of the in-line and cross-flow displacements. The histograms
ofθ are plotted inFig. 4(d). For the three reduced velocities considered, the histograms exhibit a sharp and symmetric aspect. The
Fig. 4. Synchronization between the in-line and cross-flow displacements, for three selected values of the reduced velocity (one in each branch of response): (a) selected time series of the in-line (gray) and cross-flow (black) displacements, (b) trajectories of the body in the (x,y) plane (not at scale), (c) histograms of the frequency ratio f fx/yand (d) histograms of the phase difference θ.
Fig. 5. Time-averaged phase difference between the in-line and cross-flow displacements. The values obtained in the present study are compared to the experimental results of J & W.
time-averaged value ofθ, indicated by a vertical dashed line in each plot, varies as a function of the reduced velocity, as also observed in previous studies. The values of θ are related to the shape of the orbits shown inFig. 4(b). When the body follows afigure-eight path, two types of orbits may be identified: if the body moves downstream (respectively upstream) when reaching the extremes of its cross-flow motion, the orbit is referred to as clockwise (respectively counter-clockwise), as defined byDahl et al. (2010). Clockwise orbits appear in the range θ ∈ ]90°, 270°[ while counter-clockwise orbits appear in the range θ ∈ [0°, 90°[ ∪ ]270°, 360°]. The values
θ = 90°and θ = 270° correspond to crescent-shaped orbits. As shown inFig. 5which represents the evolution of θ as a function of the reduced velocity, the body tends to exhibit clockwise orbits in the initial and upper branches and counter-clockwise orbits in the lower branch. The values of θ are consistent with the experimental results of J & W, also reported inFig. 5.
The spectral contents of the body displacements are quantified for the three selected values of U*inFig. 6. In these spectra and in
the following, the spectral amplitude is normalized by the amplitude of the highest peak and the frequencies are scaled by the time-averaged value of the cross-flow vibration frequency. In the in-line direction, the displacement appears to be essentially harmonic. All the spectra are dominated by a peak at f= 2fy. At U* = 9, a broadband low-frequency bump of limited magnitude appears close to
f=fy, suggesting a loss of symmetry in the wake. Such symmetry breaking may be related to the appearance of asymmetric vortex shedding patterns (Williamson and Roshko, 1988), or to asymmetric low-frequency modulations of the wake. In the cross-flow direction, small amplitude third harmonic contributions are noted at U* = 3 andU* = 6, but the spectra are dominated by the frequency f=fy. Overall, the displacements in both directions remain very close to harmonic functions; this is verified over the
entire range of U*investigated. A harmonic modeling of the displacements thus appears to be a reasonable approximation which will
be adopted inSection 3.3.3.
3.2. Wake-body synchronization
Visualizations of the span- and phase-averaged spanwise vorticity in the wake of the cylinder are shown inFig. 7(a), for the three selected values of U*. In these plots, ζ = 0y and the body is moving upward. Different wake patterns may be identified following the
classification introduced byWilliamson and Roshko (1988). In the initial and upper branches, a 2S wake pattern is noted while a 2P pattern is observed in the lower branch. This is consistent with the observations ofNavrose (2013)(at Re=1000) but not with the visualizations of J & W, who observed a 2T pattern (two triplets of vortices shed per oscillation period) in the upper branch instead of 2S. A 2T pattern was also observed byDahl et al. (2007)andZhao and Cheng (2011), at Re=10,000 and Re=7500. In order to clarify the impact of the oscillation amplitude and Reynolds number on the emergence of the 2T pattern, a forced oscillation simulation was performed. All parameters of the body motion (amplitudes, frequencies, phase difference) were set to match the trajectory observed by J & W in the peak amplitude region, while the Reynolds number was kept equal to 3900. The 2T pattern did not appear in this forced oscillation case. This additional simulation suggests that the emergence of the 2T pattern could be determined by the value of the Reynolds number. The spectra of the cross-flow velocity in the wake of the cylinder at x y z( , , ) = (10, 0, 0)are plotted inFig. 7(b).
Even if the wake pattern differs from one reduced velocity to the other, all velocity spectra are very similar. In each branch of response, the velocity spectrum is dominated by the body vibration frequency (fy): the body and the wake are synchronized. The lock-in condition is established in all studied cases.
In the higher range of U*, the flow-structure system transitions towards the desynchronized state (Khalak and Williamson,
1997a). This can be observed in the velocity spectra presented inFig. 8. AtU* = 10, the spectral content of the cross-flow velocity in
Fig. 7. Wake-body synchronization, for three selected values of the reduced velocity: (a) iso-contours of span- and phase-averaged spanwise vorticity in the vicinity of the cylinder and (b) spectra of the cross-flow velocity of the flow at x y z( , , ) = (10, 0, 0). In (a), ζ = 0y and the body is moving upward. Vorticity contours are linearly
distributed in the ranges ω ∈ [ − 5, 5]z , ω ∈ [ − 4, 4]z and ω ∈ [ − 3, 3]z .
Fig. 8. Spectra of the cross-flow velocity of the flow at x y z( , , ) = (10, 0, 0), in the higher range of U*. In each plot, a red line indicates the vortex shedding frequency in
the static body case (i.e. Strouhal frequency). (For interpretation of the references to color in thisfigure caption, the reader is referred to the web version of this paper.)
the wake is still dominated by the body oscillation frequency, but a small bump appears in the spectrum close to the Strouhal frequency, St=0.21 (Norberg, 1987), indicated by a red line. The Strouhal frequency and the vibration frequency are not commensurable. The contribution of the bump around the Strouhal frequency tends to increase at U* = 12 and, at U* = 14, the vibration and Strouhal frequencies exhibit comparable contributions to the wake spectral content, which confirms the emergence of the desynchronized state in this range of U*.
3.3. Fluid forces
3.3.1. Statistics and spectral analysis
Fig. 9presents the RMS values of the force coefficient in the cross-flow (C ′y) and in-line (C ′x) directions, as well as the
time-averaged in-line force coefficient (Cx), as functions U*. The three branches of response identified inFig. 3can also be noted inFig. 9.
In the static body case, the RMS values of thefluctuating forces in the cross-flow and in-line directions remain small, i.e. close to 0.08 (Norberg, 2003) and 0.03 (Ouvrard et al., 2010; Afgan et al., 2011) respectively. Thefluctuating forces are substantially amplified when the body vibrates. The mean drag also increases in comparison with the static body case, for which the value of Cxis close to 0.9
(Wieselsberger, 1922). The data of J & W have been reported inFig. 9 for comparison purpose. The RMS values of the force coefficients predicted by the simulations match the experimental results. The values of the mean drag tend to be higher in the simulations than in the experiments but the trends of Cxover the lock-in range remain very close.
Thefluctuating drag force coefficient C∼xis analyzed inFig. 10. InFig. 10(a), time series of C
∼
xare plotted for the three values of U*
previously selected (one in each branch of response). The corresponding spectra are shown inFig. 10(b). The frequency content differs from one reduced velocity to the other. At U* = 3, the spectrum is composed of two distinct peaks: a fourth harmonic and a sixth harmonic. A broadband low-frequency content of small amplitude also appears close to f= 2fy, i.e. the frequency at which the in-line oscillation occurs. It should be mentioned that at U* = 3, thefluctuating drag almost vanishes, as shown inFig. 9. The magnitude of the second harmonic component of Cxis very small and the contributions of the other components thus dominate the
spectrum. AtU* = 6 and U* = 9, the second harmonic component clearly dominates the spectrum; a small fourth harmonic contribution can be noted atU* = 6while no higher harmonic components appear at U* = 9. The evolutions of the second (Cx2) and
fourth (Cx4) harmonic amplitudes over the lock-in range are plotted inFig. 10(c). The magnitude of the fourth harmonic component
is significant principally in the upper branch. In this region, the maximum relative contribution of the fourth harmonic with respect to the second harmonic, Cx4/Cx2, is close to 0.15. At U* = 3, this relative contribution is very large (Cx4/Cx2≈ 5.5) as the second
harmonic of the force tends to vanish in this region.
A similar analysis is performed in the cross-flow direction. Time series of the fluctuating lift force coefficientC∼yare plotted in Fig. 11(a), for the three selected values of the reduced velocity and the corresponding spectra are presented inFig. 11(b). In all three
Fig. 9. Forces acting on the body in the range of lock-in, as functions of the reduced velocity: RMS values of the (a) cross-flow and (b) in-line force coefficients; (c) time-averaged in-line force coefficient. The results are compared to the experimental data of J & W.
cases, the spectral content is dominated by thefirst harmonic contribution. However, the presence of a third harmonic peak can also be noted. The existence of higher harmonics, and particularly the possible occurrence of a large third harmonic contribution in the spectrum of the cross-flow force have been reported in previous works (Jauvtis and Williamson, 2004; Vandiver et al., 2009; Dahl et al., 2010). The variations of thefirst (Cy1) and third (Cy3) harmonic amplitudes of the lift force as functions of U*are plotted in
Fig. 11(c). The third harmonic component exhibits large magnitudes in the upper branch. In this region, the relative contribution of the third harmonic with respect to thefirst harmonic may reach 0.4.
In previous works, the presence of higher harmonics in thefluid forcing has been related to several mechanisms. Force higher harmonics may be connected with multi-vortex shedding patterns (e.g. 2T pattern,Dahl et al., 2007). Such wake patterns are not observed in the present results. Higher harmonics may also arise due to the variation of the angle between the x axis and the oncomingflow velocity seen by the body as it oscillates, as discussed byWang et al. (2003)andWu et al. (2012). The low magnitude of the forces at the expected dominant frequencies (Cx2and Cy1), when the body oscillates close to the natural frequency, may
contribute to the large relative magnitudes of the higher harmonics observed inFigs. 10 and 11(Cx4/Cx2andCy3/Cy1, respectively).
This point is addressed hereafter.
Assuming the force and displacement in the i direction to be periodic, both quantities can be expressed as Fourier series
∑
ζi= ζ sin(2πnf t+ϕ ), n in ζ =0 ∞ 1 in (2a)Fig. 10. Fluctuating in-line force coefficient: (a) selected time series and (b) spectrum of C∼x, for three selected values of the reduced velocity; (c) magnitude and
relative contribution of the principal spectral components as functions of U*. In (c), the value of C
C /
∑
Ci= C sin(2πnf t+ϕ ), n in C =0 ∞ 1 in (2b) where f1denotes the frequency of thefirst harmonic component of the cross-flow vibration. Expression(1)leads toϕC −ϕζ = 0° or 180° in in (3) and π ζ f n f C m ϕ ϕ 4 [ − ] = 2 cos( − ). in nat in C ζ 2 2 2 1 2 in in (4)
Expression(4) indicates that the nth harmonic of the force tends to vanish when the frequency of the nth harmonic of the displacement approaches the natural frequency. This contributes to the large values ofCy3/Cy1in the region where the cross-flow oscillation frequency crosses the natural frequency (Fig. 3(c)). In the in-line direction, the oscillation frequency (twice the cross-flow response frequency inFig. 3(c)) is very close to the natural frequency at U* = 3; as expected from(4), the second harmonic of the in-line force coefficient vanishes in this region and the relative contribution of the higher harmonic, C Cx4/ x2, is large (Fig. 10(c)).
The phase difference between the fluid forcing and the body displacement is examined in the following. The instantaneous phase difference in the i direction is expressed as ϕC −ϕζ
i i withϕCi the instantaneous phase of the force determined via the Hilbert
transform.Fig. 12(a) shows the histograms of the instantaneous phase differences for the three selected values of the reduced velocity. The above defined phase difference is only relevant if the force and the displacement occur at the same frequency, viz. a substantial component appears at the oscillation frequency in the force spectrum. If not, the phase difference monotonically varies as
a function of time and no distinct time-averaged value emerges in the histogram. This is the case for ϕC −ϕζ
x xat U* = 3, where the
second harmonic of the in-line force coefficient vanishes. Otherwise, the histograms exhibit sharp shapes centered on well-defined time-averaged values of the phase difference, which are reported inFig. 12(b).
As indicated by expressions(3) and (4), the phase difference between thenthharmonics of force and displacement (0° or 180°), is related to the sign of fnat−nf1. In the in-line direction, the displacement frequency remains lower than the natural frequency, i.e.
fnat − 2f1≤ 0in(4). A phase difference equal to 180° is thus expected between the 2ndharmonics of force and displacement over the
entire range of U*investigated. This is verified inFig. 12(b). In the cross-flow direction, the body oscillation frequency crosses the
natural frequency during the upper-lower branch transition. A phase difference jump from 0° to 180° can be predicted in this region, which is confirmed by the results reported inFig. 12(b).
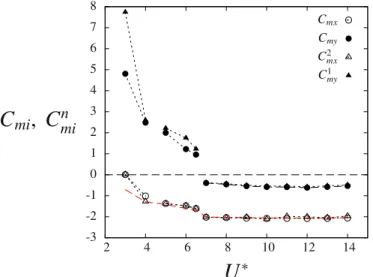
3.3.2. Effective added mass
In the i-direction, the effective added mass coefficient induced by the fluid force in phase with the body acceleration can be defined as follows: C π C ζ ζ = − 2 ¨ ¨ . mi i i i 2 (5) The corresponding values are plotted inFig. 13as functions of the reduced velocity. The added mass coefficients follow the same trend in both directions: they decrease with U*in the initial and upper branches, and are almost constant in the lower branch. However, while the in-line added mass remains negative over the entire range of U*under study, the sign of the cross-flow added
mass changes during the upper-lower branch transition. The partial added mass coefficient obtained by considering only thenth
harmonics of force and displacement in the i direction can be expressed as:
C C ϕ ϕ π n f ζ = cos( − ) 2 . mi n in C ζ in 3 2 1 2 in in (6) In the case of purely sinusoidal displacement occurring at frequency nf1, the effective added mass coefficient verifies Cmi=C
n
mi. The
Fig. 12. Phase differences between force and displacement, in both directions: (a) histograms of the instantaneous phase differences for three selected values of the reduced velocity and (b) time-averaged phase differences as functions of the reduced velocity.
values ofCmx2 andCmy
1 are plotted inFig. 13for comparison purpose. In both directions, the added mass coefficient C
miis generally
close to the sinusoidal case. As shown in(6), assuming periodic force and displacement, the sign of the partial added mass associated with the dominant vibration frequency relates to the force-displacement phase difference at this frequency. This is consistent with the fact that the sign change of the added mass in the cross-flow direction coincides with the phase difference jump of the cross-flow force. Using(6), expression(4)can be written as
nf f m m πC = + 4 . nat mi n 1 (7) Expression(7)emphasizes the link between the body response frequency and the effective added mass; it also provides a relation between the partial added mass coefficients in different directions. For periodic responses, the coefficientsCmx2 andCmy1 verify the
relation C m π C = − 3 + 4 . mx my 2 1 (8) Considering that Cmx≈Cmx2 and Cmy≈Cmy
1, expression(8)provides an approximated relation between C
mxand Cmy, as shown in
Fig. 13where a red dashed line indicates the approximated values of the in-line added mass coefficient. 3.3.3. Energy transfer
The instantaneous energy transfer in the i direction is quantified via the power coefficients
Cei=C ζi i˙ . (9)
In the absence of structural damping, the time-averaged energy transfer vanishes in each direction. However, the instantaneous energy transfer is generally different from zero. The RMS values of the power coefficients are plotted inFig. 14(a). The maximum RMS value is higher in the cross-flow direction than in the in-line direction. The peaks of energy transfer do not appear at the same reduced velocities in both directions. The instantaneous energy transfer induced by thenthharmonics of force and displacement can be measured via the partial power coefficient
Cei=πnf ζ C [sin(ϕ −ϕ ) + sin(4πnf t+ϕ +ϕ )].
n
in in C ζ C ζ
1 in in 1 in in (10)
It should be mentioned that Cn
eidoes not designate thenthharmonic of Cei. In the case of sinusoidal force and displacement at
frequency nf1, Cneiis equal to Cei. As shown by expression(10), thefluctuating energy transfer is expected to occur at twice the
frequency of the body response. Therefore, the phase difference between energy transfer and body displacement can be defined as
ϕCei− 2ϕζi. The values of the time-averaged phase differences in both directions, as functions of the reduced velocity, are reported in
Fig. 14(b). Assuming that Ceiis close to Cnei, the phase difference is approximately equal to ϕCin+ϕζin− 2ϕζin=ϕCin−ϕζin. In the
sinusoidal case, the phase difference between energy transfer and displacement is the same as the phase difference between force and displacement, i.e. 0° or 180°. Comparison ofFigs. 14(b) and12(b) shows that the simulation results corroborate the above analysis, except in the upper branch where the phase difference in the cross-flow direction slightly departs from the expected value (0°); this deviation can be explained by the presence of significant higher harmonic components in the forcing which alter the instantaneous energy transfer, as discussed in the following.
Fig. 13. Effective added mass coefficients, in both directions: evolution of Cmx, Cmy, Cmx2 and Cmy1 as functions of the reduced velocity. The red dashed line indicates
the approximated in-line added mass coefficient given by−3m π/ +Cmy/4. (For interpretation of the references to color in thisfigure caption, the reader is referred to the web version of this paper.)
The spectra of the instantaneous power coefficients in both directions and for the three selected values of U*
are presented in Fig. 15. All the spectra exhibit a peak at twice the body oscillation frequency in the direction being considered, except at U* = 3, where, as previously mentioned, the second harmonic of the in-line force coefficient vanishes. It can be noted that other harmonics with significant amplitudes emerge in the spectra. In the in-line direction, a lower harmonic peak at f= 2fyand a higher harmonic
peak at f= 6fyappear. In the cross-flow direction, a higher harmonic peak arises at f= 4fy; it reaches half the magnitude of the
dominant peak forU* = 6.
The presence of substantial lower/higher harmonics in Cei spectra raises the question of the influence of the force higher
harmonics on the energy transfer. This aspect is addressed by focusing on the effect of the third harmonic of Cy. The instantaneous
energy transfer induced by thefirst and the third harmonics of the cross-flow force can be quantified through the following partial power coefficient (as in(10), a single harmonic of displacement, thefirst harmonic, is considered):
C =πf ζ C sin(ϕ −ϕ ) +πf ζ C sin(4πf t+ϕ +ϕ ) +πf ζ C sin(4πf t+ϕ −ϕ ) +πf ζ C sin(8πf t+ϕ +ϕ ) .
ey y y C ζ y y C ζ y y C ζ y y C ζ
1,3
1 1 1 y1 y1 1 1 1 1 y1 y1 1 1 3 1 y3 y1 1 1 3 1 y3 y1
(11)
Fig. 15. Spectra of the power coefficients in both directions, for three selected values of the reduced velocity. In the spectra of Cey, the symbols indicate the spectral
amplitudes of Cey1(blue triangles) and Cey1,3(orange circles). (For interpretation of the references to color in thisfigure caption, the reader is referred to the web version
of this paper.)
Fig. 14. Instantaneous energy transfer: (a) RMS values of the power coefficients and (b) time-averaged phase differences with the body displacements in both directions as functions of the reduced velocity.
Compared to Cey1,Cey1,3includes two new terms depending on Cy3: afirst one which modifies the second harmonic component of the
energy transfer, and a second one which results in the emergence of a fourth harmonic component. On the basis of the spectral amplitudes and phases of the cross-flow force and displacement, the spectral amplitudes of the energy transfer issued from(10) and (11) are computed and compared to the actual spectra inFig. 15. The amplitudes issued from(11) (orange circles) provide a satisfactory prediction. In particular, the magnitude of the fourth harmonic is well captured, which confirms that this higher harmonic component of the energy transfer is closely related to the third harmonic of Cy. The amplitudes of the second harmonic
predicted via(10)are indicated by blue triangles inFig. 15. Comparison of the blue triangles and the orange circles emphasizes the influence of the third harmonic of Cyon the second harmonic of the energy transfer. At U* = 3 and U* = 9, this influence remains
small. In contrast, the impact of the third harmonic is major atU* = 6: by neglecting this harmonic of the force, the amplitude of energy transfer is dramatically overestimated. Similar observations can be made in the in-line direction where the existence of a fourth harmonic of Cximpacts the spectral component of Cexat f= 4fy, but is also connected to the appearance of a second and a
sixth harmonics in the energy transfer. These examples highlight two effects of the force higher harmonics on the flow-structure energy transfer: (i) the alteration of the spectral component occurring at twice the body oscillation frequency and (ii) the emergence of other (higher or lower) harmonics.
4. Conclusion
The two-degree-of-freedom VIV of a circular cylinder have been studied at Re=3900, on the basis of direct numerical simulation results. It should be recalled that most of the numerical works concerning VIV have been dedicated to lower Reynolds number configurations. A detailed physical analysis of the coupled flow-structure system has been performed over a wide range of the reduced velocity, encompassing the lock-in range. The statistics of the body displacements andfluid forces are in agreement with prior experimental results reported byJauvtis and Williamson (2004) for a comparable system. The present numerical results confirm the occurrence of large-amplitude VIV in both directions in the range of moderate Re, as well as the shape of the response, which is composed of three branches. The body oscillations are close to harmonic and the time-averaged frequency ratio between the in-line and cross-flow motions is equal to 2. The phase difference between the in-line and cross-flow motions varies across the lock-in range; the body tends to exhibit clockwisefigure-eight orbits in the initial and upper branches versus counter-clockwise orbits in the lower branch.
Thefluid forcing was particularly examined, with a special attention paid to its phasing and spectral content. The in-line and cross-flow forces are greatly amplified in comparison with the static body case. A jump of the phase difference between the cross-flow force and displacement is found to occur in the transition region between the upper and lower branches, when the vibration frequency crosses the oscillator natural frequency; this jump is also associated with a sign change of the effective added mass. In contrast, no phase difference jump appears in the in-line direction where the vibration frequency remains larger than the natural frequency and the effective added mass is negative. Higher harmonic components naturally arise in the force spectra once the cylinder oscillates; in both directions, their relative contributions to the forcing may become significant when the body vibrates close to the oscillator natural frequency, i.e. when the amplitude of the force at the vibration frequency tends to vanish. The higher harmonics of the forces are found to directly impact the energy transfer between theflow and the vibrating body: they induce modulations of the dominant spectral component and result in the emergence of other harmonics in the energy transfer spectrum. The results found herein concern a physical system that is considerably simplified compared to those usually encountered in applications, especially in thefields of civil and ocean engineering where VIV often involve slender flexible bodies (e.g. cables, mooring lines) exposed to non-uniformflows. In this context, the structures may exhibit multi-frequency responses, composed of several excited structural wavelengths. Some connections with the presentfindings may however be established, as for instance the amplification of fluid forces or the variability of the effective added mass, which have also been reported for long flexible cylinders (Chaplin et al., 2005; Huera-Huarte et al., 2006; Bourguet et al., 2011). Even in the case of broadband multi-frequency VIV, it was shown that the lock-in phenomenon remains a locally mono-frequency event since the vortex shedding is generally synchronized with a single vibration frequency at each point of the span (Bourguet et al., 2013); the present observations could thus provide insights for the elaboration of semi-empirical models to predict slender body VIV in more complex physical configurations. Acknowledgment
This work was performed using HPC resources from GENCI (grants x20152a7184, c20162a7184). Appendix A. Complements on the impact of structural damping
Previous works have emphasized the effect of structural damping on the response of an elastically mounted cylinder (Khalak and Williamson, 1997b; Klamo et al., 2006); structural damping alters the width of the lock-in range and a very small value of the damping ratio (lower than 1%) may cause a significant reduction of the oscillation amplitude.
In the present simulations, the oscillation amplitudes at high reduced velocities are found to be large compared to the experimental results of J & W (Fig. 3(a)). In order to clarify the influence of structural damping on the body response, the simulations atU* = 6and U* = 14 have been restarted with a low structural damping ratio, ξ = 1%i . The time series of cross-flow
displacement are plotted inFig. 16. AtU* = 6(Fig. 16(a)), the variation of the oscillation amplitude after addition of structural damping is small. At U* = 14 (Fig. 16(b)), the oscillation amplitude before addition of structural damping is approximately equal to
D
0.4 . When the damping is added, the oscillation amplitude starts to decrease. After a few cycles, the oscillation amplitude is lower than0.1D.
This effect of structural damping on the body response amplitude is consistent with the data reported byGopalkrishnan (1993), on the basis of forced oscillation experiments. Infigure 3.14 of his thesis, time-averaged energy transfer contours are plotted in the frequency-amplitude domain. A schematic view of this plot is presented inFig. 16(c). The zero mean energy contour (C = 0ey )
represents the possible states of a freely oscillating body without structural damping. The gradient ofCey close to this contour provides information on the shift that the system will undergo if structural damping is introduced, i.e. forcing the time-averaged energy transfer between theflow and the body to be positive. In particular, the gradient ofCeyin the amplitude direction (ordinate axis of the map) determines the impact of structural damping on the free response amplitude. In a high gradient region, the structural damping is expected to have a limited impact on the response amplitude. In a low gradient region (e.g. high reduced velocity range, viz. low frequency range in the data ofGopalkrishnan (1993)), the structural damping is expected to have a major impact on the response amplitude. This brief analysis may explain the differences observed in the high reduced velocity range between the present results, obtained without structural damping, and the experimental data of J & W, in which the structural damping is small but not negligible (ξexp≈ 0.5%).
References
Afgan, I., Kahil, Y., Benhamadouche, S., Sagaut, P., 2011. Large eddy simulation of theflow around single and two side-by-side cylinders at subcritical Reynolds numbers. Phys. Fluids 23 (7), 075101.
Al-Jamal, H., Dalton, C., 2004. Vortex-induced vibrations using large eddy simulation at a moderate Reynolds number. J. Fluids Struct. 19 (1), 73–92.
Bearman, P.W., 1984. Vortex shedding from oscillating bluff bodies. Annu. Rev. Fluid Mech. 16 (1), 195–222.
Bearman, P.W., 2011. Circular cylinder wakes and vortex-induced vibrations. J. Fluids Struct. 27 (5), 648–658.
Beaudan, P., Moin, P., 1994. Numerical experiments on theflow past a circular cylinder at sub-critical Reynolds number. Technical Report, Department of Mechanical Engineering, Stanford University.
Fig. 16. Effect of structural damping on the cross-flow response of the body: Time series of the cross-flow displacement at (a)U* = 6 and (b) U* = 14 before and after addition of structural damping (ξ = 1%i ) and (c) schematic view of the connection with a map of energy transfer, adapted fromGopalkrishnan (1993).
Blackburn, H.M., Govardhan, R.N., Williamson, C.H.K., 2001. A complementary numerical and physical investigation of vortex-induced vibration. J. Fluids Struct. 15 (3), 481–488.
Bourguet, R., Karniadakis, G.E., Triantafyllou, M.S., 2011. Lock-in of the vortex-induced vibrations of a long tensioned beam in shearflow. J. Fluids Struct. 27 (5), 838–847.
Bourguet, R., Karniadakis, G.E., Triantafyllou, M.S., 2013. Distributed lock-in drives broadband vortex-induced vibrations of a longflexible cylinder in shear flow. J. Fluid Mech. 717, 361–375.
Cagney, N., Balabani, S., 2014. Streamwise vortex-induced vibrations of cylinders with one and two degrees of freedom. J. Fluid Mech. 758, 702–727.
Carberry, J., Sheridan, J., Rockwell, D., 2001. Forces and wake modes of an oscillating cylinder. J. Fluids Struct. 15 (3), 523–532.
Chaplin, J.R., Bearman, P.W., Huera-Huarte, F.J., Pattenden, R.J., 2005. Laboratory measurements of vortex-induced vibrations of a vertical tension riser in a stepped current. J. Fluids Struct. 21 (1), 3–24.
Dahl, J.M., Hover, F.S., Triantafyllou, M.S., Dong, S., Karniadakis, G.E., 2007. Resonant vibrations of bluff bodies cause multivortex shedding and high frequency forces. Phys. Rev. Lett. 99 (14), 144503.
Dahl, J.M., Hover, F.S., Triantafyllou, M.S., Oakley, O.H., 2010. Dual resonance in vortex-induced vibrations at subcritical and supercritical Reynolds numbers. J. Fluid Mech. 643, 395–424.
Feng, C.C., 1968. The measurement of vortex-induced effects in flow past stationary and oscillating circular and D-section cylinders. Master’s thesis, University of British Columbia.
Gopalkrishnan, R., 1993. Vortex-induced forces on oscillating bluff cylinders. Ph.D. thesis, Massachusetts Institute of Technology.
Govardhan, R.N., Williamson, C.H.K., 2000. Modes of vortex formation and frequency response of a freely vibrating cylinder. J. Fluid Mech. 420, 85–130.
Govardhan, R.N., Williamson, C.H.K., 2006. Defining the “modified Griffin plot” in vortex-induced vibration: revealing the effect of Reynolds number using controlled damping. J. Fluid Mech. 561, 147–180.
Grouthier, C., Michelin, S., Bourguet, R., Modarres-Sadeghi, Y., de Langre, E., 2014. On the efficiency of energy harvesting using vortex-induced vibrations of cables. J. Fluids Struct. 49, 427–440.
Hover, F.S., Techet, A.H., Triantafyllou, M.S., 1998. Forces on oscillating uniform and tapered cylinders in crossflow. J. Fluid Mech. 363, 97–114.
Huera-Huarte, F.J., Bearman, P.W., 2009. Wake structures and vortex-induced vibrations of a longflexible cylinder - part 1: dynamic response. J. Fluids Struct. 25 (6), 969–990.
Huera-Huarte, F.J., Bearman, P.W., Chaplin, J.R., 2006. On the force distribution along the axis of aflexible circular cylinder undergoing multi-mode vortex-induced vibrations. J. Fluids Struct. 22 (6), 897–903.
Hunt, J.C.R., Wray, A.A., Moin, P., 1988. Eddies, streams, and convergence zones in turbulentflows. Technical Report S88, Center for Turbulence Research.
Jameson, A., Schmidt, W., Turkel, E., et al., 1981. Numerical solutions of the Euler equations byfinite volume methods using Runge-Kutta time-stepping schemes. AIAA Pap. 1259, 1981.
Jauvtis, N., Williamson, C.H.K., 2004. The effect of two degrees of freedom on vortex-induced vibration at low mass and damping. J. Fluid Mech. 509, 23–62.
Khalak, A., Williamson, C.H.K., 1996. Dynamics of a hydroelastic cylinder with very low mass and damping. J. Fluids Struct. 10 (5), 455–472.
Khalak, A., Williamson, C.H.K., 1997a. Fluid forces and dynamics of a hydroelastic structure with very low mass and damping. J. Fluids Struct. 11 (8), 973–982.
Khalak, A., Williamson, C.H.K., 1997b. Investigation of relative effects of mass and damping in vortex-induced vibration of a circular cylinder. J. Wind Eng. Ind. Aerodyn. 69, 341–350.
Khalak, A., Williamson, C.H.K., 1999. Motions, forces and mode transitions in vortex-induced vibrations at low mass-damping. J. Fluids Struct. 13 (7), 813–851.
Klamo, J.T., Leonard, A., Roshko, A., 2006. The effects of damping on the amplitude and frequency response of a freely vibrating cylinder in cross-flow. J. Fluids Struct. 22 (6), 845–856.
Lee, A.H., Campbell, R.L., Hambric, S.A., 2014. Coupled delayed-detached-eddy simulation and structural vibration of a self-oscillating cylinder due to vortex-shedding. J. Fluids Struct. 48, 216–234.
Leontini, J.S., Thompson, M.C., Hourigan, K., 2006. The beginning of branching behaviour of vortex-induced vibration during two-dimensionalflow. J. Fluids Struct. 22 (6), 857–864.
Liu, C., Zheng, X., Sung, C.H., 1998. Preconditioned multigrid methods for unsteady incompressibleflows. J. Comput. Phys. 139 (1), 35–57.
Lucor, D., Foo, J., Karniadakis, G.E., 2005. Vortex mode selection of a rigid cylinder subject to VIV at low mass-damping. J. Fluids Struct. 20 (4), 483–503.
Mittal, S., Tezduyar, T.E., 1992. Afinite element study of incompressible flows past oscillating cylinders and aerofoils. Int. J. Numer. Methods Fluids 15 (9), 1073–1118.
Moe, G., Wu, Z.-J., 1990. The lift force on a cylinder vibrating in a current. J. Offshore Mech. Arct. Eng. 112 (4), 297–303.
Narendran, K., Murali, K., Sundar, V., 2015. Vortex-induced vibrations of elastically mounted circular cylinder at Re of theO(10 )5. J. Fluids Struct. 54, 503–521.
Navrose, Mittal, S., 2013. Free vibrations of a cylinder: 3- D computations at Re=1000. J. Fluids Struct. 41, 109–118.
Newman, D.J., Karniadakis, G.E., 1997. A direct numerical simulation study offlow past a freely vibrating cable. J. Fluid Mech. 344, 95–136.
Norberg, C., 1987. Effects of Reynolds number and a low-intensity freestream turbulence on the flow around a circular cylinder. Technical Report 2, Chalmers University, Goteborg, Sweden, Technological Publications.
Norberg, C., 2003. Fluctuating lift on a circular cylinder: review and new measurements. J. Fluids Struct. 17 (1), 57–96.
Ouvrard, H., Koobus, B., Dervieux, A., Salvetti, M.V., 2010. Classical and variational multiscale LES of theflow around a circular cylinder on unstructured grids. Comput. Fluids 39 (7), 1083–1094.
Païdoussis, M.P., Price, S.J., de Langre, E., 2010. Fluid–Structure Interactions. Cambridge University Press, Cambridge, UK.
Raghavan, K., Bernitsas, M.M., 2011. Experimental investigation of Reynolds number effect on vortex-induced vibration of rigid circular cylinder on elastic supports. Ocean Eng. 38 (5), 719–731.
Sarkar, A., Schlüter, J., 2013. Numerical investigation of the turbulent energy budget in the wake of freely oscillating elastically mounted cylinder at low reduced velocities. J. Fluids Struct. 43, 441–462.
Sarpkaya, T., 2004. A critical review of the intrinsic nature of vortex-induced vibrations. J. Fluids Struct. 19 (4), 389–447.
Shiels, D., Leonard, A., Roshko, A., 2001. Flow-induced vibration of a circular cylinder at limiting structural parameters. J. Fluids Struct. 15 (1), 3–21.
Vandiver, J.K., Jaiswal, V., Jhingran, V., 2009. Insights on vortex-induced, traveling waves on long risers. J. Fluids Struct. 25 (4), 641–653.
Wang, X.Q., So, R.M.C., Chan, K.T., 2003. A non-linearfluid force model for vortex-induced vibration of an elastic cylinder. J. Sound Vib. 260 (2), 287–305. Wieselsberger, C., 1922. New data on the laws offluid resistance. Technical Report, National Advisory Committee for Aeronautics.
Williamson, C.H.K., Govardhan, R.N., 2004. Vortex-induced vibrations. Annu. Rev. Fluid Mech. 36, 413–455.
Williamson, C.H.K., Roshko, A., 1988. Vortex formation in the wake of an oscillating cylinder. J. Fluids Struct. 2 (4), 355–381.
Wu, X., Ge, F., Hong, Y., 2012. A review of recent studies on vortex-induced vibrations of long slender cylinders. J. Fluids Struct. 28, 292–308.
Zhao, M., Cheng, L., 2011. Numerical simulation of two-degree-of-freedom vortex-induced vibration of a circular cylinder close to a plane boundary. J. Fluids Struct. 27 (7), 1097–1110.
Zhao, M., Cheng, L., An, H., Lu, L., 2014. Three-dimensional numerical simulation of vortex-induced vibration of an elastically mounted rigid circular cylinder in steady current. J. Fluids Struct. 50, 292–311.
![Fig. 1. Three-dimensional wake downstream of a freely vibrating cylinder: instantaneous iso-surface of the Q criterion (Q=0.1) colored by iso-contours of the spanwise vorticity (ω z ∈ [ − 0.85, 0.85] ) in the region of maximum vibration amplitudes ( U* = 6](https://thumb-eu.123doks.com/thumbv2/123doknet/14428248.514657/4.816.134.681.674.986/dimensional-downstream-vibrating-instantaneous-criterion-vorticity-vibration-amplitudes.webp)