HAL Id: hal-02296648
https://hal.archives-ouvertes.fr/hal-02296648
Submitted on 25 Sep 2019HAL is a multi-disciplinary open access archive for the deposit and dissemination of sci-entific research documents, whether they are pub-lished or not. The documents may come from teaching and research institutions in France or
L’archive ouverte pluridisciplinaire HAL, est destinée au dépôt et à la diffusion de documents scientifiques de niveau recherche, publiés ou non, émanant des établissements d’enseignement et de recherche français ou étrangers, des laboratoires
Accounting for ocean connectivity and hydroclimate in
fish recruitment fluctuations within transboundary
metapopulations
Manuel Hidalgo, Vincent Rossi, Pedro Monroy, Enrico Ser-giacomi, Emilio
Hernández-garcía, Beatriz Guijarro, Enric Massutí, Francisco Alemany,
Angelique Jadaud, José Luis Perez, et al.
To cite this version:
Manuel Hidalgo, Vincent Rossi, Pedro Monroy, Enrico Ser-giacomi, Emilio Hernández-garcía, et al.. Accounting for ocean connectivity and hydroclimate in fish recruitment fluctuations within trans-boundary metapopulations. Ecological Applications, Ecological Society of America, 2019, 29 (5), pp.e01913. �10.1002/eap.1913�. �hal-02296648�
Article type: Article
12
Running head: Connectivity in large fish stocks
34
Accounting for ocean connectivity and hydroclimate in fish
5
recruitment fluctuations within transboundary metapopulations
6 7 8
Manuel Hidalgo1,2,*, Vincent Rossi3,4,*, Pedro Monroy3, Enrico Ser-Giacomi3,5, Emilio 9
Hernández-García3, Beatriz Guijarro1, Enric Massutí1, Francisco Alemany1, Angelique 10
Jadaud6, José Luis Perez2, Patricia Reglero1 11
12 13
1Instituto Español de Oceanografía, Centre Oceanogràfic de les Balears, Moll de Ponent s/n, 07015 14
Palma, Spain. 15
2Instituto Español de Oceanografía, Centro Oceanográfico de Málaga, Muelle Pesquero s/n, 29640, 16
Fuengirola (Málaga), Spain. 17
3Institute for Cross-Disciplinary Physics and Complex Systems (IFISC), CSIC-UIB, Palma de 18
Mallorca 07122, Spain. 19
4Mediterranean Institute of Oceanography (MIO, UM 110, UMR 7294), CNRS, Aix Marseille Univ., 20
Univ. Toulon, IRD, 13288 Marseille, France. 21
5Institut de Biologie de l’École Normale Supérieure (IBENS), Ecole Normale Supérieure, PSL 22
Research University, CNRS, Inserm, Paris 75005, France. 23
6IFREMER, Institut Français de Recherche pour l’Exploitation de la mer, UMR 212 Ecosystèmes 24
Marins Exploités (EME), Sète, France 25
* Equal contribution to the paper. Correspondence should be addressed to both:[email protected] 27 [email protected] 28 29
Abstract
30Marine resources stewardships are progressively becoming more receptive to an
31
effective incorporation of both ecosystem and environmental complexities into the
32
analytical frameworks of fisheries assessment. Understanding and predicting marine
33
fish production for spatially and demographically complex populations in changing
34
environmental conditions is however still a difficult task. Indeed, fisheries assessment
35
is mostly based on deterministic models that lack realistic parameterizations of the
36
intricate biological and physical processes shaping recruitment, a cornerstone in
37
population dynamics. We use here a large metapopulation of a harvested fish, the
38
European hake (Merluccius merluccius), managed across transnational boundaries in
39
the northwestern Mediterranean, to model fish recruitment dynamics in terms of
40
physics-dependent drivers related to dispersal and survival. The connectivity among
41
nearby subpopulations is evaluated by simulating multi-annual Lagrangian indices of
42
larval retention, imports and self-recruitment. Along with a proxy of the regional
43
hydroclimate influencing early-life stages survival, we then statistically determine the
44
relative contribution of dispersal and hydroclimate for recruitment across contiguous
45
management units. We show that inter-annual variability of recruitment is well
46
reproduced by hydroclimatic influences and synthetic connectivity estimates.
Self-47
recruitment (i.e. the ratio of retained locally-produced larvae to the total number of
48
incoming larvae) is the most powerful metric as it integrates the roles of retained local
49
recruits and immigrants from surrounding subpopulations and is able to capture
50
circulation patterns affecting recruitment at the scale of management units. We also
due to contrasting biophysical processes not related to dispersal. Self-recruitment
53
calculated for each subpopulation explains between 19% and 32.9% of the variance of
54
recruitment variability, that is much larger than the one explained by spawning stock
55
biomass alone, supporting an increase of consideration of connectivity processes into
56
stocks assessment. By acknowledging the structural and ecological complexity of
57
marine populations, this study provides the scientific basis to link spatial management
58
and temporal assessment within large marine metapopulations. Our results suggest
59
that fisheries management could be improved by combining information of physical
60
oceanography (from observing systems and operational models), opening new
61
opportunities such as the development of short-term projections and dynamic spatial
62 management. 63 64 Key words 65
Ecosystem-based management, fish recruitment, fisheries conservation, hydroclimate
66
variability, metapopulations, ocean connectivity, self-recruitment
I
NTRODUCTION68
Understanding the complex dynamics of large marine fish stocks is one of the most
69
pressing challenges for fisheries science, as it is the fundamental basis to improve the
70
reliability of future projections of fish production (Cheung et al. 2013) and since
71
species shift their distributions due to climate change, increasing the number of
72
transboundary stocks (Pinsky et al. 2018). Besides, there is a general acceptance that
73
the spatial and demographic structure of marine populations is more complex than
74
currently accounted for in assessment and management frameworks (e.g., Stephenson
75
et al. 2009; Kerr et al. 2017). Indeed, marine populations are often structured as a
76
metapopulation, that is, a set of sub-populations connected through the exchange of
77
individuals (Carson et al. 2011; Castorani et al. 2015) and whose spatial boundaries
78
rarely coincide with management units (Kerr et al. 2017). This limitation comes along
79
the contemporary challenge in fisheries assessment and management of making the
80
best use of physical predictions (from earth-system models up to high-resolution
bio-81
physical ocean models) to include them in the short-term projections of abundance of
82
fish stocks (Hinrichsen et al. 2011). Despite a recent expansion of spatially-explicit
83
fish stock assessment procedures to cope with the populations’ complexity (e.g.,
84
adults movement, Goethel et al. 2011), they still overlook the dynamics of early-life
85
stages potentially connecting subpopulations. Apart from those species whose adults
86
migrate substantially (Frisk et al. 2014), connectivity is largely driven by physical
87
dispersion due to multi-scale oceanic currents (Cowen et al. 2009), and has a
88
profound impact on fish recruitment success and fish population dynamics (Botsford
89
et al. 2009; Harrison et al. 2012; Huwer et al. 2016).
90
Recruitment success (i.e., survival of progeny that enters a population in a
91
given year) is a pivotal ecological process in fisheries ecology that relates quantitative
observations of young fish to a measure of spawning potential (stock-recruitment
93
relationships). Most of the fish recruitment research is still co-opted by contemporary
94
topics such as assessing the effects of global changes on marine ecosystems and
95
fisheries by exploring how large-scale climatic variability influences key ecological
96
processes like survival (Rice and Browman 2014). Most of these studies, however, do
97
not take into account the stochastic and fine-scale structures of the seascape, which
98
shape both larval dispersal and survival resulting in ‘realized’ connective pathways
99
(Carson et al. 2011). Incorporating realistic larval dispersal schemes into population
100
dynamics and fisheries studies could improve our comprehension of population
101
structuring and its temporal variability (Castorani et al. 2015). By embracing
102
simultaneously connectivity and environmental processes, we test here whether the
103
combination of high-resolution connectivity patterns with climate influences and
104
biological factors improves our capability of reproducing fish recruitment dynamics in
105
a ubiquitous harvested nektobenthic species.
106
Empirical studies in the prominent field of ocean connectivity have largely
107
concentrated on small-scales, particularly for the spatial design of Marine Protected
108
Areas (MPAs) networks in coastal and coral-reef seascapes (e.g., Botsford et al. 2009;
109
Almany et al. 2017). Recent large-scale modeling studies linked connectivity, MPAs
110
and fishery sciences (Botsford et al. 2009; Dubois et al. 2016; Krueck et al. 2017) but
111
they remained eminently theoretical and they mainly focused on the implications for
112
spatial management at transnational scale and long dispersal organisms (e.g., Kough
113
et al. 2013; Andrello et al. 2017). However, they did not explore, nor provide
114
observational evidence of, how connectivity temporally affects fishery assessment
115
exercises. Indeed, the effects of broad-scale connectivity on the spatio-temporal
116
population dynamics of large populations has received little attention (Hidalgo et al.
2017), mostly focused on nearshore systems, or sedentary and benthic species with
118
reduced mobility (Siegel et al. 2008; Carson et al. 2011; Watson et al. 2012; Rochette
119
et al. 2013; Castorani et al. 2015). In the meantime, numerical models are becoming
120
mature enough to study the influence of environmental variability on recruitment
121
success, to improve stock management frameworks (Hinrichsen et al. 2011), as well
122
as to explore the spatio-temporal variability of larval connectivity over several years
123
(e.g., Ospina-Alvarez et al. 2015). Daewel et al. (2015) recently documented a
124
relative predictive ability of modeled larval survival for observed cod recruitment in
125
the North Sea, but their entire time-series were not significantly correlated due to
non-126
resolved trophic interactions. Simulated multi-annual connectivity estimates have
127
been indirectly interpreted in the context of fisheries (e.g., Huwer et al. 2016;
128
Andrello et al. 2017) but, to our knowledge, there is no report of significant and
129
coherent relationship between modeled connectivity proxies and observed population
130
estimates (e.g., assessment outputs of segregated stocks). Many biophysical models
131
are being developed by the community to address this challenge but they often use
132
different formulations and they generate various connectivity indices, which are not
133
necessarily harmonized or inter-comparable. Nevertheless, most recent research
134
suggest that the mechanistic and deterministic models currently used in fisheries
135
assessment can be substantially improved by including realistic information of
136
physical processes related with both larval dispersal and survival.
137
The reliability of fish assessment and management strategies are often
138
questioned worldwide because of the mismatch between biological and management
139
scales (Kerr et al. 2017). In the Mediterranean Sea, this has been recently challenged
140
as a priority to ensure sustainability of assessed fish stocks (Fiorentino et al. 2014), of
141
which more than 90% are in overexploitation state (Fernandes et al. 2017). This urges
for effective measures and population dynamics modeling that realistically capture the
143
ecological complexity of harvested populations. Focusing on the European hake
144
(Merluccius merluccius), which is the most overexploited nektobenthic species of the
145
Mediterranean Sea, the present study aims at addressing the following specific
146
objectives. First, we assess the potential larval connectivity within and among six
147
discrete subpopulations of hake in the Western Mediterranean. Second, we evaluate
148
whether the connectivity estimates help to explain the temporal dynamics of
149
recruitment and survival (i.e., the rate of individuals that survived from birth to the
150
age of recruitment) in three contiguous geographical areas (hereafter referred to as
151
“management areas”) that currently frame independent assessment procedures for this 152
species. By combining ocean circulation models, time-series of regional climate and
153
biological variables, we model the spatiotemporal dynamics of hake recruitment. We
154
then quantify the relative influence of the regional circulation-driven dispersal and the
155
hydroclimate as selective forces shaping recruitment and survival across the
156
metapopulation sub-units. Our results are discussed to question whether connectivity
157
estimates provided by ocean models are able to effectively capture the temporal
158
dynamics of key biophysical processes shaping fish recruitment and how they can
159
improve the ecological basis of fisheries assessment and management.
160 161
M
ATERIALS ANDM
ETHODS162
Metapopulation system
163
This work focuses on the northwestern Mediterranean metapopulation of European
164
hake (Merluccius merluccius), an exploited nekton-benthic species of high economic
165
value. The study system is structured by recognized physical and environmental
166
recognized boundaries, and the phenology of key ecological processes such as
spawning and recruitment. On the southern border, the Almeria-Oran front represents
168
a physical barrier of transport by ocean currents, which confines the population
169
structure and act as a gene-flow barrier for many marine species (Galarza et al. 2009).
170
In addition, the recruitment of hake in the south-western Mediterranean occurs in
171
autumn whereas it peaks in late winter / early spring in the study area (Rey & Gil de
172
Sola 2004; Recasens et al. 2008). In the north-east, the spawning phenology of hake
173
in the Ligurian and Thyrrenian seas is seasonally opposed to that in the Gulf of Lion,
174
off the Iberian Peninsula and around the Balearic Islands which occurs in autumn
175
(Recasens et al. 2008, Hidalgo et al. 2009). Altogether, this allows us to simplify our
176
metapopulation to six distinct eco-regions consistent with recent studies (Hidalgo et
177
al. 2009; Puerta et al. 2016): Gulf of Lion, Catalan coast, Ebro delta, Valencia gulf,
178
Northern and Southern Balearic Islands (Fig. 1). This structure of the metapopulation
179
system implies that all larvae ending their dispersal phase outside of these regions are
180
considered lost. Similarly, it presupposes that the potential arrival of dispersed larvae
181
from other hake metapopulations is very unlikely and the effect minimal.
182
From now on and in the entire paper, we assumed that each of these
eco-183
regions constitutes a metapopulation subunit. That is, a subpopulation of hake sensu
184
stricto as defined by Cowen et al. (2009) ‘a set of individuals that live in the same
185
habitat patch and interact with each other’. We use consistently the term 186
‘subpopulation’ throughout this study for clarity purpose while alternative semantic 187
choices and their scientific implications are further discussed in the light of our
188
results. Our six hypothesized subpopulations correspond to three of the thirty current
189
geographic subareas (GSAs, grey contours on Fig. 1), currently used for assessment
190
and management purposes in the General Fisheries Commission for the
191
Mediterranean (GFCM,
subareas/es/): Gulf of Lion (GSA-7), Iberian Peninsula (which includes Catalan coast,
193
Ebro Delta and Valencia gulf subpopulations; GSA-6) and the Balearic Islands
194
(encompassing both northern and southern Balearic subpopulations; GSA-5). We use
195
consistently the term ‘management unit’ to refer to these areas in this study. 196
197
Lagrangian Flow Network and connectivity metrics
198
We evaluate the dispersion of hake´s larvae among those six subpopulations using the
199
Lagrangian Flow Network (LFN) methodology that has been inspired from Network
200
Theory and Dynamical systems perspectives (Ser-Giacomi et al. 2015). This
201
framework has been applied to depict connectivity patterns within the entire
202
Mediterranean basin (Rossi et al. 2014, Dubois et al. 2016). The oceanic surface is
203
subdivided in thousands of equal-area rectangular sub-regions that serve as nodes
204
(small boxes in Fig. 1) in our transport network. These nodes, equivalent of discrete
205
habitat patches, are interconnected by weighted and directed links that represent,
206
using the most adequate numerical and biological parameters (Monroy et al. 2017),
207
passive transport of hake’s propagules (eggs and larvae) by ocean currents. Those
208
links are orientated by the oceanic flow and are weighted proportionally to the
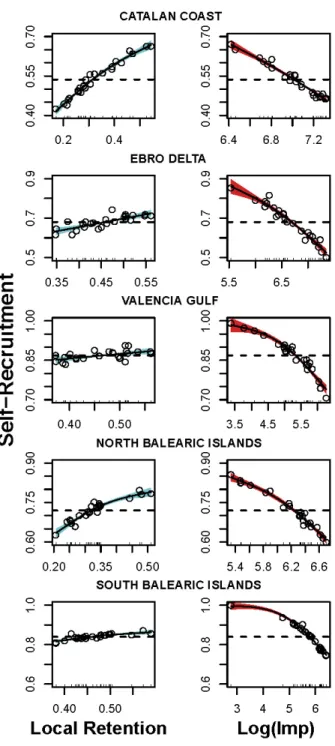
209
normalized larval fluxes occurring over the entire period of the pelagic phase. To
210
characterize such links, Lagrangian particle trajectories are computed by integrating
211
the horizontal (2-dimensional) flow field generated by an eddy-resolving
212
hydrodynamical model implemented at 1/16°horizontal resolution in the
213
Mediterranean over years 1987-2011 (Oddo et al. 2009). 100 particles were seeded
214
evenly in each node of 1/8° width (this means releasing about 1 particle per km2) at a
215
fixed subsurface layer. We retained here the layer at 90 m depth, where hake larvae
216
have been mostly observed (Olivar et al. 2003). The Pelagic Larval Duration (PLD)
simulated is 40 days (Hidalgo et al. 2009). We considered repeated spawning events
218
each year during the main autumnal spawning period of the species with seven
219
starting times (15 days apart) from September, 1stto November, 30th(Hidalgo et al.
220
2009). We also performed additional sensitivity tests to further support the robustness
221
of our conclusions (see below and Appendix S1).
222
From several millions of virtual trajectories representing the transport of
free-223
swimming propagules, LFN builds high-resolution connectivity matrices between all
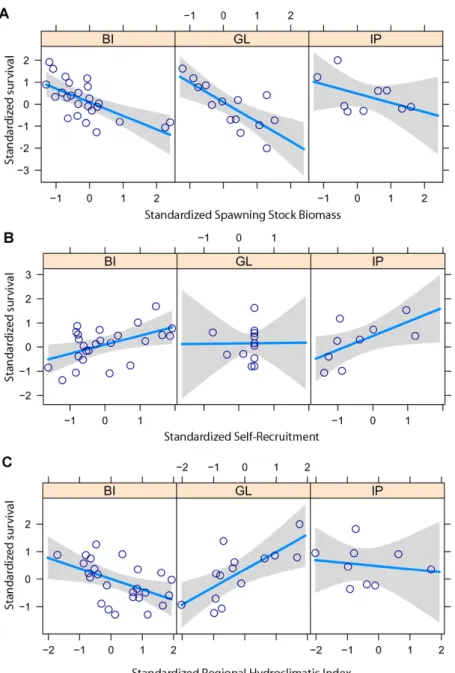
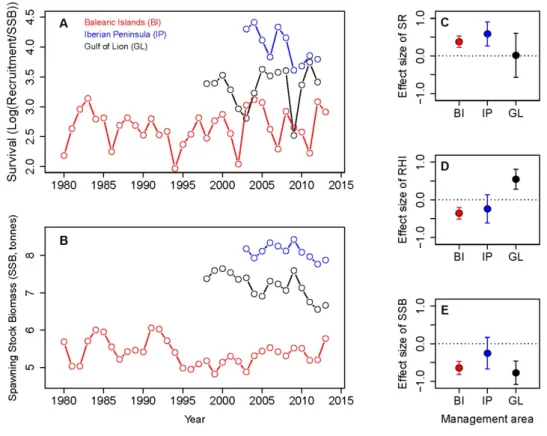
224
possible origin and destination nodes (i.e., for each node, it stores the numbers and
225
weights of all links emanating from it and entering it) of the region under study.
226
Matrices are post-processed to discard specific sites (through an adequate selection of
227
nodes) and to vary the scales of interest (through the grouping of selected nodes)
228
without the need to re-compute any trajectory. In particular, we consider as
229
origin/destination sites only those with preferential habitats of hake (e.g., nodes
230
inshore the 300 m isobath). Within those nodes, local larval release and success of
231
recruitment are homogeneous; they are null in the remaining nodes. Overall, 175
232
numerical experiments (7 spawning events per year over 25 years) generate 175
233
connectivity matrices that are then further analyzed to compute metrics, which
234
measure larval retention and directional exchanges applying formulations derived
235
from population dynamics concepts (Dubois et al. 2016). We assume that recruitment
236
of a given subpopulation is at primary controlled by locally-produced larvae and the
237
immigration of distantly-released larvae. Consequently, the three complementary
238
connectivity metrics exploited here are: Import, Local Retention and
Self-239
Recruitment. Import (Imp) is the total number of incoming larvae from all origins
240
(produced elsewhere only). Local Retention (LR) is the proportion of locally
241
produced larvae that are locally retained. Self-Recruitment (SR) is the ratio of locally
produced larvae retained in each area to the total number of incoming larvae
243
(including those produced locally). In this respect, LR is only a local measure whereas
244
SR encompasses information of both local (LR) and remote directional influences
245
(Imp). LR and SR relate to the self-persistence of a given subpopulation while Imp
246
and SR evaluate the network-persistence of the whole metapopulation (Castorani et
247
al. 2015; Dubois et al. 2016). Imp is expressed in absolute number of particles and,
248
LR and SR are probabilities with values between 0 and 1 (0 indicates no retention).
249
While some authors suggested that SR can be a good predictor of LR under certain
250
conditions (e.g. Lett et al. 2015), Dubois et al. (2016) generalized the formulations of
251
these connectivity estimates applied to larval transport and showed that the relative
252
difference between LR and SR provides insight into the source or sink behavior of the
253
subpopulation of interest. We report here the annual averages of these three
254
connectivity metrics with associated uncertainties (standard deviations), calculated
255
among the successive spawning events within the main reproductive season.
256
The sensitivity and robustness of those connectivity metrics to the most
257
relevant parameters of the LFN were extensively assessed (Dubois et al. 2016;
258
Monroy et al. 2017) (Appendix S1). In order to compare modeled connectivity
259
estimates with fisheries assessment outputs (see below), we calculated the metrics at
260
two hierarchical scales: for the six aforementioned subpopulations of hake and at the
261
scale of the three regional management units described previously. This lets us
262
evaluate i) which is the best connectivity metric to reproduce the fisheries assessment
263
estimates and ii) at which spatial scale (subpopulation or management unit) the impact
264
of larval retention and exchange is better captured.
265 266
Statistical approach
Prior to the modeling of fisheries-based information, we first assessed the
268
relative contribution of LR and Imp on SR, applying General Additive Modeling
269
(GAMs) on SR as response variable and LR and log(Imp) as non-linear covariates.
270
We then statistically assessed and quantified the impact of our
physical-271
dependent drivers on recruitment and survival (i.e., the ratio of recruitment at time t to
272
the spawners biomass at time t-1), which were obtained from GFCM fisheries
273
assessment groups of the three corresponding management areas that take into
274
account information from scientific bottom trawl surveys (SAC-GFCM 2015). As
275
physical covariates, we investigated the potential linear effects of the simulated
276
connectivity metrics (LR, SR and log(Imp)) along with the Regional Hydroclimatic
277
Index (RHI) that can capture biophysical processes not related to dispersal.
278
Connectivity estimates included in the models were calculated at both
279
“subpopulation” and “management unit” levels to assess the spatial scale at which 280
including connectivity maximizes models’ performance (Metadata S1, Data S1). RHI
281
is calculated attending to air-sea heat exchange anomalies in the northwestern
282
Mediterranean, and has been related to the inter-annual variability of intermediate
283
water mass formation in winter in the Western Mediterranean (Monserrat et al. 2008).
284
Negative values of this index are associated to higher formation rate of winter
285
intermediate water mass, which influences the seasonal surface circulation patterns
286
resulting in greater regional primary production than average (Balbín et al. 2014),
287
with a positive impact on the recruitment success of hake in the Balearic Islands
288
(Massutí et al. 2008). While it suggests that the RHI captures biophysical processes
289
mainly related to early life stages survival, it is not yet clear if and how they could be
290
related to dispersal.
Besides physical drivers, we also accounted for density-dependent regulation
292
in our statistical modeling. In the case of recruitment, we included the potential
non-293
linear effect of Spawning Stock Biomass (SSB) applying a GAM framework (Hidalgo
294
et al. 2012). If the density-dependent effect was not significant, the model resulted in
295
a Linear Model. In the case of survival, we used the classic Ricker model extended to
296
environmental drivers, Rt= a0SSBt-1e-b SSBt-1+∑ciPi,teɛt, applying its transformation to a 297
Linear Model, log(Rt/SSBt-1) = log(a0) – b SSBt-1+ ∑ciPi,t+ɛt, where Rtis the 298
recruitment (age-0) at year t and log(Rt/SSBt-1) the survival, SSBt-1the spawning 299
abundance at year t-1, Pi,trepresent a vector of the i physical drivers, a0, b and ciare 300
the estimated parameters, and ɛtthe error term. 301
To account for the temporal lag induced by the successive spawning, dispersal,
302
settlement and finally recruitment process, connectivity metrics of year t were
303
regressed against fisheries assessment variables of year t+1. To test whether density
304
dependence influences recruitment survival at larger spatial scales than expected in
305
the meta-population, spawning biomasses of contiguous management areas were
306
combined. Given that the length of the time-series of fisheries assessment variables
307
differs among areas, a final model with three, two and one covariate(s) were
308
considered for the Balearic Islands, Gulf of Lion and the Iberian Peninsula,
309
respectively.
310
Prior statistical analyses, absence of correlation and collinearity among physical
311
and biological covariates was confirmed by applying, respectively, Spearman
312
correlations and the variance inflation factor test (Zuur et al. 2009). The best model
313
was obtained by minimizing the Akaike Information Criterion (AIC). For every
314
model, residuals were checked for variance homogeneity and absence of temporal
315
autocorrelation applying the auto-correlation function (acf). To quantify the benefits
of considering connectivity and climate proxies to model fish recruitment, we
317
compare the percentage of Deviance Explained of models including those metrics
318
with the standard models based solely on SSB. Once the best model was obtained for
319
each management area, all time-series were normalized to mean 0 and variance 1 and
320
pooled in a unique and centered (i.e., intercept equals 0) linear model to compare the
321
size (slope) of each effect (connectivity, hydroclimate and spawning stock) for each
322 management area. 323 324
R
ESULTS 325 Connectivity estimates 326Larval exchanges simulated by the Lagrangian Flow Network (LFN) among the 6
327
discrete subpopulations of hake suggest that the subsurface circulation in the
328
northwestern Mediterranean, dominated by the Liguro-Provencal-Catalan current,
329
drives a southwestward directional pattern of connectivity (Fig. 1). The Gulf of Lion
330
is thus the main source of particles Import (Imp) into the Iberian Peninsula. While this
331
southwestward connectivity prevails in all 25 years under study (see the annual mean
332
patterns of connectivity over 1987-2011 in Appendix S2: Fig. S1), two distinct
333
scenarios can be distinguished. The first connectivity pattern consists in a
334
southwestward flux to the mainland, with a weak or null transport towards the
335
Balearic Islands (Fig. 1a). The second one reveals a reduced transport towards the
336
Iberian Peninsula shelf and an eastward retroflection of the main transport pathways,
337
resulting in stronger connections with the Balearic Archipelago (Fig. 1b). Larval
338
Local Retention (LR) also displays consequent spatiotemporal variability, which
339
seems less prominent than the changes of directional connectivity patterns (Fig. 1;
340
Appendix S2: Fig. S1). The lowest LR values occur over the narrow shelves of the
Catalan coast (0.32±0.1) and the northern Balearic Islands (0.33±0.07). In contrast,
342
relatively extended continental shelves tend to favor retention rates: the Gulf of Lion
343
has intermediate LR (0.42±0.07), while the highest LR values are obtained for the
344
Ebro delta (0.46±0.06), the Valencia channel (0.47±0.06) and the southern Balearic
345
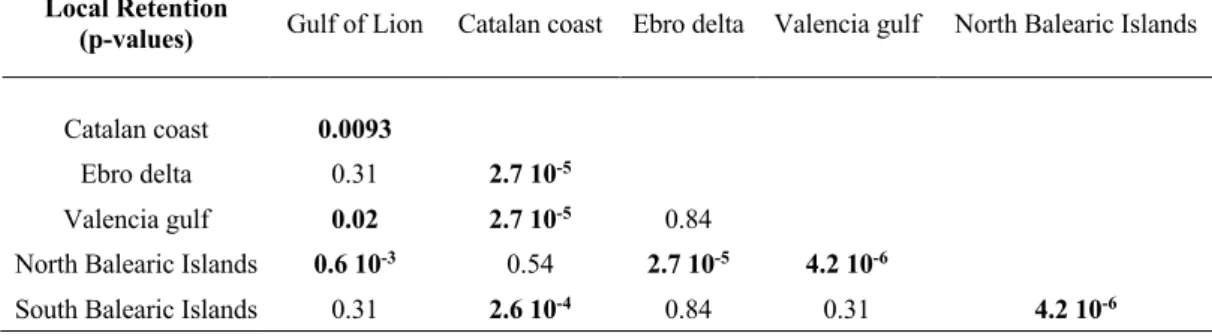
Islands (0.47±0.05) (see pair-wise comparisons in Appendix S2: Table S1).
346
The high variability of ocean currents is reflected in all modeled connectivity
347
metrics; Imp (not shown), LR and Self-Recruitment (SR) displayed consistent
inter-348
annual (Fig. 2a) and geographical variations (Appendix S2: Fig. S1, S2). The relative
349
position of a given cloud of points in the scatter plot LR versus SR (Fig. 2b) illustrates
350
the different contributions of retention (LR) and exchange (Imp) processes in each
351
subpopulation. In this sense, SR results in a synthetic index that integrates both local
352
and distant connectivity processes. The inter-annual variability of SR is more
353
dependent on Imp in the Ebro Delta, the Gulf of Valencia and the southern Balearic
354
Islands (Fig 2b and Appendix S2: Fig. S1, S2). In contrast, both the Catalan coast and
355
the northern Balearic Islands show a more even contribution of LR and Imp
356
variability on SR (Fig 2b and Appendix S2: Fig. S2). Overall, the whole
meta-357
population shows a balanced contribution of LR and Imp on SR, with relatively high
358
SR at moderate LR. Following Dubois et al. (2016), who showed that the greater
359
deviation between SR and LR, the more pronounced is the source or sink behavior, it
360
indicates that the 6 subpopulations mostly behave as sources in which larval export
361
dominates import (Fig. 2b). This further suggests a dynamical system in which both
362
self-replenishment and exchanges among distant sub-populations (i.e., network
363
persistence) play key roles in controlling its connectivity. While the inter-annual
364
variability of SR is elevated, reflecting the variations of both LR and Imp, means of
365
SR for each subpopulation still show significant geographic discrepancies: high in the
southern Balearic Islands (0.84±0.07) and Gulf of Valencia (0.87±0.06), medium in
367
the Ebro delta (0.68±0.1) and northern Balearic Islands (0.72±0.09), and relatively
368
low in the Catalan coast (0.53±0.1) (Fig. 2b; see also pair-wise comparisons in
369
Appendix S2: Table S2). Note that SR in the Gulf of Lion is always close to 1
370
(0.99±0.003), demonstrating it is mostly influenced by local processes (LR) as Imp is
371
very weak or null due to the dominant south-westward directional connectivity and its
372
positioning on the north-eastern boundary of our simplified meta-population system.
373
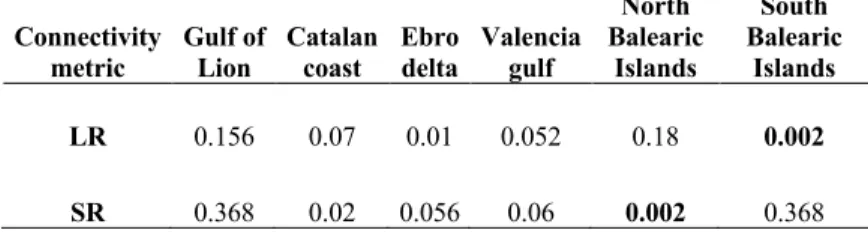
We also evaluated LR and Import contribution to SR variability for the 3
374
corresponding management-units to match the scale used in fisheries assessment
375
procedures (Fig. 3). The Iberian Peninsula shows that the rate of change of SR is
376
similar to the positive effect of LR and the negative one of Imp. The LR and Imp
377
components in SR variability for the Gulf of Lion are similar to those corresponding
378
presented above and computed at the scale of “subpopulation”. The Balearic
379
archipelago exhibits a connectivity behavior close to the one of the southern Balearic
380
Islands with SR variability mostly controlled by Imp (Fig. 3 and Appendix S2: Fig.
381
S2). This suggests that the local influence of LR inter-annual variability in the
382
northern Balearic Islands becomes negligible in comparison with the growing external
383
influences when the scale of study accounts for the whole management area.
384
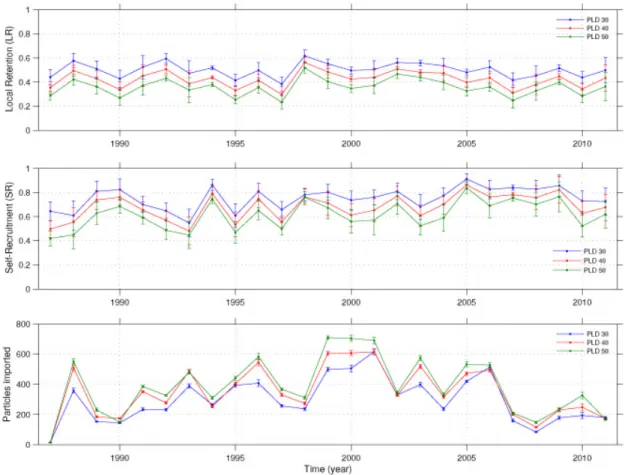
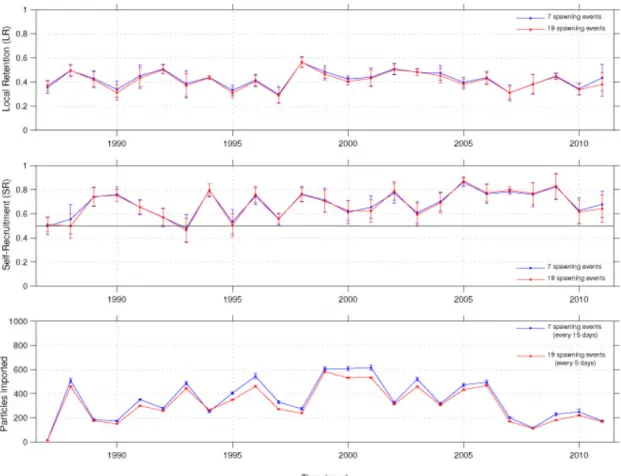
Sensitivity tests performed at both levels of analyses (6 subpopulations and 3
385
management units) reveal that our connectivity metrics and their inter-annual
386
variability are robust to variations of the three critical parameters (Appendix S1:
387
pelagic larval duration, Fig. S1; spawning frequency, Fig. S2; and dispersal depths,
388 Table S1 and S2). 389 390 Recruitment dynamics 391
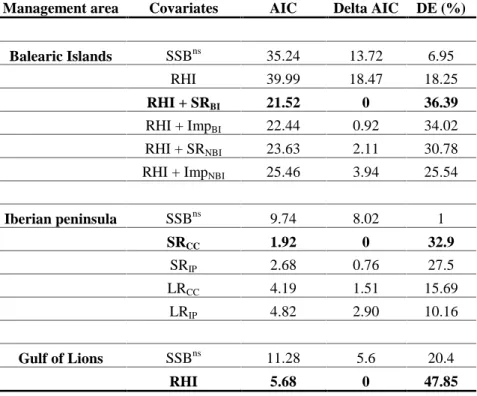
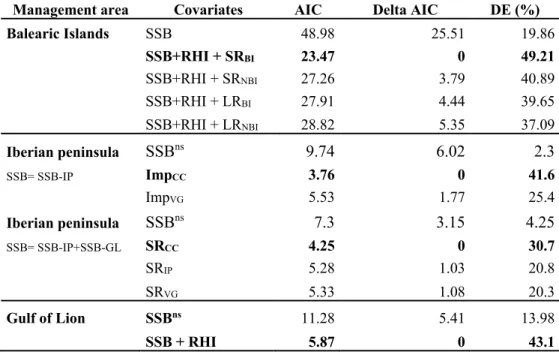
The best statistical model of recruitment for each management unit reveals the
392
influence of SR and RHI as the most relevant drivers (Tab. 1). SSB was not
393
significant in all models in which its effect was considered, including those in which
394
SSB was the unique covariate (Tab. 1). There was a considerable increase of the
395
Deviance Explained (DE) from models exclusively based on SSB to the best models
396
obtained for each management area (from 27.3% in the Gulf of Lions to 36.2% in the
397
Balearic Islands, Tab. 1). An increase of 21.3% of DE was observed in the model of
398
Balearic Islands including RHI and SR from the model exclusively based on RHI.
399
Besides the minimization of AIC, DE of models including SR were between 2.7 %
400
and 7.6% higher compared to those including the other connectivity metrics tested
401
here, that is LR or IMP (Tab. 1).
402
As SR and RHI effects were linear and the most representative in all
403
management areas (Fig. 4a), they were standardized in a unique model for the whole
404
metapopulation (DE = 37.6 %; Appendix S3: Fig. S1) to compare these effects across
405
areas. SR is a significant variable influencing the recruitment in both the Iberian
406
Peninsula and the Balearic Islands with a similar effect size (i.e., slope, Fig. 4b).
407
However, in the model for the Iberian Peninsula management unit, SR calculated in
408
the Catalan coast subpopulation emerges as the most relevant SR metric. For the
409
Balearic Islands case, the most relevant SR metric turns out to be SR calculated at the
410
management unit level (Tab. 1). None of our connectivity metrics was a significant
411
predictor of recruitment in the Gulf of Lion. However, for the RHI, a clear directional
412
change is observed from a negative significant effect on recruitment in the Balearic
413
Islands (i.e., recruitment is favored under negative values of RHI) to a positive
414
significant effect in the Gulf of Lion, and no effect observed in the Iberian Peninsula
(Fig. 4c). The size of RHI effects were of the same order as those of SR (Figs. 4b and
416
4c).
417
The models applied to the recruitment survival (linearized Ricker model)
418
return results that are consistent with the best models found for recruitment, including
419
a negative effect of spawners’ biomass (i.e., density dependence) of similar strength 420
for the Balearic Islands and the Gulf of Lion (Appendix S3: Table S1, Fig. S2 and
421
Fig. S3; DE = 38.1 %). Concerning the Spanish mainland, although density
422
dependence was not included in the best model, the effect of SR in the Catalan coast
423
was only observed when the survival combines the density dependence of two
424
contiguous management areas (Spanish mainland and Gulf of Lion; Appendix S3:
425 Table S2). 426 427
D
ISCUSSION 428Our study demonstrates that, making reasonable assumptions, the inter-annual
429
variability of recruitment of large fish stocks can be modeled incorporating
physics-430
dependent drivers related to dispersal and survival: the spatiotemporal connectivity
431
estimates derived from a high-resolution circulation model and an index capturing the
432
temporal variability of the regional hydroclimate. While nearshore connectivity is
433
sometimes suggested to be heterogeneous on short time-scales due to stochastic
434
transport of pelagic larvae (Siegel et al. 2008; Watson et al. 2012), and although
435
basin-scale models are known to poorly simulate complex coastal currents, our
436
statistical analyses derived from such model provide signals consistent with both
437
inter-annual variability and geographical discrepancies of LR associated with local
438
topography and hydrodynamics (Dubois et al. 2016). Moreover, we demonstrate that
439
our connectivity metrics integrate both larval retention and exchanges (Watson et al.
2012; Lett et al. 2015) and are able to capture recurrent annual circulation patterns
441
(Dubois et al. 2016), that significantly affect the recruitment success of hake on larger
442
spatial-scales (i.e., both at “subpopulation” and “management” levels). Given that
443
recruitment dynamics is the main ecological basis and the unique mechanistic insight
444
of fishery assessment, our study presents a novel framework to incorporate physical
445
information into assessment procedures to improve stock-recruitment relationships
446
and short-term predictions of fisheries production. The two main steps consist in: 1)
447
identifying the spatial scale at which the influence of connectivity processes on the
448
population is prominent; and 2) mechanistically comparing fisheries recruitment data
449
and ad-hoc connectivity metrics (namely import, local retention and self-recruitment)
450
adequately computed over the appropriate region previously defined. Earlier studies
451
have explored how estimates of larval dispersion could be integrated into fisheries or
452
demographic models. They include theoretical perspectives (e.g., Botsford et al.
453
2009b; Castorani et al. 2015), but also studies for small regions and highly sedentary
454
species (e.g., Rochette et al. 2013; Johnson et al. 2018). For large fish stocks,
455
connectivity information derived from genetic, tagging and otolith is often used to
456
spatially delineate subpopulations rather than to model temporal dynamics (e.g.,
457
Holmes et al. 2014). Here, we propose a framework to link dispersal simulations with
458
temporal dynamics of recruitment data of open and large stocks such as the European
459
hake with wide distribution and complex spatial structure.
460
Historically, marine populations tended to be classified as open or closed
461
according to their replenishments being ensured primarily by immigrants or by local
462
production (Hixon et al. 2002). While this dichotomy and its management
463
implications could be applied in small metapopulation of littoral sedentary species
464
(i.e., when connectivity processes are relatively well captured by local retention), it
does not hold for most offshore fish stocks for which there is an increasing awareness
466
that spatial and demographic structure is more complex than currently accounted for
467
(Cadrin et al. 2009; Kerr et al. 2017). This inherently calls for indicators that properly
468
parameterize the observed continuum between open and closed systems beyond stock
469
boundaries and that are able to account for both local and distant connectivity
470
processes. In this view, Self-Recruitment (SR), which was defined to take into
471
account the influences of both local recruits and immigration from the surrounding
472
subpopulations (Botsford et al. 2009a), seems best adapted. Indeed, our study shows
473
that larval SR is, according to our statistical models, the best synthetic predictor of
474
fisheries recruitment, as it constitutes the mechanistic link among the three
475
management areas of the European hake in the Western Mediterranean. Furthermore,
476
to precisely assess the demographic role of each subpopulation (source/sink) and the
477
global metapopulation persistence (Lett et al. 2015), we advocate for the simultaneous
478
interpretation of both SR and Local Retention (LR). Dubois et al. (2016) indeed
479
showed that the greater the relative difference between SR and LR, the more
480
pronounced is the source or sink behavior. We found that SR of four hake
481
subpopulations are mainly controlled by the inter-annual variations of Import (Imp),
482
emphasizing the role of network persistence. We also showed that variability in both
483
LR and Imp in the Catalan Coast and in the northern Balearic Islands contribute to
484
meaningful changes in their respective SRs, indicating the importance of both
485
network- and self-replenishment. Our model suggests that all subpopulations behave
486
as sources, with stronger larval export than import. It is worth distinguishing the
487
effective sources (e.g., Gulf of Lion, Catalan coast), whose exported larvae
488
successfully sustain other identified subpopulations due to favorable dispersal
489
pathways, as compared to the non-effective ones (e.g., north Balearic Islands) whose
exported larvae are lost from the metapopulation system under its hypothesized
491
geographical structure. While those larvae would be, in reality, lost in the open ocean
492
with low likelihood of surviving, they could reach other subpopulations outside of our
493
studied region. However, the phenology of reproduction and recruitment season of
494
neighbored areas upstream (Ligurian or Tyrrhenian Seas, Recasens et al. 2008) and
495
southward Almeria-Oran front (Alboran Sea, Rey et al. 2004) are seasonally opposed.
496
In addition, the absence of favorable nursery habitats upstream the ‘source’ area of the 497
Gulf of Lions makes the success of potential settlement very unlikely (Druon et al.
498
2015). From a spatial management perspective, the subpopulations whose SR
499
represent a balanced contribution of local (LR) and remote (Imp) connectivity
500
processes are of crucial importance for the global persistence of a metapopulation
501
(Botsford et al. 2009a; Lett et al. 2015). In this view, SR emerges as a crucial variable
502
to be properly estimated by scientists and to be adequately considered by managers
503
for ensuring population persistence.
504
The spatial heterogeneity of climate effects on fish recruitment has been
505
reported for global indices, but not yet at regional-scales. Our study presents evidence
506
of a clear regional gradient with antagonist effects in nearby areas located only about
507
500 km away. Together with SR, the climatic index has an elevated explanatory
508
power in two of the three management units. Our results reinforce the inverse
509
relationship between this index and hake recruitment already documented in the
510
Balearic Islands (Massutí et al. 2008). Low values of the index are related to
511
anomalously intense formation of intermediate waters in the Gulf of Lion forced by
512
winter wind-driven vertical mixing (Balbín et al. 2014). These nutrient-rich waters
513
then flow further south and increase biological productivity in the Balearic sea, an
514
area especially oligotrophic in the western Mediterranean, enhancing food availability
for hake larvae and juveniles there (Massutí et al. 2008). In contrast, we also
516
demonstrate for the first time a strong positive correlation between this index and
517
hake recruitment in the Gulf of Lion. We hypothesize that stronger than average
518
mixing events homogenize the water column down to several hundred meters’ depths
519
(and even down to the seabed in extreme events, Balbín et al. 2014) can trigger high
520
mortality rates of locally produced hake larvae, negatively impacting recruitment
521
success in the Gulf of Lion. Other indirect mechanisms could be that, under intense
522
winter convection, hake larvae could entrain in water masses with no food supply
523
and/or within unfavorable dispersal routes toward the open-ocean. These findings
524
reveal how the link between climate variability and its ecological impact is
525
geographically structured at regional scales. In this case, the same local
526
oceanographic event (winter wind-driven vertical mixing in the Gulf of Lion) has
527
opposite impacts in close-by regions. Locally, strong mixing events considerably
528
reduce the survival of hake larvae and recruitment in the Gulf of Lion, whereas they
529
increase food availability over the north-western Mediterranean region, affecting
530
positively hake recruitment in the Balearic Islands.
531
Although climate indices are able to capitalize a broad spectrum of
532
environmental processes with simplistic formulations (standardized air temperature
533
anomalies in our case), they often integrate various processes acting over different
534
time and space windows, with the potential risk of redundancy between drivers,
535
dispersal and hydroclimate. This suggests the need to complement the formulations of
536
climatic indexes with additional information (e.g., from high-resolution ocean model
537
simulations as well as observations gathered by ocean observing systems) that would
538
parameterize adequately the local manifestation of large-scale climatic signals and its
539
associated ecological response. Indeed, while the climate influence of fish populations
has been largely demonstrated, it is rarely included in fisheries assessment due to the
541
difficulty to link climate indices with a specific ecological process within
age-542
structured modeling frameworks. Our study demonstrates that the combination of
543
spatially structured connectivity and climatic effects could be applied in a simple and
544
synthetic way (e.g., Rochette et al. 2013), beyond classic stock-recruitment
545
relationships and independently of the functional form of density dependence. The
546
two physical-dependent drivers can be calculated in winter, increasing the short-term
547
predictive ability of hake recruitment mainly concentrated during the following
548
spring. This suggests that our approach could be of general applicability for many
549
stocks recruiting to the fishery during their first year of life.
550
The population structure of marine species falls in a continuum from truly
551
panmictic to numerous isolated subpopulations, and the majority exhibits complex
552
structures within this range (often referred to as biocomplexity, e.g., salmon in
553
Alaska, Hilborn et al. 2003, herring in the east Atlantic, Ruzzante et al. 2006, cod in
554
the North Sea, Wright et al. 2006). A growing concern among fishery scientists during
555
the last decade is to understand how the loss of bio-complexity influences the
556
resilience and stability of exploited marine populations. This general objective
557
triggered an increasing consideration of complex metapopulation structures and
558
combines in fact two current challenges: a historic questioning about fish stocks
559
boundaries and also a more recent recognition of sub-structuring within management
560
areas as a set of ‘sub-units’ displaying different ecological or demographic functions.
561
Although a panmictic scenario has been suggested for hake in the western
562
Mediterranean (Morales-Nin et al. 2014), our study provides evidence that
563
demographic connectivity is more relevant than genetic connectivity to provide
564
scientific support for the management of hake’s metapopulation in the Mediterranean
Sea as it is able to explain a sizeable component of the inter-annual variability of the
566
observed recruitment. The Gulf of Lion is linked to the Iberian Peninsula management
567
unit mostly by a unidirectional south-westward connection that shapes the hake
568
recruitment dynamics of the latter, consistent with recent research on small pelagic
569
fish (Ospina-Alvarez et al. 2015). Furthermore, the Catalan coast emerges as the
570
critical transitional subpopulation connecting both management units since its
571
simulated larval SR significantly correlates to the observed recruitment of the entire
572
Iberian Peninsula unit, questioning the current geographical delimitation for
573
assessment and management. In contrast, Atlantic populations of the same species
574
show a different scenario with documented gene flows between
geographically-575
separated management units but relative demographic independence (Pita et al. 2016),
576
supporting the current management separation.
577 578
Concluding remarks and future challenges
579
Recognizing subpopulations and providing specific demographic metrics that
580
reflect their heterogeneous contributions to the global dynamic of a metapopulation is
581
a current but accessible challenge for fisheries ecologists (Kerr et al. 2017). Our study
582
provides a methodological framework to calculate and compare these metrics, which
583
acknowledge the complexity of marine populations and ecosystems in a relatively
584
simple manner, providing a research pathway alternative to the development of
585
complex models (e.g., end-to-end ecosystem models). Efficient ways to embrace
586
physics and fisheries assessment to improve management of large metapopulations
587
include, as we showed here, the integrated analysis of a limited number of controlling
588
ecological and environmental processes that are critical to understand and reproduce
589
the functioning and dynamics of marine systems. In this sense, mechanistic modeling
constitutes a valuable tool to circumvent the lack of observations and understanding
591
of these processes. Further research also needs to assess the wider implications of our
592
results for: the population dynamics (i.e. short- and long-term persistence at both
sub-593
and meta-population levels) by incorporating our connectivity indices into population
594
models; for the determination of biological reference points (e.g. maximum
595
sustainable yield) obtained from stock assessment models; or for the design of
596
dynamic and adaptive spatial management. To support the application of spatially and
597
temporally pertinent conservation measures, future research also needs to include
598
other elements such as the relevance of spatially structured ecological functions (e.g.,
599
spawning areas, nursery and feeding grounds) along with the impact of adult
600
mediated-connectivity (Goethel et al. 2011). Finally, a more efficient use of the
601
environmental information generated by ocean models and observing systems is
602
required to pursue the fast development of ‘operational fisheries oceanography’
603
(Álvarez-Berastegui et al. 2016). Besides the abundant research dedicated at including
604
climatic influences in long-term projections of fish production (Rice & Browman
605
2014), a new paradigm should focus in those oceanographic and climatic processes
606
that considerably affect short-term predictions, which are the relevant scales for
607
management purposes. While our study supports the predictive power of SR in a
608
fisheries assessment context, it generally calls for further effort to incorporate
609
connectivity estimates and mesoscale climatic indexes derived from ocean
610
observations and models into fisheries modeling, assessment and stewardship. Over
611
longer time-scales, human-induced climate change is projected to increase ocean
612
temperature, affecting the distribution of fish stocks and increasing the number of
613
transboundary stocks (Pinsky et al. 2018). In addition, climate change is also expected
614
to modify circulation patterns and favor extreme events, influencing the transport and
survival of marine planktonic larvae and, thus, altering connectivity (Lett et al. 2010).
616
Our modelling framework, backed-up by decadal observations, could help to
617
investigate those long-term effects toward the sustainable protection and management
618 of marine ecosystems. 619 620
A
CKNOWLEDGMENTS 621We thank R. Balbin for helpful comments and suggestions on an earlier draft of the
622
manuscript. This work was supported by two post-doctoral contracts from the Spanish
623
program ‘Ramon y Cajal’ (RYC-2015-18646) and from the regional government of 624
the Balearic Islands co-funded by the European Social Fund 2014-2020 to M.H.; Juan
625
de la Cierva Incorporacion fellowship (IJCI-2014-22343) and from MISTRALS
626
ENVI-Med through the HYDROGENCONNECT project to V.R; French program
627
“Investissements d’Avenir” implemented by ANR (ANR-10-LABX-54 MEMOLIFE 628
and ANR-11-IDEX-0001-02 PSL Research University) to E.S-G; and Spanish
629
National projects LAOP (CTM2015-66407-P) to P.M. and E.H-G., and CLIFISH
630
(CTM2015-66400-C3-1-R) to M.H., B.G. and E.M (AEI/FEDER, EU). PR and MH
631
acknowledge funding of the H2020 PANDORA project (Nr. 773713). The authors
632
thank two anonymous reviewers and the editor for their constructive comments that
633
helped improve the original manuscript.
634 635
AUTHORS’
C
ONTRIBUTIONS:636
M.H. and V.R. designed and directed the study. P.M., E.S.-G., V.R. and E.H.-G. set
637
up the Lagrangian modelling framework and performed the simulations. A.J., B.G.
638
and J.L.P. provided the recruitment data. M.H. and V.R. analyzed all data and
paper. M.H., V.R., E.S.-G., E.H.-G., B.G., E.M., F.A., A.J., J.L.P. and P.R.
641
commented on the manuscript.
642 643
L
ITERATUREC
ITED644
Almany, G.R. et al. Larval fish dispersal in a coral-reef seascape, Nat. Ecol. Evol. 1,
645
0148 (2017).
646
Alvarez-Berastegui, D. et al. Pelagic seascape ecology for operational fisheries
647
oceanography: modelling and predicting spawning distribution of Atlantic bluefin
648
tuna in Western Mediterranean. ICES J. Mar. Sci. 73, 1851–1862 (2016).
649
Andrello, M. et al. Global mismatch between fishing dependency and larval supply from
650
marine reserves. Nat. Commun. 8, 16039 (2017).
651
Balbín, R. et al. Interannual variability of the early summer circulation around the
652
Balearic Islands: driving factors and potential effects on the marine ecosystem. J.
653
Mar. Syst. 138, 70–81 (2014).
654
Botsford, L,W. et al. Connectivity and resilience of coral reef metapopulations in marine
655
protected areas: matching empirical efforts to predictive needs. Coral Reefs 28,
656
327–337 (2009a).
657
Botsford, L.W. et al. Connectivity, sustainability, and yield: bridging the gap between
658
conventional fisheries management and marine protected areas, Rev. Fish Biol.
659
Fisher. 19, 69–95 (2009b).
660
Cadrin, S. & Secor, D. Accounting for spatial population structure in stock assessment:
661
past, present, and future. The Future of Fisheries Science in North America, eds.
662
Beamish R, Rothschild B. (Springer Publishing, Dordrecht) pp 405–426 (2009).
663
Carson, H.S., et al. Evaluating the importance of demographic connectivity in a marine
Castorani, M.C.N., et al. Connectivity structures local population dynamics: a
long-666
term empirical test in a large metapopulation system. Ecology 96,3141–3152
667
(2015).
668
Cheung, W.W.L., et al. Signature of ocean warming in global fisheries catch. Nature
669
497, 365−368 (2013). 670
Cowen, R,K, & Sponaugle, S. Larval dispersal and marine population connectivity.
671
Annu. Rev. Mar. Sci. 1, 443–466 (2009).
672
Daewel U, et al. The predictive potential of early life stage individual-based models
673
(IBMs): an example for Atlantic cod Gadus morhua in the North Sea. Mar. Ecol.
674
Prog. Ser. 534, 199-219 (2015).
675
Druon, J. N. et al. Modeling of European hake nurseries in the Mediterranean Sea: An
676
ecological niche approach. Progr Oceanogr, 130: 188-204 (2015).
677
Dubois, M. et al. Linking basin-scale connectivity, oceanography and population
678
dynamics for the conservation and management of marine ecosystems. Global
679
Ecol. Biogeogr. .25, 503–515 (2016).
680
Fernandes, P.G. et al. Coherent assessments of Europe’s marine fishes show regional
681
divergence and megafauna loss. Nat. Ecol. Evol. 1, 0170 (2017).
682
Fiorentino, F. et al. Stock units: Identification of distinct biological units (stock units)
683
for different fish and shellfish species and among different GFCM-GSA.
684
STOCKMED Deliverable 03: FINAL REPORT. September 2014, 310 p (2014).
685
Frisk, M. G. et al. Moving beyond the current paradigm in marine population
686
connectivity: are adults the missing link? Fish Fish. 15, 242-254 (2014).
687
Galarza, J.A. et al.. The influence of oceanographic fronts and early-life-history traits on
688
connectivity among littoral fish species. Proc. Natl. Acad. Sci. USA 106, 1473–
689
1478 (2009).
Goethel D.R. et al. Incorporating spatial structure in stock assessment: movement
691
modelling in marine fish population dynamics. Rev. Fisher. Sci. 19, 119–136
692
(2011).
693
Harrison et al. Larval Export from Marine Reserves and the Recruitment Benefit for
694
Fish and Fisheries. Current Biol 22, 1023–1028 (2011).
695
Hidalgo, M., et al. Intra-annual recruitment events of a shelf species around an island
696
system in the NW Mediterranean. Estuar. Coastal Shelf. Sci. 83, 227–238 (2009).
697
Hidalgo, M., et al. Context-dependent interplays between truncated demographies and 698
climate variation shape the population growth rate of harvested populations. 699
Ecography, 35: 637-649 (2012). 700
Hidalgo, M.,et al. Contrasting evolutionary demography induced by fishing: the role of
701
adaptive phenotypic plasticity. Ecol. Appl, 24: 1101-1114 (2014).
702
Hidalgo, M. et al. Advancing the link between ocean connectivity, ecological function
703
and management challenges. ICES J. Mar. Sci. 74, 1702-1707 (2017).
704
Hilborn, R., et al. Biocomplexity and fisheries sustainability. Proc. Natl. Acad. Sci. USA
705
100, 6564–6568 (2003). 706
Hinrichsen, H-H., et al. Evaluating the suitability of coupled biophysical models for
707
fishery management. ICES J. Mar. Sci. 68, 1478–1487 (2011).
708
Hixon, M., et al. Population regulation: historical context and contemporary challenges
709
of open vs. closed systems. Ecology 83, 1490–1508 (2002).
710
Holmes, S. J., et al. Gadoid dynamics: differing perceptions when contrasting stock vs.
711
population trends and its implications to management. ICES J. Mar. Sci., 71:
712
1433–1442 (2014).
Huwer, B., et al. Connectivity of larval cod in the transition area between North Sea and
714
Baltic Sea and potential implications for fisheries management. ICES J. Mar. Sci.
715
73, 1815–1824 (2016). 716
Johnson, D.W., et al. Integrating larval connectivity with local demography reveals
717
regional dynamics of a marine metapopulation. Ecology, 99(6), 1419–1429
718
(2018).
719
Kerr, L. et al. Lessons learned from practical approaches to reconcile mismatches
720
between biological population structure and stock units of marine fish. ICES J.
721
Mar. Sci 74, 1708–1722 (2017).
722
Kough, A.S., et al. Larval connectivity and the international management of fisheries.
723
PLoS ONE 8, e64970 (2013).
724
Krueck, N.C. et al. Incorporating larval dispersal into MPA design for both conservation
725
and fisheries, Ecol. Applic. 27, 925–941 (2017).
726
Lett, C. et al. Linking local retention, self-recruitment, and persistence in marine
727
metapopulations. Ecology 96, 2236–2244 (2015).
728
Lett,C., et al. Biophysical modelling to investigate the effects of climate change on
729
marine population dispersal and connectivity. Progr. Oceanogr. 87, 106–113
730
(2010).
731
Massutí, E. et al. The influence of oceanographic scenarios on the population dynamics
732
of demersal resources in the western Mediterranean: Hypothesis for hake and red
733
shrimp off Balearic Islands. J. Mar. Syst .71, 421–438 (2008).
734
Minto, C.,R.A. et al. Survival variability and population density in fish populations.
735
Nature 452: 344–348 (2008).
736
Monroy, P., et al. Sensitivity and robustness of larval connectivity diagnostics obtained
737
from Lagrangian Flow Networks. ICES J. Mar. Sci. 74, 1763–1779 (2017).
Morales-Nin, B., et al. Coping with connectivity between populations of Merluccius
739
merluccius: An elusive topic. J. Mar. Syst. 138, 11–219 (2014).
740
Oddo P, et al. A nested Atlantic-Mediterranean Sea general circulation model for
741
operational forecasting. Ocean Sci. Discussions 6, 1093–1127 (2009).
742
Olivar, M.P., Quilez, G. & Emelianov, M. Spatial and temporal distribution and
743
abundance of European hake, Merluccius merluccius, eggs and larvae in the
744
Catalan coast (NW Mediterranean). Fish. Res. 60, 321–331 (2003).
745
Olsen, E. M., G. et al. Spawning stock and recruitment in north sea cod shaped by food
746
and climate. Proc R Soc Lond B Biol Sci 278, 504–510 (2011).
747
Ospina-Alvarez, A.,et al.. From egg production to recruits: Connectivity and
inter-748
annual variability in the recruitment patterns of European anchovy in the
749
northwestern Mediterranean. Progr. Oceanog. 138, 431–447 (2015).
750
Pinsky, M. L. et al. Preparing ocean governance for species on the move. Science 360
751
(6394): 1189-1191.
752
Pita, A., et al. Genetic inference of demographic connectivity in the Atlantic European
753
hake metapopulation (Merluccius merluccius) over a spatio-temporal framework.
754
Fish. Res. 179, 291–301 (2016).
755
Puerta, P. et al. Seasonal variability of cephalopod populations: a spatio‐temporal
756
approach in the Western Mediterranean Sea. Fish. Oceanogr. 25, 373–389 (2016).
757
Recasens, L., et al. Spawning pattern and batch fecundity of the European hake
758
(Merluccius merluccius Linnaeus, 1758) in the western Mediterranean. Sci. Mar.
759
72, 721–732 (2008). 760
Rey, J., et al. Seasonal recruitment of hake in the Alboran Sea (SW Mediterranean).
761
Rapp. Comm. Int. Mer Medit. 37, 427 (2004).
Rice, J. & Browman, H.I. Where has all the recruitment research gone, long time
763
passing? ICES J. Mar. Sci. 71, 2293–2299 (2014).
764
Rochette, S., et al. A hierarchical Bayesian model for embedding larval drift and habitat
765
models in integrated life cycles for exploited fish. Ecol. Appl. 23, 1659–1676
766
(2013).
767
Rossi, V., et al. Hydrodynamic provinces and oceanic connectivity from a transport
768
network help designing marine reserves. Geophys Res. Lett. 41, 2883–2891
769
(2014).
770
Ruzzante, D.E. et al. Biocomplexity in a highly migratory pelagic marine fish, Atlantic
771
herring. Proc. Biol. Sci. 273, 1459–1464 (2006).
772
SAC-GFCM Scientific Advisory Committee on Fisheries (SAC). Report of the Working
773
Group on Stock Assessment of Demersal Species (WGSAD). Rome, Italy, 23–28
774
November 2015. 60 pp (2015).
775
Ser-Giacomi, E., et al. Flow networks: A characterization of geophysical fluid transport.
776
Chaos 25, 036404 (2015).
777
Siegel, D.A. et al. The stochastic nature of larval connectivity among nearshore marine
778
populations. Proc. Natl. Acad. Sci. USA 105, 8974–8979 (2008).
779
Stephenson, R. L. et al. 2009. Population integrity and connectivity in Northwest
780
Atlantic herring: a review of assumptions and evidence. ICES J. Mar. Sci. 66,
781
1733–1739 (2015).
782
Wright, P. J. et al. Evidence for metapopulation structuring in cod from the west of
783
Scotland and North Sea. J Fish Biol, 69, 181-199 (2006).
784
Watson, J.R., et al. Changing seascapes, stochastic connectivity and marine
785
metapopulation dynamics. Am. Nat. 180, 990–112 (2012).
Zuur, A.F , et al. (2009) Mixed effects models and extensions in ecology with R.
787
Springer, New York, NY. (2009).
788 789 790