Constitutive Modeling of the Finite Deformation Behavior of Membranes Possessing a Triangulated Networked Microstructure
by Melis Arslan
B.S. Mechanical Engineering
Middle East Technical University, Ankara, Turkey, 2003
SUBMITTED TO THE DEPARTMENT OF MECHANICAL ENGINEERING IN PARTIAL FULFILLMENT OF THE REQUIREMENTS FOR THE DEGREE OF
MASTER OF SCIENCE IN MECHANICAL ENGINEERING
AT THE
MASSACHUSETTS INSTITUTE OF TECHNOLOGY
AUGUST 2005
0 2005 Massachusetts Institute of Technology All rights reserved.
Signature of Author:
Department of Mechanical Engineering Aug 5, 2005 ~~~-~1
Certified by:
Accepted by:
/rofessor Mar/C. Boyce Kendall Family Professor of hanical Engineering
MASSACHUSETTS INSTITUTE MASSACHUSETTS INSTTrgTE
OF TECHNOLOGY
NOV
L
7 2005
Professor Lallit Anand, Chairman Department Committee on Graduate Students
Constitutive Modeling of the Finite Deformation Behavior of Membranes Possessing a Triangulated Networked Microstructure
by Melis Arslan
Submitted to the Department of Mechanical Engineering on Aug 5, 2005, in partial fulfillment of the
requirements for the degree of
Master of Science in Mechanical Engineering
ABSTRACT
Many biological, natural and synthetic materials possess a networked or micro-truss-like microstructure. In this thesis work, a general microstructurally-informed continuum level constitutive model of the large stretch behavior of membranes possessing a triangulated network or truss-like structure is developed. As a specific example, a constitutive model of the stress-strain behavior of the red blood cell membrane is developed. The mechanical behavior of the membrane of the red blood cell is governed by two primary microstructural features: the lipid bilayer and the underlying spectrin network. The lipid bilayer is analogous to a 2D fluid in that it resists changes to its planar area, yet poses little resistance to planar shear. A skeletal network of spectrin molecules is crosslinked to the lipid bilayer and provides the shear stiffness of the membrane. The planar triangulated structure of the spectrin network is used to identify a representative volume element (RVE) for the model. A strain energy density function in terms of an arbitrary planar deformation field is proposed using the RVE. Differentiation of the strain energy density function provides expressions for the general multiaxial stress-stretch behavior of the material. The stress-strain behavior of the membrane when subjected to uniaxial and simple shear loading conditions in different directions is given, showing the capabilities of the proposed microstructurally-detailed constitutive modeling approach in capturing the evolving anisotropic nature of the mechanical behavior. The proposed constitutive model also provides a framework to explore the contributions of mechanically-induced unfolding. The force-extension behavior of a single modular macromolecule exhibits a "saw-tooth" pattern due to unfolding giving a sequence of force rise to a peak followed
by a load drop. Using the introduced continuum approach together with single molecule
force-extension behavior and a transition state model of unfolding, large deformation behavior of two-dimensional networks of biomacromolecules is studied for various loading conditions. The effect of the strain-rate on the mechanical response is investigated.
Thesis Supervisor: Dr. Mary C. Boyce
Acknowledgements
I am grateful to my advisor, Professor Mary Boyce, for her guidance and support. I feel fortunate to have her as my mentor, with her drive for perfection, vision and passion for science. I would also like to acknowledge Professor Ali Argon for guiding me into the field of Mechanics and Materials and for his precious advice. I would also like to express my sincere thanks for Dr. Hang Qi for his valuable ideas that were essential for the progress of my research. I would like to express my sincere thanks and appreciation for Mohit Garg for the inspiring discussions we had that were encouraging for the development of my thesis.
This degree is a milestone in my career and while I was going through mild storms, my friends and my family gave me invaluable inspiration and guidance for survival.
First of all, I would like to thank the smartest and coolest people here at MIT.
Sai, thank you for being a great office buddy, and a good friend who is there in ups and downs. I appreciate your valuable advice, and also thank you for proof-reading this document!
Anastassia and Kristin, thank you for showing me a different side of this whole MIT notion and for understanding me in all I go through.
Cathal, thanks for the breaks from work, for making me laugh the whole time and for all the beers! It's always good fun with you. You have the power to make a change.
Angelina, thanks for finding me in Strang's class! I'm glad to have you as my friend and my fashion accomplice!
Mohit, thanks again for your support and patience with my millions of Matlab questions, and also thanks for your friendship.
Adam, thanks for making ISN a more lively place to work.
I would also like to thank my friends in Turkey: Orcun, Narin, and Didem for always reminding me how it feels to be home and that home is a place in Turkey and it always will be so.
I would like to thank the two most vigorous people I have known: my aunt Nazan and my grandma Nazike for always believing in me. I would also like to thank my cousin Ayse for always being there to listen to me enthusiastically and helping me out, no matter what. I would like to thank Ahmet for always being the best friend in the whole world to listen to me, to laugh it out and to show me the light.
Finally and above all, I would like to thank my parents Nurhan and Korkmaz, my sister Selin and my brother Cem for encouraging me in the beginning, in the middle and today. I am so lucky to have you as my family. Thank you for letting me find who I am and celebrating it with me. Without you, all this would never happen.
Table of Contents
Chapter 1
Background 9
1.1 Major Areas of Application of Man-Made Cellular Solids ... 10
1.2 Natural Cellular Solids ... ... 12
1.2.1 W ood: B alsa ... 15
1.2.2 C ork ... ... . 17
1.2.3 Trabecular B one ... 19
1.2.4 Sandwich Structures: Iris Leaf, Skull ... 20
1.2.5 Tubular Structures: Plant Stems, Animal Quills ... 21
1.3 Man-Made Cellular Materials ... 22
1.4 Fabrication of Photonic Crystals with FCC, BCC and Cubic Symmetries Using Interference Lithography ... 29
1.5 Macromolecular Networked Structures ... 32
Chapter 2
Constitutive Modeling of the Stress-Stretch Behavior of the Spectrin Network 36 2.1 Introduction ... 362.2 Red Blood Cell Membrane Properties ... 37
2.3 Previous Work on Red Blood Cell Mechanical Properties ... 40
2.3.1 Constitutive Modeling: Skalak, Evans, Mohandas, Hochmuth ... 40
2.3.2 Triangulated Nets: Discher, Wintz ... 44
2.4 C onstitutive M odel ... 47
2.4.1 Microstructure Idealization and Corresponding Representative Volume E lem ent ... 48
2.4.3 Constitutive Stress-Stretch Behavior of Chains ... 50
2.4.3.1 Linear Chain ... 50
2.4.3.2 Molecular Chain ... 51
2.4.4 Strain Energy Density of the RVE ... 55
2.4.5 Stress-Stretch Relationships ... 56
2.5 Determination of Material Properties ... 58
2.6 Uniaxial Tensile Behavior ... 59
2.7 Simple Shear Behavior ... 64
2.8 Pretension Effects ... 68
2.9 Sum m ary ... 70
Chapter 3
Constitutive Modeling of the Stress-Stretch Behavior of 2-D Networks Containing Folded Domains 72 3.1 Introduction ... 723.2 Single Molecule Mechanics ... 73
3.3 Network Mechanics ... 77
3.4 Determination of Material Properties ... 81
3.5 Uniaxial Tension Behavior ... 83
3.6 Simple Shear Behavior ... 96
3.7 Sum m ary ... 100
Chapter 4
Summary and Future Work 102 A pp en dix ... 106List of Figures
1-1 Engineered cellular materials ( Gibson and Asbhy) ... 11
1-2 N atural cellular solids ... 12
1-3 Uniaxial compression stress-strain curve for balsa wood (Easterling et al) ... 15
1-4 Uniaxial compression stress-strain curve for cork (Gibson et al) ... 17
1-5 Uniaxial compression stress-strain curve for trabecular bone (Gibson and Ashby) 19 1-6 The buckling resistance curve for tubular natural structures (Gibson et al) ... 22
1-7 Photograph of 3-D aluminium alloy truss structure (Wallach and Gibson) ... 23
1-8 Unit cell of infinite plane of truss materials (Wallach and Gibson) ... 24
1-9 Uniaxial compression stress-strain curve for the truss material (Wallach and Gibson) ... 25
1-10 Experiments vs. calculations for the truss material response (Wallach and Gibson) ... 26
1-11 Comparison of core configurations for sandwich structures (Evans et al) ... 27
1-12 Crushing force vs. axial compression for foams (Evans et al) ... 28
1-13 2-D and 3-D nanostructures fabricated by lithography (Choi et al) ... 30
1-14 SEM images showing the deformation of SU8 (Choi et al) ... 31
1-15 Macromolecular networked structures ... 32
2-1 The video micrograph of a RBC drawn into a pipette (Jones et al) ... 37
2-2 Sketch of lipid bilayer and the spectrin network (Mohandas and Evas) ... 38
2-3 Sketch of lipid bilayer and the spectrin network (Becker et al) ... 39
2-4 Sketch a spectrin tetram er ... 39
2-5 The video micrograph of a lipid bilayer drwan into a pipette (Mohandas and Evans) .... 43
2-6 The video micrograph of the RBC aspiration (Mohandas and Evans) ... 44
2-7 C6 to C2 transition of a triangulated network unit cell (Discher et al) ... 45
2-8 Triangulated network under compression (Wintz et al) ... 46
2-9 Micrograph of a spread spectrin network (Liu et al) ... 47
2-10 Schematic of the triangulated network and the RVE ... 48
2-11 Schematic of the RVE when subjected to an arbitrary deformation gradient ... 50
2-12 Schematic of a long chain molecule under deformation ... 51
2-13 Uniaxial stress-stretch curve and the degree of anisotropy ... 60
2-14 Evolution of chain orientation, stretch and force under uniaxial tension in the 1-dir. 63 2-15 Evolution of chain orientation, stretch and force under uniaxial tension in the 2-dir. 63 2-16 Simple shear stress-stretch curve and the degree of anisotropy ... 65
2-17 Evolution of chain orientation, stretch and force under simple shear in the 12-dir. ... 66
2-18 Evolution of chain orientation, stretch and force under simple shear in the 21-dir. ... 67
2-19 Effect of pretension in uniaxial stress-stretch behavior ... 68
3-1 Schematic of AFM experiments on single molecules (Rief et al, Discher et al) ... 74
3-2 Rief's WLC fit and the two-state theory schematics (Rief et al) ... 75
3-3 Qi et al's planar network and RVE for the modeling of spectrin (Qi et al) ... 78
3-4 FJC fit to Rief's data (Qi et al) ... 82
3-5 Uniaxial stress-stretch curve showing unfolding of the spectrin modules ... 83
3-6 Cauchy stress vs. nominal stress for tension in the 1-dir. ... 84
3-7 Chain force and stretch vs. extension with unfolding under uniaxial tension in the 1-dir. 85 3-8 Strain-rate dependance under uniaxial tension in the 1-dir. ... 87
3-9 The initial contour length dependance under uniaxial tension in the 1-dir. ... 90 3-10 Chain force and stretch vs. extension with unfolding under uniaxial tension in the 2-dir. 91
3-11 Strain-rate dependance under uniaxial tension in the 2-dir. ... 92
3-12 The initial contour length dependance under uniaxial tension in the 2-dir. ... 94
3-13 Cauchy stress vs. nominal stress for tension in the 2-dir. ... 95
3-14 Simple shear vs. shear angle for uniform and distributed contour lengths ... 96
3-15 Chain force and stretch vs. extension with unfolding under simple shear in the 12-dir. 97 3-16 Chain force and stretch vs. extension with unfolding under simple shear in the 21-dir. 98 3-17 Strain-rate dependance under simple shear ... 99
Chapter 1
Background
The structure of cellular solids has been studied since Robert Hooke in the 1660s. A low density cellular solid is a network of solid struts and/or plates which form the edges
and/or faces of cells.
There are three kinds of cellular solids as grouped by Gibson, L. J. (Gibson and Ashby, 1997):
" 2-D honeycombs,
* 3-D foam with open cells, " 3-D foam with closed cells.
Cellular solids are found abundantly in nature. Natural cellular materials are often mechanically efficient. Inspired from natural cellular materials, man-made cellular solids have been constructed and found to have a variety of applications.
In addition to cellular solids, there are also macromolecular networked structures. There is on-going research in the field of determining mechanical responses of these networks by properly incorporating constitutive member behaviors. Some of the example network structures are: elastomers and biological networks such as: auditory outer hair cells,
cytoskeleton and soft tissues (collagen).
This thesis work will focus on developing constitutive models for two-dimensional truss-like networked microstructures and Chapter 1 will give a brief background on cellular solids and macromolecular networked structures.
1.1 Major Areas of Structural Application of Man-Made Cellular Solids
Cellular solids are utilized in many applications due to their mechanical properties: * Cellular materials are used in packaging applications. The material that is used for
packaging should be able to absorb energy without subjecting the contents to damaging stresses. The strength of the foam can be changed by changing the relative density of the foam. Also, foams can undergo large compressive strains at a constant stress, resulting in the possibility of absorbing large amounts of energy without generating high stresses. Therefore they are also used in protective structures such as helmets and automobile bumpers. In addition to that, their low densities allow the design of light structures that are easily shipped and handled with lower cost.
* Man-made foams and honeycombs are used as an integral part of structural materials, such as sandwich plates. Modem aircraft industry uses honeycomb cores for providing high bending stiffhess to the sandwich plates. Sandwich plate technology has other applications where a combination of high stiffness at low weight is important in the design (skis, space vehicles, etc.).
* Closed cell foams are used as the support material for floating structures. Foams are damage tolerant in comparison to flotation chambers, because of their closed cell structure, they retain their buoyancy even when they are damaged. They are used as the core of the sandwich structures in the deck and the hull of ships for their role in enhancing the structural stiffness and strength as well as their buoyancy features. Some examples of the engineering cellular materials are given in Figure 1.1.
E
Fig.1.1: Engineered Cellular Materials: (a) aluminum honeycomb, (b) closed-cell polyethylene foam, (c) open-cell nickel foam, (d) closed-cell glass foam, (e) open-cell zinc foam, and (f)
1.2 Natural Cellular Solids
(1.B) axial tangential - Vi radial I/1 -)C (2.B)growth ring axial
ray radial i tangential n =18pm 1=18 pm ray t=.p 35 ym' h,= t=L5FLm - Z= 13 im z= ppf (1.A) (2.A)
F1 (3.B) (4) (3.A) F
ni
i'(a)'
I 'I
£ ~ ~06
1'";;
(5.A) (5.B)
Fig.1.2: (1.A) Schematic of Balsa Wood, (1.B) Micrograph of Balsa showing axial (top) and tangential (bottom) faces. (Easterling et al., 1982) (2.A) The micrograph of (a) radial, (b) axial and (c) tangential sections of cork. The cell walls are corrugated in the undeformed configuration. (2.B) Schematic of cork cells, hexagonal prisms with 8 faces, 18 edges and 12 vertices. (Gibson et al., 1981) (3.A) Micrograph of the trabecular bone, showing the open-cell structure. (Vajjhala et al., 2000) (3.B) Open cellular structure used to model the open-cell structure of a typical trabecular bone. (Gibson et al., 1982) (4) Natural sandwich structure: (a) skull (b) iris. (Gibson et al., 1988) (5.A) Micrograph of hawthorn showing the cylindrical shell with the inner foam like cells. (5.B) Plant stems are modeled as cylindrical tubes with foam cores. (Gibson et al., 1995)
p, E P f , Elf
+
In this section some examples of natural cellular solids, their microstructure and
mechanical responses as calculated by researchers (Gibson, Ashby, and Easterling) will
be discussed.
1.2.1 Wood: Balsa
Fig.1.3: Uniaxial compression stress-strain curve for medium-density balsa, tested in radial, axial and tangential directions (Easterling et al., 1982).
The stiffness and the strength of a tree in the axial direction is as large as 20 times that of the stiffness and strength of the tree in the radial and tangential directions.
There are three features that characterize the microstructure of wood (Figure 1.2.1): 1. The highly elongated cells which make up the bulk of the wood are called
"trancheids" in softwoods and "fibres" in hard woods, 2. The "rays" made up of radial arrays of smaller cells,
10-6 radial 0 tangential 0 0.4 0.8 Conpressive strain, c
3. The "sap channels" which are large cells with thin walls that carry water up the tree.
Cubes from balsa wood were cut parallel to the radial, axial and tangential faces. The compressive stress-strain curves for the samples were recorded (Figure 1.3).
The compression in the tangential and radial directions were found to be almost identical, except from the subtle drop at the yield stress point. This difference is due to how "rays" lie in the direction of compression. Compression in the axial direction is different than in the other directions. The yield stress is much higher in the axial direction and the curve shows a much different trend than in the other directions. The compression plots show the anisotropic structure of the balsa wood.
Easterling et al. (1982) also worked on theoretically modeling the balsa wood, considering the microstructure to be a 2-D honeycomb network. Only in-plane deformation was taken into account, neglecting the stiffening effect of the transverse walls. The Young's modulus of the network was calculated using simple beam theory for the cell wall. Using this approach, the modulus in the radial direction was found to be twice the modulus in the tangential direction because of the restraining effect of the "rays" in the radial direction. Another important observation made using the microstructure geometry and beam theory was that, the moduli depend on the third power of the relative density as given in Equation (1.1).
The radial modulus was found to be:
ER=2ET =ES (P/PS), (11)
The theory almost agrees with what was found in the experiments. The axial modulus, EA,
unlike the other two, varies linearly with the relative density. This shows that the anisotropy in wood increases as the relative density decreases.
1.2.2 Cork
The microstructure of cork resembles that of wood (Figure 1.2.2). In the radial view, the cells are hexagonal cells and in tangential and axial views, the cells resemble rectangular bricks. Cubes from cork were cut parallel to the radial, axial and tangential faces. They were deformed in compression and tension. The uniaxial compressive stress-strain curves of the cork cubes is given in Figure 1.4.
10
-E ~~ energy
0 0.2 0.4 0.6 0.8 1.0
nominal strain, 4/l- 1
Fig.1.4: Uniaxial compressive stress-strain curve of cork (Gibson et al, 1981).
The difference in the response of cork and balsa wood is that cork can be assumed to be isotropic in the plane, because of its rather simple in-plane geometry. When cork deforms,
the cell walls buckle and bend. After the maximum stress, amax, shown in Figure 1.5, the cells completely collapse. The response in the radial direction has been found to be significantly different than the in-plane direction. Tensile deformation along the prism axis unfolds the corrugated cell walls. Compressive deformation folds the corrugations even more.
Gibson et al. (1981) also worked on theoretically modeling cork. They found the relative density from the geometry, in terms of the thickness of the cell walls, length of the hexagonal sides and the height of the unit prisms. The in-plane deformation of 2-D hexagonal cells was analyzed in the same manner that Easterling et al. (1982) analyzed the balsa wood. The material has been treated as a network of connected elastic beams that bend and buckle. The moduli in the axial, EA, and tangential, E1 directions were found in terms of the relative density, and the modulus of the cell wall material, Es:
EA= ET=0.5 Es (p / ps)3. (1.2)
The radial stiffness is found from the stiffness of a corrugated hexagonal prism. The radial modulus was found to be:
ER= 0.70 Es (p/ps). (1.3)
This equation predicted the modulus to be a factor of 50 higher than that found in the experiments. A possible reason for this difference can be the corrugation of the cell walls in the calculation which had been neglected in the calculations.
Another interesting feature of cork is that compression in the axial direction does not result in any lateral expansion giving a Poisson ratio of zero. The reason behind this is noted to be the corrugation of the cell walls.
1.2.3 Trabecular Bone
DENSITY. p' (kg/ 3) A22 I10s M ULJS 14 2T 1(102 10 E Eo10 RELATIVE DENSITY 0/p E 0 DENSITY, p (kg/M 2) COMPRE5IVE STRENGTH x x 1h) RELATIVE DENSITY.p/p (A) (B)Fig.1.5: (A) A schematic stress-strain curve for a foam, (B) Young's moduli of cancellous bone plotted by Ashby and Gibson 1997(a), The compressive strength of cancellous bone (b) plotted by
Ashby and Gibson 1997.
Trabecular (cancellous) bone is commonly found at the center of long bones and consist of regularly ordered plates and struts. Bone grows in response to load such that the density of the bone depends on how much load it is carrying. Also, the orientation of the trabeculae depends on the direction of loading. If loads are equal in all three dimensions, equiaxed cells form in the bone. For lighter loads, rod like open cells form and for higher loads, perforated plates form. Because of this variation in trabecular architecture, there is also a variation in the mechanical responses of different trabecular bones. If the structure
10 b L (.0 w cr I-(I) cr~~ ELASTIC-PLASTIC FOAM COMPRESSION DENSIFICATION
PLATEAU (PLASTIC YIELDING)
LINEAR ELASTICITY (BENDING)
2 W Iw 10 10 0 STRAIN, E ED 1 b 10 Ia
contains rod like open cells, then it is modeled as given in Figure 1.2.3.A. For this model the elastic modulus is proportional to the square of the ratio of the relative density:
E CI P (1.4)
Es LPs)
The basic uniaxial compression stress-strain curve of a trabecular bone is given in Figure 1.5.A.
The typical compression stress-strain curve (Figure 1.5,A) has three parts: (i) linear elastic region, (ii) plateau (plastic yielding and buckling) region, and (iii) densification region. The equiaxed cells first deform in a linear elastic behavior by bending or extension of trabeculae. For a trabecular bone with relative density of p*/ps = 0.4, a typical value for the plateau stress is ap,* = 37 MN/m2 (Hayes and Carter, 1976).
1.2.4 Sandwich Structures: Iris Leaf, Skull
Many natural materials possess a sandwich beam structure. The skull has two outer faces of dense bone separated by trabecular bone. The iris leaf has two outer membrane faces which are similar to fiber composite materials separated by a core of thin walled cells (Figure 1.2.4). The sandwich structure provides the leaf structural stiffness and strength and low mass to keep the upright position in the plant.
Mechanically, sandwich plates are efficient at resisting bending and buckling. The separation of the faces by the foamed core section can dramatically increase the moment of inertia, I, of the structure, while only slightly increasing the weight. The deflection of the structure depends on 1/EI, so that the core of the structure increasing the moment of inertia of the structure results in increased stiffness of the structure.
The bending stiffness, EI, of a sandwich beam can be approximated by: Eft2
(EI)= Efbtc , (1.5)
2
where Ef is the Young modulus of the faces, t and c are the thicknesses of the faces and the core respectively and b is the width of the beam. Here it was assumed that the Young's modulus of the core was much smaller than the Young's modulus of the faces. Also the faces are assumed to be much thinner than the core. The core gives rise to shear deflections. The shear stiffness of the core is given as:
(AG) = bcGc. (1.6)
1.2.5 Tubular Structures: Plant Stems, Animal Quills
The tube structure with the foam core (Figure 1.2.5, A) provides the stem of a plant a high resistance against buckling failure due to the weight of the plant. The plant stems resist the bending moment from their own mass as well as that from applied loads. Plant stems were modeled by Gibson et al. (1995) as axisymmetric, cylindrical tubes with foam cores (Figure 1.2.5,B).
Using the axisymmetric cylinder model for plant stems, under uniaxial compression the shell with a foam core has a higher resistance to both global and local buckling than a hollow shell due to the enhanced global bending resistance and due to the foam core also providing a resistance against local buckling of the outer shell. The shell with a foam core was found to have a higher buckling resistance for thin and thick shells (Figure 1.6).
100 __I
(a) (b) 6)
01 10 100 1000
a/f a It
(A) (B)
Fig.J. 6: The buckling resistance of the foam core cylindrical shell to that of the hollow cylindrical shell (A)
for
uniaxial compression, (B)for
bending; the relative density of thefoam
is decreased as: (i), (ii), (iii) Gibson et al. (1995).Experiments have also been conducted to compare with the theoretical model. Silicon rubber cylindrical shells with and without foam cores were tested under uniaxial compression and four point bending. The experimental results agreed with the theoretical results.
1.3 Man- Made Cellular Materials
In addition to natural cellular materials, there are also man-made cellular materials. There is on-going research in the field of man-made cellular materials (Ashby et al., 2000, Brittain et al., 2001, Chiras et al., 2002, Evans et al., 2001, Wallach and Gibson, 2001,
Wicks and Hutchinson, 2001).
In this section we will look at some of the approaches taken to model truss-structured materials recently being developed and used in applications that typically had used foams
and/or honeycomb cores. These structures are not only light-weight, but also possess high stiffness and strength due to the constitutive members' ability to carry axial loads and the tailoring of the truss geometry to optimize the positioning for efficient utilization of the member stiffness and strength contribution to the structure as a whole.
There are three methods to model cellular materials:
i. Dimensional arguments,
ii. Analysis using repeating unit cells,
iii. Numerical micromechanical modeling using finite element methods.
Wallach and Gibson, 2001 used the approaches: (ii) and (iii) to model materials with periodic, three-dimensional truss-like structures (Figure 1.7).
Fig.1. 7: Photograph of a 3D truss structure made from an aluminum casting alloy (Wallach and
They worked on a millimetric periodic array of an aluminum alloy. The mechanical response of an infinite plane of truss materials was calculated from that of the unit cell. A unit cell isolates a repeating structural unit of the material and accounts for the influence of its neighbours through proper periodic and symmetric boundary conditions (Figure
1.8).
h
b
b
Fig.1.8: The sketch of the unit cell used for the infinite plane of truss materials. The triangles are
isosceles right triangles with the inclined members at 450 to the horizontal member. Here, h/b is
the aspect ratio of the unit cell (Wallach and Gibson, 2001).
Wallach and Gibson (2001)'s analysis of uniaxial tension included two steps of numerical simulations. They conducted numerical analysis using MATLAB for the case of a linear-elastic material. And then studied the non-linear response at large deformations employing a finite-element code: ABAQUS.
In addition to looking at the infinite number of cells in the x and y planes, they also looked at finite number of cells' responses with respect to an infinite sized array of unit cells. The truss elements in the structure carry axial loads, the effective Young's moduli
and shear moduli are noted to vary linearly with the relative density as given in Equation (1.7).
E*/Es = C, (p*/ ps),
G*/Gs= C2 (p*/ ps). (1.7)
The stress-strain curves for a network made of several cells under compression was plotted (Figure 1.9,A.).
Ezperumenta R..pon.. of Lattice Bltock Specimens
20 Laulce Block Spochnn Shear Test
16 1-8 14 1.6 12. S0.8 40.6 4 04 2 0.2 0.0% 0.5% 1.0% 1.5% 2.0% 2.5% 0 % . . . Stran 0.0% 0.2% 0.4% 0.6% 0.6% 1.0%
- R1ecio: M-X-d 5 cex x1s specimen Strin
- Y-dcon: 1 cot x 5 cad specimen
- Z-dkecton: 1.5 coN x 2 waN specimen
(A) (B)
Fig.1.9: (A) Measured compressive stress-strain behavior for loading the truss material in x, y, z directions, (B) Measured shear stress-strain behavior for loading the truss material in x-z plane.
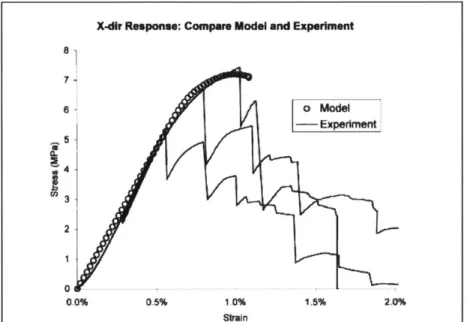
In the x and z directions, the initial slope was found to be the same. In the z direction, the curve has a linear trend up until a strain about 0.7%, and because of the measuring difficulties, there were two tests they carried out which determined the failure stress and the linear trend up to that point. In the x direction, when the members failed there was a sudden drop in stress. The failure in the y direction was because of fracture in the top and bottom face members and buckling in the core members. The buckling is seen in the Figure 1.13 for the y direction.
The measured shear stress- strain curve gave an initial shear modulus of 1.17 GPa. Because of the debonding (Figure 1.14) of the specimen from the aluminum plates, the failure in shear was not measured. The measured moduli were compared to the calculation. Figure 1.10 gives the comparison for loading in the x direction. The discrepancy between experiment and model for Ex, Ey, E, and Gx has been found to be -15%, +3%, +7% and -27%, respectively.
X-dOr Response: Compare Model and Experiment
8 7-o M7-odel - Experiment 1 1 2 0 0.0% 0.5% 1.0% 1.5% 2.0% Strain
Fig 1.10: Comparison of experiments to the calculated response.
Table 1.1: Comparison of predicted and experimental elastic properties.
Failure stress for lattice block material. model and experiment
Experiment (MPa) Model (MPa)A Model ( V/experiment
'F; 6.51 ).S (7.2 ) 1.12
18.31 15.11 (14.72) 0.80
'; 9.01 8.92 (8.42) 0.93
Specnimen sixs: x and y direction specimens were 5 cells / I cell. The : direction specimens were 2 cells - 4 cells.
'Two values Ibr each model are given. The first is for a geometrically perfect model, and the (second) is for a model that includes
Ultra Light Structures
Minimum weight designs are identified by the failure modes. For flat panels subject to bending, honeycomb core panels are always found to be lighter for the same performance (Figure 1.11 .A). However, foam core sandwich structures have superior performances in specific cases, because of their isotropic nature when compared with the honeycomb structures. Examples of designs that require that specific loads be supported at minimum weight are given in Figure 1.11 .B.
4U Fled ,, am , Wafe Panel 0.006 Tru Plate 2 Ip~~ . .. . .... MHZ =0 1 2 L Foam /fn' 2 -plL*X104) 0.004 Core 0N0 0 D0A 20 0 1. 10 O0 0-2 0A 06 0A.8 1.0 (A) (B)
Fig.1.11: (A) Comparison of four core configurations. The minimum weight as a function of collapse load P. (B) Minimum weights is compared for axially compressed configurations as a function of load index. (a) Annual design has the lowest weight. (b) Sandwich structures have
Fig.1.12: Crushing force as a function of axial compression for foams, empty tubes and tubes with foam cores.(1)+(2) refers to the expected experimental result from crushing the tubes with foam cores (Evans et al., 2001).
High Energy Absorption
Cellular materials are noted to have the highest energy absorption per unit mass of any
material as given by Ashby et al. (2000). The isotropy of the foam is a superior feature
for impacts. Figure 1.12 gives the crushing force vs. axial compression for empty tubes
and tubes filled with foam cores. The result is interesting in the sense, Evans et al. (2001)
showed that the addition of the responses of the empty tubes and the foam itself gives
rise to lower crushing force than the actual case they found from the experiments when
they compressed the tubes with foam cores, They explained this phenomenon as a
"synergistic effect". This is analogous to the plant stems in the sense of the foam core
ENERGY ABSORPTION CoNapse Mode Tubes LI. 0 20 40 60 80 A xial Compression (mm) Foam
acting to increase the global bending stiffness and buckling loads as well as the local buckling conditions.
1.4 Fabrication of photonic crystals with fcc, bcc and cubic symmetries using interference lithography
Interference litography can be used to fabricate 3D nanoscale structures which are analogous to truss-like mechanical structures. They have the potential to provide high stiffness, strength, as well as low density and enhanced energy absorption properties. The periodic microstructure is generated by interfering four coplanar or noncoplanar laser beams in a film of photoresist (Campbell et al., 2000, Ullal et al., 2004, Yang et al., 2005). Photolithography is the process of applying a pattern to a substrate material. The material can be anything of interest, typically it is semiconductor material either in wafer or piece
form. The lithography process consists of several key steps:
* Mask fabrication " Photoresist application * Mask alignment " Development
Thomas' Group Work
The Thomas Group (MIT, Materials Science) constructed 2D and 3D periodic structures in polymeric thin films using interference lithography. 2D and 3D nanotrusses were
Fabrication Procedure
1. Making the Solution (Solution: Raw SU8 + initiator + base + solvent),
2. Pre-baking: to evaporate the solvent,
3. Exposure: to produce the interference pattern on the epoxy based photoresist (the interference of three of four equal amplitude beams of visible light from a continuous wave laser),
4. Post baking: to move the polymer for reaction and to crosslink,
5. Development: washing away (in PGMEA-colorless liquid) unexposed parts,
6. Drying.
(A) (B)
Fig.1.13: (A) 2-D and (B) 3-D periodic nano structures fabricated from holographic interference
(A) (B) (C)
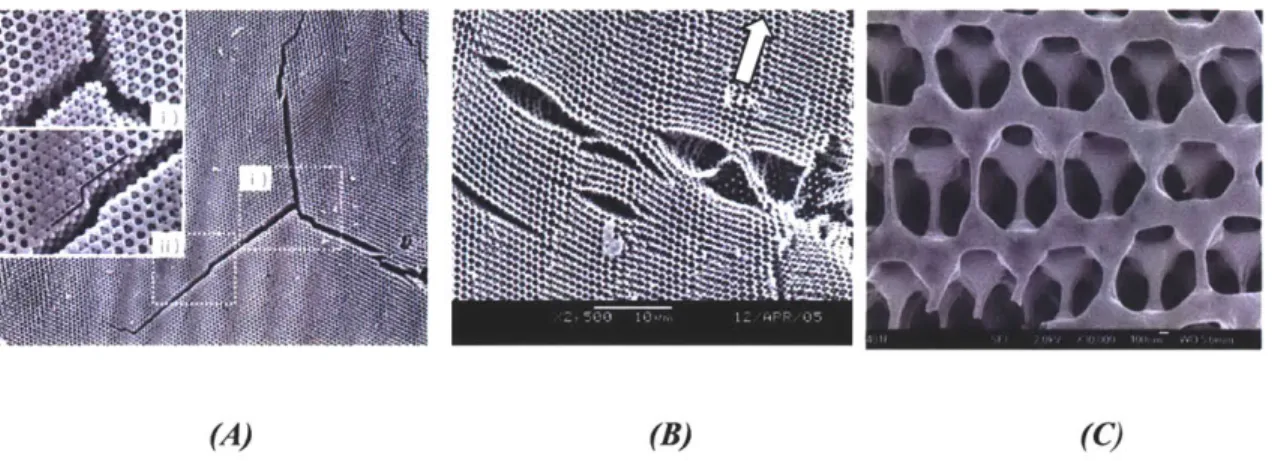
Fig. 1.14: SEM images showing the deformation of SU8: (A) cracks propagating at 1200, (B) large openings with bent ligaments bridging opposite sides and (C) overstretched and fractured beams in the vicinity of crack tip showing plasticity in the top and sub-layer struts. (Choi et al., 2005).
Although the mechanical behavior of the micro truss structured materials have not yet
been quantified, the materials have been deformed (however forces and strains were not
measurable). The "struts" of the microtruss are observed to undergo large strain plastic
deformation. The extensive deformability of these struts may be a length scale effect (the
struts are ~150 nm in diameter) imparting ductility to the SU8 (which is brittle at the
macro-level, Figure 1.14) or it maybe a lower cure than thought.
1.5 Macromolecular Networked Structures
(1) Tubulin (2) (3) Actin (4) (5) (6):'
I
f a ,~/
4?~ I)Ii,;
i~1'
7
I 1iiIu~i
(7.A) (7.B) (8)Fig. 1.15: (1) A schematic of an elastomer microstructure showing the long-chain molecules and the crosslinks that bind them, (2) The array of microtubules in a fibroblast. The bar is 10pn.(Boal, 2003) , (3) 2-D network of spectrin protein in the red blood cell membrane (Liu et al., 1987), (4) A micrograph of the rabbit muscle actin and tubulin (Nakamura, 2001), (5) Single hair cell bundle in the inner ear (Furness and Hackney, 1990), (6) Crosslinked filaments inside a nerve cell from a frog. The bar is 0.1 pum. (Boal, 2003), (7.A) Arrangement of collagen fibrils in corneal stroma (Miller and Benedek, 1973), (7.B) Collagen type Ifibril (left) in tendon and type Hfibril (right) in cartilage (Gelse et al., 2003), (8) A micrograph of infected mouse keratinocytes
In addition to cellular solids which can be considered as networks of solid struts and walls, there are also macromolecular networked structures. Elastomers (Figure 1.15.1) are the basic family of these type of microstructures. The presence of long chain molecules with freely jointed links and weak secondary forces between the molecules are the basic characteristics of rubbers (Treloar, 1958 and Flory, 1953). Crosslinking of the molecules at junctions along their lengths form a three dimensional network.
Biological networks are another class of molecular networked structures. There exist many examples of these structures in nature (Figure 1.15.2-8). One of the examples of two dimensional networks in the animal cell is the spectrin network (Figure 1.15.3). The spectrin network is a 2-D triangulated network of protein molecules; micrographs usually show the stretched form and make the six-fold symmetry clear. There are also three-fold coordinated biological networks, such as the auditory outer hair cell (Figure
1.15.5).
In addition to the 2-D networks existing in the cell, there are also 3-D networks in the cell. For example, keratin intermediate filaments (Figure 1.15.8) extend through the cytoplasm and are attached to the cell nucleus and plasma membrane (Boal, 2003). Actin network is another example of the 3-D networks present in the cytoskeleton where the actin molecules are crosslinked by other protein filaments to form networks (Figure 1.15.4). There is also a microtubule network in the cytoskeleton, where the microtubules are very stiff elements. Figure 1.15.2 gives the microstructure of microtubules which are polymeric protein filaments of tubulin monomers present in the cytoskeleton (Boal, 2003). Some soft tissues have networked structures as well. An example of this class is the connective tissue which contains collagen, the fibrous protein (Figure 1.15.7). Collagen is
the most abundant protein in animals, mainly supporting skin, tendon, bone, cartilage and connective tissue.
The following chapters in this thesis will concentrate on deriving a constitutive model for the two dimensional macromolecular triangulated networked structures. Specifically the spectrin network will be studied in the following chapters.
In Chapter 2, basic red blood cell membrane properties and the importance of modeling the spectrin network (which resembles a two dimensional triangulated network) in investigating the mechanical properties of the red blood cell membrane will be discussed. Previous work on the constitutive modeling of the mechanical properties of the red blood cell membrane and the previous approaches in modeling triangulated nets will be studied. Then the chapter will mainly concentrate on the proposed general continuum level constitutive model of the large stretch behavior of the red blood cell membrane that directly incorporates the microstructure of the spectrin network.
In Chapter 3, the previous theoretical and experimental studies on the unfolding of single molecules possessing folded domains will be given. Then later in the chapter, using the introduced continuum approach and statistical mechanics based models of the chain force-extension behavior together with a transition state model of unfolding, a constitutive model for the membrane stress-stretch behavior will be constructed.
Chapter 4 will provide a summary of the proposed model and will elaborate on possible applications of the same methodology to explore additional complexities in various other microstructures. The methodology will further be extended to investigate three-dimensional structures.
Chapter 2
Constitutive Modeling of the Stress- Stretch Behavior
of the Triangulated Spectrin Network
2.1 Introduction
In this chapter, a general continuum level constitutive model of the large stretch behavior of the red blood cell membrane that directly incorporates the microstructure of the spectrin network is developed. The triangulated structure of the spectrin network is used to identify a representative volume element (RVE) for the model. A strain energy density function in terms of an arbitrary planar deformation field is constructed using the RVE together with various representations of the underlying molecular chain force-extension behaviors. Expressions for the nonlinear finite deformation stress-strain behavior of the membrane are obtained by proper differentiation of the strain energy function. The stress-strain behavior of the membrane when subjected to tensile and to simple shear loading in different directions are obtained, demonstrating the capabilities of the proposed microstructurally-detailed constitutive modeling approach in capturing the small to large strain nonlinear, anisotropic mechanical behavior. The sources of nonlinearity and evolving anisotropy are delineated by simultaneous monitoring of the evolution in microstructure including chain extensions, forces and orientations as a function of macroscopic stretch.
2.2 Red Blood Cell Membrane Properties
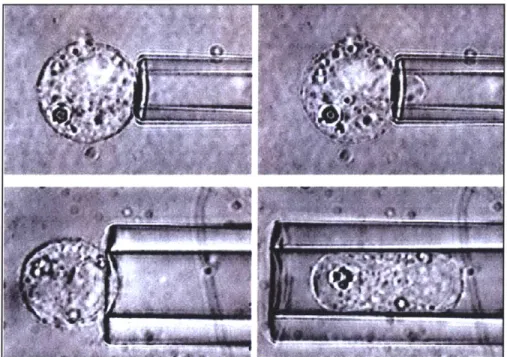
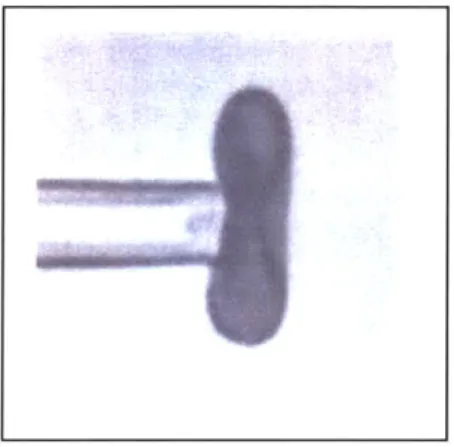
Human red blood cells are disc-shaped. Red blood cells experience deformation when they travel through the circulatory system. These deformations can be quite large especially when the red blood cells enter a capillary, where the human red blood cell diameter is approximately 8 ptm, while the diameter of a capillary is around 3 ptm. In the capillary blood vessels, the blood cell shape becomes bullet-like (Figure 2.1) (Fung, 1993).
Fig. 2.1: The video-micrograph of a red blood cell drawn into a pipette (Jones et al., 1999).
In spite of the large deformations that the Red Blood Cells go through, they recover their shape once the applied load is released. The shear modulus of the cell membrane should be small enough to accommodate the shape change but should be large enough so that the membrane will recover its shape.
To model the elastic response of the membrane, one should take a look at the components of the membrane that provide the mechanical responses.
Fig. 2.2: The sketch of the lipid bilayer and the underlying spectrin network (Mohandas and
Evans, 1994).
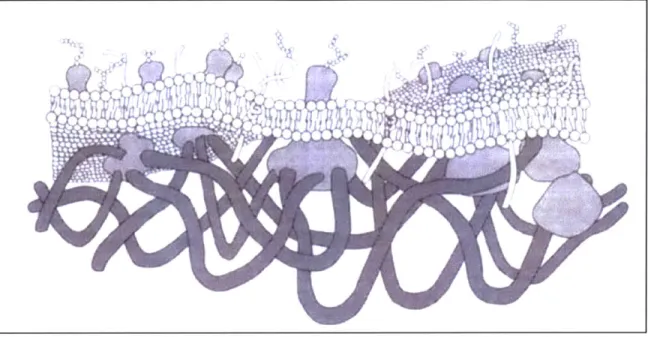
The interior contents of a cell excluding the nucleus is called cytoplasm. The fluid component of the cytoplasm is called cytosol. The fluid-like membrane that bounds the cell is called the lipid bilayer. Cytoskeleton lies beneath the lipid bilayer and, in most cells, also throughout the cytoplasm and is attached to the bilayer. The cytoskeleton is the filamentous network composed of microtubules, intermediate filaments, actin and
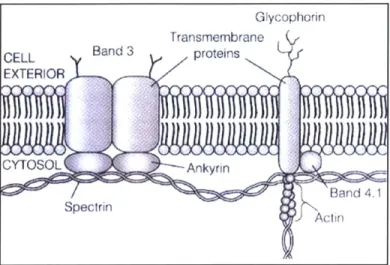
spectrin (Figure 2.3). In the red blood cell, a network of spectrin molecules lies tangential
to the bilayer and is connected to the bilayer through transmembrane proteins. The spectrin network is constituted with x- and P- protein chains. The a and
P
protein chains form a heterodimer; 2 heterodimers combining back-to-back to form a spectrin tetramer(Figure 2.4). The contour length of the heterodimer is I00nm while the heterodimers associate head to head to form tetramers of contour length of 200nm (Mohandas and Evans, 1994).
Fig. 2.3: A picture of the lipid bilayer and the protein network attached to it (Becker et al., 2000).
Fig. 2.4: Sketch of (A) spectrin heterodimer, composed of an a and a '8 polymer chain, (B) 2 heterodimers back to back form a spectrin tetramer.
The lipid bilayer is analogous to a two-dimensional fluid in that it resists changes to its
planar area, yet poses little resistance to planar shear as noted as early as 1948 by Ponder
(Ponder, 1948). A skeletal network of spectrin molecules is crosslinked to the lipid Glycophorin
Transmembrane (,
CELL Band 3 proteins EXTERIOR CYTOSOL Ankyrnn Band 4.1 SpectrinAcn c chain P chain (A) (B)
bilayer and provides the shear stiffness of the membrane. Experiments have documented a membrane planar area modulus of approximately 5(102) dyn/cm and a membrane planar shear modulus of approximately 6(1 0-3)dyn/cm (Mohandas and Evans, 1994).
2.3 Previous Work on Red Blood Cell Mechanical Properties
2.3.1 Constitutive Modeling: Skalak, Evans, Mohandas, Hocmuth
Fung and Tong (1968) first introduced a relationship between the principal stresses and the principal strains in terms of the isotropic elastic Lame' constants t and X:
T1 =h( peJ I + A(ej]j +e2 2)), (2.1)
T2 = h (pe2 2 + A(ej 1 +e22)).
Here, h is the thickness of the membrane. These equations hold for small strains.
Skalak et al. (1973) noted that the strain energy function for the human red blood cell membrane contains two terms in it, one related to the area change, and the second related to the elastic modulus at constant area, i.e the shear modulus. Evans (1973), Skalak et al. (1973), and Evans and Hochmuth (1977) emphasized that the membrane behavior is essentially a two-dimensional analogue to a rubbery solid which shears readily, yet is nearly incompressible.
Skalak et al., (1973) used alternative forms of the invariants defined as: I=2(e1 +e22) and
I2= 4e11e22+2(eii+e22), where ell= %/ (A, 2 1) and e2 2=2 (A2 2
_1). These definitions give:
S2=Al2+A222_2
2 =12 222 dA 2 (2.2)
The preservation of the area constraint gives:
12=0. (2.3)
Then Skalak et al. (1973) postulated a hyperelastic constitutive model, considering a plane thin rectangular element, to define the stress-stretch relationships.
The simple form of strain energy density equation Skalak et al. (1973) used was in the Neo-Hookean form of:
W = 1('12+1 1 1 2)+ 1I22; (2.4)
4 2 8
where B and C are taken to be constant material properties. Using continuum mechanics approaches:
The first Piola Kirchoff Stress is found from:
SY=
aw
(2.5)and, the Cauchy Stress is found from:
1 8
xj 8
x-T-- =Sk -i (2.6)
J 8Xk 8Xl
Here xi is the final coordinate, and Xk is the initial coordinate, and J is the determinant in the form of:
ax-
= - A22 (i, j = 1, 2, 3). (2.7)
The uniaxial tension-stretch curves introduced by Skalak et al. (1973) agreed with Hochmuth and Mohandas (1972) results.
Evans represented the energy per unit area of the hyperelastic membrane network as:
E= (p 22 + A2 22, (2.8)
where A, and 2 are principal stretch ratios for a unit rectangle element and p is the shear
modulus of the membrane. Note that Equation (2.8) should read
E = ( 2J2 + A22 - 2) 2, to account for zero energy when Aj = A2 =1.
Mohandas and Evans, in their review paper from 1994, examined the outcomings of the experiments conducted over the period from 1974 to 1994. They studied the relations between the architecture and the mechanical properties of the cell membrane.
The structural determinants of the membrane elastic properties can be summarized as follows:
A. Membrane Area (Dilatation Elasticity) B. Membrane Bending Elasticity
C. Membrane Extensional Elasticity
A. Membrane Area (Dilatation Elasticity)
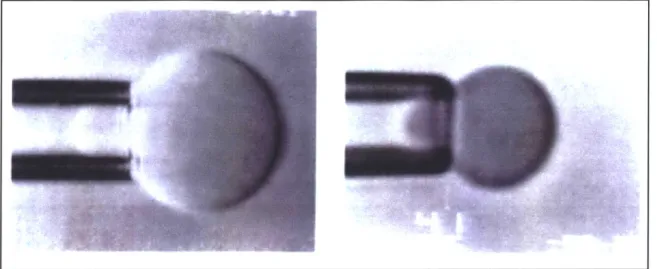
Evans showed the area restrictions using Micro-pipette aspiration techniques comparing an osmotically preswollen red cell and a bilayer vesicle (Figure 2.5). He showed that the red blood cells and the lipid bilayer rupture at an expansion of only 2-3%. Meaning, the surface area change that a cell can undergo is negligible. However red cells lyse at lower tension levels than the bilayer vesicles, meaning, the underlying protein network somehow weakens the red cell. From here, it can be concluded that the resistance to change in surface area is due to the lipid bilayer. They derived, from the micro-pipette aspiration experiments, that the planar area modulus of the membrane is 500 dyn/cm.
Fig. 2.5: The video-micrograph of a phospholipid bilayer (left, diameter=20pm) and a pre-swollen red cell (left, diameter=6pm) drawn into a pipette showing the change in the surface area of the membrane is correlated with the bilayer in the red blood cell (Mohandas et al., 1994).
B. Membrane Bending Elasticity
The lipid bilayer dominates the opposition to bending (Evans et al., 1980). When the red cell membrane is deformed by aspiration into a micropipette (Figure 2.5), the bending stiffness regulates the shape of the membrane at the entrance.
C. Membrane Extensional Elasticity
To look at the extensional elasticity of the membrane, demonstrations are done by aspiration of a flaccid discocyte in a small suction pipette (Figure 2.6). The lipid bilayer dominates the planar area modulus and bending stiffness of the cell (Evans et al., 1980). However, the lipid bilayer contributes negligibly to the extensional rigidity of the red cell as it is similar to a liquid layer. The suction pressure is much bigger than the threshold stress required to overcome the bending rigidity of the membrane, therefore the plots of the suction pressure vs. the aspiration length gives the coefficient of extensional rigidity
of the red cell, p. From the mechanics point of view, p is a measure of the planar shear stiffness.
Extensional elasticity represents the major reason of the recovery of the cell's shape after deformation and it is mainly due to the shear response of the protein network underneath the bilayer.
Fig. 2.6: The video-micrograph of the red blood cell discocyte aspiration(Mohandas et al., 1994).
2.3.2. Triangulated Nets: Discher, Boal, Boey, Wintz
Discher et al. (1997) modeled the spectrin network as a C6 network of Hookean springs. Discher et al.'s triangulated network (Figure 2.7):
i. Maintains connectivity at all times, long-range atomic diffusion or self avoiding elements do not exist in the network.
ii. It is constructed of linear elements which are thin rods that do not overlap, except at the vertices.
iii. Defects in the triangulated network are excluded.
iv. Any energy storage due to angle change between elements in the strain energy function is excluded.
v. Only in-plane motions are allowed in the model (i.e. out of plane buckling is excluded).
These researchers (Discher et al., 1997) formulated the expressions for the elastic strain energy for triangulated networks as a function of the distance between vertices and the area of the triangles.
Wintz et al. (1997) referred to the network as a hexagonal network of chains with Hookean spring behavior. They noted that the constituent chains have a non-zero end-to-end distance since they have a self-avoiding nature and the network has a non-vanishing area.
Wintz et al. (1997) discussed a phenomenon called the "collapse" phenomenon. At low temperatures, the networks undergo a "collapse transition" with increasing compression. In the 2-phase region, collapsed and non-collapsed triangles coexist. Discher et al. (1997) also defined the collapse state as the state at which the triangle completely transforms/crushes into a line (Figure 2.7). Since this state is against the assumption of bond interactions and area diminishing, it is called "collapse" state. This state is not reached for the real network. This collapsed state is impossible because of the existence of the bilayer which constrains the area change needed for such a collapse.
8
9 92 -2
8 4
9 3
Wintz et al. (1997) mentioned in his paper that, one application of the hexagonal network formulation is the protein skeleton of the red blood cell membrane. These researchers also noted that when the membrane is compressed, instead of buckling into the third-dimension, if the bending modulus of the membrane is large enough, lateral compression of a network patch occurs (Figure 2.8).
Fig. 2.8: Wintz et al.'s network under compression (1997).
Discher et al. (1998) worked on a network of molecular chains represented by the WLC model (Marko and Siggia, 1995). The WLC, characterized by two parameters, the presistance length, A and the locking stretch, Ac, provides a better describtion of the network behavior than do the Hookean springs. The polymer network, unlike the spring network do not display collapse transformations under compression.
2.4 Constitutive Model
The constitutive model development for the general membrane stress-stretch behavior of the triangulated spectrin network follows the successful methodology of rubber elasticity (Trelor, 1958, Arruda and Boyce, 1993, Boyce and Arruda, 2000) and can be broken down as follows:
" Idealization of the networked microstructure and identification of a Representative Volume Element (RVE),
" Application of macroscopic deformation to the RVE,
* Assignment of mechanical behavior to constituent elements of the RVE, * Determination of the RVE strain energy,
* Differentiation of the strain energy function to obtain the general multiaxial stress-stretch behavior.
2.4.1 Microstructure Idealization and Corresponding Representative
Volume Element
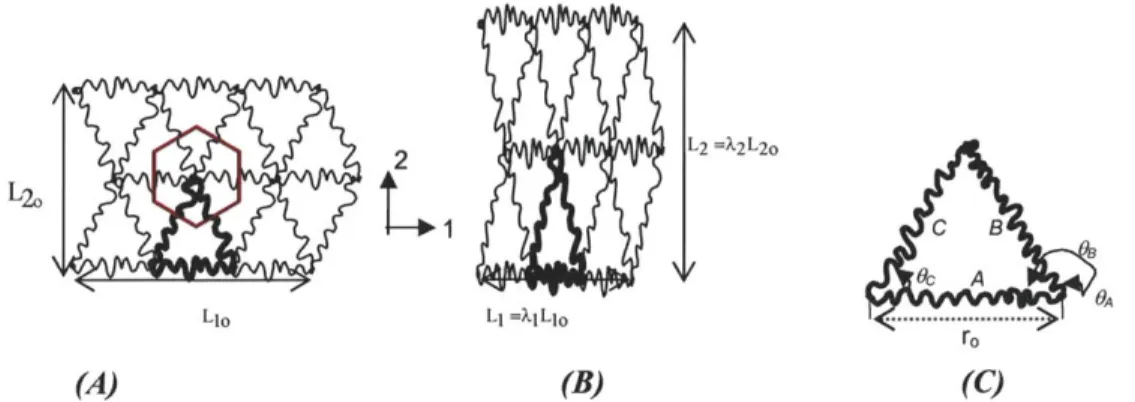
L2 =X2L2 0 j32 C B Oc A A LIO Ll =XILIO ... > r0 (A) (B) (C)Fig. 2.10: Schematic of the planar triangulated network in (A) the undeformed state, also depicting Voronoi tessellation to identify the area of the RVE; (B) when stretched in the 2-direction (planar area is preserved); (C) the representative volume element.
Examination of spread red blood cell membranes by high resolution negative staining electron microscopy reveals the microstructure of the spectrin network (Figure 2.9). A planar network is observed where typically 5-6 spectrin molecules emanate from each crosslink site forming a rather regular triangulated network. This structure has also been referred to as a hexagonal lattice structure (Boey et al., 1998), where we note six triangles form each hexagon. We idealize this microstructure as a regular planar triangulated network as shown in Figure 2.10. Therefore the representative unit cell to analyze the mechanical behavior is chosen to be an equilateral triangle (Figure 2.10, C). Noting that each chain in the unit cell triangle also contributes to its neighboring triangle, we use Voronoi tesselation to identify the area affiliated with the chosen unit cell RVE (Figure 2.10, A). Voronoi tesselation gives the area associated with the RVE constituents to be
twice the area of the RVE triangle; this area will be needed for properly constructing the strain energy density of the network later.
2.4.2 Deformation of the Network R VE
An arbitrary planar deformation is applied to the unit cell equilateral triangle where the planar deformation gradient F2D is defined in the 1-2 frame as:
_ x
F
i F121F2D-
a
-=j where x is the deformed position of a material point and X is theaX _F21 F22I
reference position. The RVE is subjected to an arbitrary deformation gradient (Figure 2.11), giving the stretch of constituent network chains A, B, C in terms of the macrosopic deformation gradient. The simplicity of the unit cell triangle RVE provides a unique, kinematically-determined mapping of the macroscopic deformation gradient to the microscopic network deformation. Denoting the current end-to-end distance of each chain as r,(i = A, B, C), the axial stretch of each chain in the network is, ,i = ri (i = A, B, C)
ro
and can be expressed in terms of an arbitrary planar deformation gradient:
AA =F2 +F2 )21
v'3-A [F/
1 2)2J
AB =j(FU -F12 +( F2 1 -F2 2 ) (2.8)
c'F + Fa _r" ,F, + F22 - r 2 2 2 2 2) C B I oo, B' A a (0, ~A' b0 (Flf.,F2 f.)
Fig. 2.11: Schematic of the RVE in undeformed configuration (solid lines) and when subjected to an arbitrary planar deformation gradient (dashed lines).
2.4.3 Constitutive Stress-Stretch Behavior of Chains
The stress vs. stretch relationship of the membrane will depend on the axial
force-extension behavior of the constituent chains. In this paper, two representations of chain
behavior will be studied: linear axial extension behavior and non-Gaussian freely-jointed
molecular chain behavior.
2.4.3.1 Linear Chain
The linear force-extension behavior of a chain is given by:
Tch = kchro (Ach -1); (2.9)
with corresponding strain energy:
AhC = Ikchro 2 (Ach -1) 2 ;(2.10)
where kch is the chain axial stiffness in units of force/length and ro is the initial chain
2.4.3.2 Molecular Chain
The force-extension behavior of a molecular chain is taken to follow that of a non-Gaussian freely-jointed chain obtained from statistical mechanics treatments of long chain molecules (see, for example, Treloar (1958)).
The Freely Jointed Chain
The freely jointed chain (FJC) model idealizes a molecular chain to be constructed of N rigid Kuhn segments of length 1 which are free to rotate with respect to one another at their joints; the fully extended contour length is then:
Le = N. (2.11)
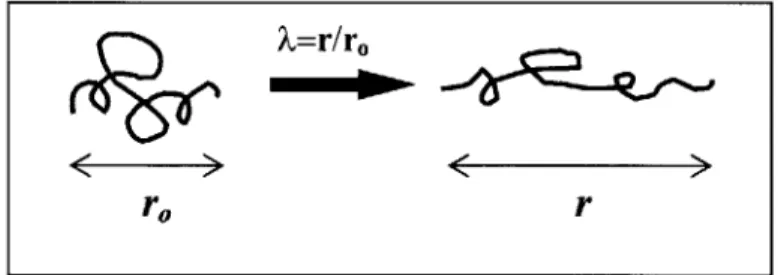
The FJC can accommodate an end-to-end distance r by many different configurations of these connected links and the links will continuously sample this configuration space through thermal fluctutations. Statistics are used to study these configurations as a function of end-to-end distance and thus determine changes in entropy with extension.
r0 r
Fig. 2.12: A schematic of the initial (ro) and current (r) end-to-end distance of a long chain
molecule under deformation.
A. Gaussian Statistics
Kuhn and Grun (1942) derived the probability density function which shows the position of the end of a randomly jointed chain when the beginning point is held fixed. This