Publisher’s version / Version de l'éditeur:
Materiaux et constructions. Materials and Structures, 28, pp. 199-207, 1972-09-01
READ THESE TERMS AND CONDITIONS CAREFULLY BEFORE USING THIS WEBSITE. https://nrc-publications.canada.ca/eng/copyright
Vous avez des questions? Nous pouvons vous aider. Pour communiquer directement avec un auteur, consultez la première page de la revue dans laquelle son article a été publié afin de trouver ses coordonnées. Si vous n’arrivez pas à les repérer, communiquez avec nous à PublicationsArchive-ArchivesPublications@nrc-cnrc.gc.ca.
Questions? Contact the NRC Publications Archive team at
PublicationsArchive-ArchivesPublications@nrc-cnrc.gc.ca. If you wish to email the authors directly, please see the first page of the publication for their contact information.
NRC Publications Archive
Archives des publications du CNRC
This publication could be one of several versions: author’s original, accepted manuscript or the publisher’s version. / La version de cette publication peut être l’une des suivantes : la version prépublication de l’auteur, la version acceptée du manuscrit ou la version de l’éditeur.
Access and use of this website and the material on it are subject to the Terms and Conditions set forth at
Simultaneous determination of the spectroscopic and adsorption
isotherms of water on silica
Litvan, G. G.; Yamasaki, R. S.
https://publications-cnrc.canada.ca/fra/droits
L’accès à ce site Web et l’utilisation de son contenu sont assujettis aux conditions présentées dans le site LISEZ CES CONDITIONS ATTENTIVEMENT AVANT D’UTILISER CE SITE WEB.
NRC Publications Record / Notice d'Archives des publications de CNRC:
https://nrc-publications.canada.ca/eng/view/object/?id=838befdd-cfe0-4e99-ba50-b857926014d5 https://publications-cnrc.canada.ca/fra/voir/objet/?id=838befdd-cfe0-4e99-ba50-b857926014d5N A T/ONAL RESEARCH COUNC/L OF CANADA
CONSEIL NATIONAL DE RECHERCHES D U CANADA
Simultaneous determination of the spectroscopic
and adsorption isotherms of water on silica
P r i c e 25 cents
by
G.G. LITVAN and R.S. YAMASAKI
Reprinted from
MATERIALS A N D STRUCTURES No. 28. July-August 1972
Research Paper No. 528 of the
Division of Building Research
OTTAWA
September 1972
This publication is being distributed by the Division of Building Research of the National Research Council of Canada. It should not be reproduced in whole or in part without permission of the original publisher. The Division would be glad to be of assistance in obtaining such pern~ission.
Publications of the Division may be obtained by mailing the appro- priate remittance (a Bank, Exp~ess, or Post Office Money Order, or a cheque, made payable to the Receiver General of Canada, credit NRC) to the National Research Council of Canada, Ottawa. KIA ORG. Stamps are not acceptable.
A list of all publications of the Division is available and may be obtained from the Publications Section, Division of Building Research, National Research Council of Canada, Ottawa. KIA ORG.
Simultaneous determination of the spectroscopic
and adsorption isotherms of water on silica
G.G. LITVAN (I), R.S. YAMASAKI ( 2 )
The changes in the near inrrared spectra of the pol-ous 96 y :
silica glass-water system were determined, simultaneously with the vapour pressure and the adsorbate coiicentr;~tion, during a complete adsorption cycle. The heating effect of the analyzing undispersed infrared beam was eliminated. From the absorb- ance vs concentration plots i t is inferred that the '. free " silanol
groups are the main adsorption centres and the ratio of H2O to O H is 1 : 1 in the monolayer. The results indicate that the Corning 7,930 porous silica has micropores and a portion of the adsorbed water exists in an u~iperlurbed state over the entire concentration region.
The solution of major problems concerning building materials requires detailed knowledge of the adsorp- tive characteristics of siliceous surFaces. Understand- ing the phenomena of dimensional instability due to changing moisture content, frost action, and impair- ment of mechanical properties on adsorption cannot be achieved without clarifying the state of adsorbed water, the nature of siliceous surfaces, and the inter- action between adsorbate and the solid.
Infrared spectroscopy has prbved to be a useful tool in the study of surface species [ I , 21. Investiga- tions, however, have been-confined to small fractions of a monolayer because of the high absorptivity of the fundamental bands. In addition, the realization that the heating effect of the analyzing infrared beam may significantly alter the concentration of the adsor- bate questions some of the accepted conclusions. It was thus considered warranted to reexamine the important silica - water system. In particular it seemed desirable to carry out a systematic spectro- scopic study covering a complete adsorption cycle
and correlate the results with sorption and vapour pressure values.
The problems of high absorptivity o f the bands necessitating the limitation of the adsorbate concen- tration can be overcome by studying the overtone bands, which have a lower absorptivity than the fundamental ones. However, the overtone bands are also prone to interference due to changes in anharmo- nicity of the molecules. For this reason recent studies have been directed mainly to the fundamental region in contrast to those of the past [3]. Fortunately no such interference was found in the silica-gel - water system [4]. and i t seemed to be worthwhile to study the near infrared region.
Radiation Heating Effect
In the past, little attention has been given to the thermal effect of the infrared beam. Usually it was considered negligible, although little information is available to support this view.
Anderson and Parks [5] assumed that the amount of water desorbed from a silica gel sample due to radiation was less than lo%,, but McDonald [6] observed that the intensity of the water band at 3,400 cnirl increased by 25
%
when the heating effect was eliminaled. Galkin et al. [7] found that the temperature of the specimen in the beam reached 70 to 80 "C. Cant and Little [8] estimated the tem- perature rise to be 20 "C.In the present study the temperature increase of the I-mm-thick porous glass-water system when exposed to the undis~ersed beam in a Perkin Elmer Model 221 spectrophotbmeter was estimated by comparing the
(I), (2) ph. D., ~ i ~of Building Research, i ~ i ~ ~ ~ ~ intensities of the 5,270 cm-I adsorbed water band in ~ i ~ ~ ~ , Research Council of Canada, Ottawa, Canada. the undispersed beam and in the attenuated mono-
A M O U N T A D S O R B E D , M M O L E S I G
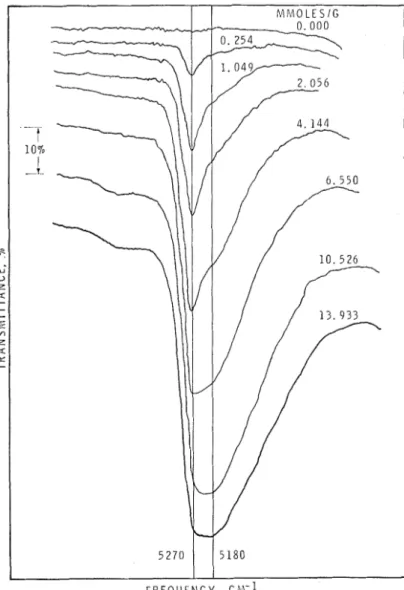
chromatic bean1 of another instrument. The actual surface concentrations were found from the intensity vs concentration curve (fig. 1) determined in the monochromatic beam; the prevailing relative pressure could be obtained from the isotherm (fig. 2). Since the absolute pressures had been measured, the satu- ration pressure could be computed and the prevailing temperature established. Selected values shown in Table I indicate that the average temperature rise was 24 "C and the actual relative pressure was less than one-third of the apparent value.
In past studies either the heating effect itself was eliminated by placing' the specimens in the spectro- photometer between the monochromator and detec- tor [6, 71, o r its undesirable consequences were mini- mized by monitoring the adsorbate concentration on the irradiated substrate [9-121.
In the present study the specimen was exposed only to the attenuated monochron~atic beam, and the adsorbate concentration was also determined by direct weighing. The absence of any weight change on exposure of the sample to the beam demonstrated that the heating effect was effectively eliminated.
EXPERIMENTAL Apparatus
T o permit infrared analysis the gravimetric tube of an adsorption apparatus was fitted with fused silica windows. The sample was hung on a silica helix that was suspended by means of a gold chain from a rotary
Fig. 1. - Intensity change of 5,270 cm-1 band as a function of adsorbed water on 0.5 and 1.0-mm porous glass plates.
vacuum feed-through. By the operation of this mechanism the elevation and the angular position of the sample could be accurately maintained in the infrared analyzing beam. The cell was thermostated at 23 "C by circulating water through a double-walled copper jacket.
The apparatus could be evacuated to less than 10-7 torr pressure. Water vapour pressure was measured by either a butyl phthalate o r a mercury manometer which was isolated from the specimen by a bellows- type null instrument [I31 to prevent contalnination of the sample.
The length change of the silica spring (sensitivity 29.198 cni/g) was determined with a cathetometer.
A Perkin Elmer Model 350 UV-VIS-NIR spectro- photometer was operated at a calculated spectral slit width of 5 cm-1 in the 4,500 to 5,200 cm-I range, increasing to 10 cm-1 at 7,100 cnl-I. The spectro- photometer was calibrated with the aid of a medium pressure mercury arc lamp.
Materials
Porous 96 "/,silica glass [14] (Corning 7,930) was used in the form of ground sheets of two thicknesses, 0.5 and 1 mnl, to facilitate the evaluation of bands of widely differing absorptivities. The NZ BET area was 223.2 and 220.8 m2/g, respectively. The adsorbed organic impurities were burned off in air at a relatively low temperature (380 "C) to avoid extensive dehydroxy- lation. The water was purified by repeated vacuum sublinlations.
Procedure R E L A T I V E P R E S S U R E 1 6 . 0 0 I 0 . 1 I 0 . 2 I 0 . 3 I 0 . 4 I 0 . 5 I 0.6 I 0 . 7 I 0 . 8 I 0 . 9 I 1.0
I
0 0 . 1 0 . 2 0 . 3 0 . 4 0.5 0.6 0 . 7 0 . 8 0.9 1.0 R E L A T I V E P R E S S U R EFig. 2.
-
Adsorption isotherms of water on porous silica glass.Before the measurements were made, the specimen attached to the helix was vacuum saturated at room temperature to restore the equilibrium hydroxyl concentration, which had been reduced in the burning process. After rehydration the specimen was not heated above room temperature. It was found that pumping at room temperature for three days removed all the adsorbed water except for a trace amounting to
-
0.001 mmoles/g evidenced by a weak band at 5,270 cm-l (examined at 10x
ordinate expansion). This finding is in substantial agreement with the observations of Benesi and Jones 1151, Young 1161, and Low and Ramasubramanian [17], but is atvariance with those of Elmer, Chapman, and Nord- berg [la], who concluded that physically adsorbed water is present in porous glass at temperatures up to 200 "C.
For each water concentration duplicate spectra were taken at 10-minute intervals, after the weight and pressure had remained constant for at least 30 minutes, which occurred after one to two hours. Periodic checks after 16 h confirmed the absence of long-term changes. The determination of a complete isotherm required more than one month.
The analysis of the primary spectrophotometric data posed difficulties. Each isotherm was defined by over sixty experimental points and a method had
TABLE I. - CALCULATION OF THE TEMPERATURE INCREASE OF THE 1-MM SPECIMEN EXPOSED TO THE UNDISPEKSED INFRARED BEAM
I I
Intensity of the
/
I5,270-1 cm band 1 Concentration
1
Temp., Apparent1
mmoles/g I p/pO absorbance OC - - 0.156 i 0.52 1.65 75.0 45.9 0.08 0.2251 ::::
79.5 47.01
0.17 0.314 0.095::::'
83.0 47.8 0.37 0.365 I 1.40 0.136 10.24 75.3 45.9 0.49 0.3441
1.281
0.116 0.44 0.5081
2.25I
1
0.295 2% 73.5 45.51
1.02 Average sample temperature 46.6 0C.Ambient temperature 23 OC.
to be found to assess the changes in tlie individual spectral bands caused by small changes in the concen- tration. Integrated intensities could not be determined because of significant overlapping of the bands. Thus, for pragmatic reasoris the changes in band inten- sities were monitored by estimating the overall absorb- ance (base-line method) at the frequency of the band peak. Peak frequencies (v) and half-widths ( A l l + )
of the bands were also determined.
RESULTS AND DISCUSSION Adsorption Isotherm
The vapour pressure isotherms of the two specimens are displayed in figure 2. The vapour pressure isotherm of the I-mm-thick specimen is very similar to those obtained by previous workers [19-221, while that of the other s~ecirnen shows unusual features. viz.. the upper closu're point of the hysteresis loop shifted to p/po = 0.95 from a value of 0.82 and a significant amount of water is adsorbed at large p/pO values (0.8 to 1.0) a region in which the adsorbate concen- tration usually remains constant. These phenomena are associated with the porous structure of the glass that develops when the acid-soluble boric acid phase is leached from the alkali-borosilicate glass during fabrication. The unusual adsorptive properties of the thin glass specimen may be due to better acid pene- tration and hence more complete leaching of the soluble phase, as well as removal of the amorphous silica that normally precipitates in thicker articles [23]. Description of Spectra
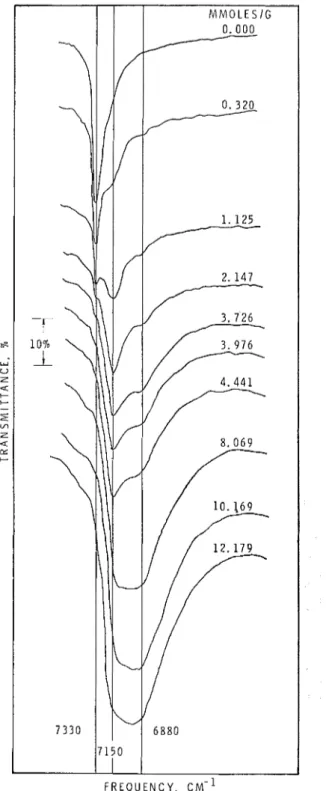
Spectra of porous glass samples at selected water concentrations are shown in figures 3, 4 and 5. Those of the I-mni and 0.5-nini-thick plates were found to be qualitatively similar. The spectrulu of the clean glass contains two bands : one at 7,330 cm-1,
Av,
= 128 cm-1; and another at 4,540 cm-1 At), ,= 130 cmrl. Both bands are somewhat asym-metric, being broader on the low frequency side. On adsorption of water, the intensity of the 7,330 cm - l band rapidly decreases at first (fig. 3 and 6)
and is last observable as a shoulder at the original frequency when the concentration reaches 4 mmoles/g. At the same time two new bands at 7,150 and 6,880 cm-I appear a t 0.3 mmoles/g water concentration increase in intencity (fig. 3 and 6) and are observable up to colnplete saturation.
With increasing water concentration the intensity of the band at 4,540 cm-1 decreases rapidly (fig. 5) and tlie peak disappears at 2 mmoles/g. Meanwhile from 0.5 mmoles/g a band peak is observable as a shoulder at 4,435 cm-1, and at about 1.5 mmoles/g another band appears at 4,515 cm 1 . Overlapping of
the 4,540 and 4,435 cm bands results in a broad composite band the intensity of which decreases with increasing water concentration. For the silica gel-water system similar spectral changes were ob- tained [24].
A band at 5,270 cm-I is observable fro111 0.1 mmoles/g to saturation (fig. I and 4) but a t 6.6
~nnioles/g concentration it overlaps with the band a t
F R E Q U E N C Y , CM']
Fig. 3.
-
Spectra in the 7,000 cm-1 region at various water concentrations (1.0-mm-thick specimen).5,180 cm-1 to form a composite peak which shifts to lower frequencies as the water concetitration increases. At saturation the peak frequency is a t 5,200 cm-1.
Hysteresis
Folman and Yates 1251 reported a hysteresis effect at low concentrations in the plot of the peak optical density vs amount of ammonia adsorbed on porous glass. In the present work no such effect was observed over the entire concentration region.
Fig. 4.
-
Spectra in the 5,200 cm-l region at various water concentrations (0.5-mm-thick spe- cimen).Assignment of Bands
7,330 a~zcl 4,540 an-1 bands
The 7,330 cm-1 band has been attributed to the first overtone of the OH stretching vibration of the isolated surface Si-OH 124, 26-29]. This assignment is supported by the facts that the band (i) is present in the spectrum of the clean glass, (ii) on addition of water behaves similarly to the 3,750 cm-l band, which is the fundamental of the hydroxyl vibrations, and (iii) on deuteration is replaced by another band at lower frequency. The slight asymmetry of the band is presumably caused by limited hydrogen bonding.
The other band at 4,540 cm-1 was assigned to the combination of Si-OH stretching with either (i) Si-OH bending 14, 24, 301, (ii) (SiO), bending [28] or (iii) out-of-plane OH deformation [12] vibrational modes. The present results (fig. 3, 5 and 6) enable us to confirm that the band originates with the glass and that the Si-OH stretching vibration is one component, but they are insufficient for the specification of the other component. It may be mentioned that the spe- cification of the coinponents of the combination bands in the overtone region requires good supporting evidence, since the assignment of these combination bands suffers from great uncertainty [31].
4,435 CHI-1 band
This band was designated as OH11 by Anderson and Wickersheim [4] and attributed to the combination of the stretching and bending vibrations of the Si-OH group perturbed by the adsorbed water. Wirzing 1241 assigned the band to the combination of the stretching and deformational vibrations of the perturbed Si-OH group.
It follows from these assignments that with increased water concentration the 2,435 cm-1 band should increase until all the silanol groups have been occupied and then level off. If other than the silanol groups are the primary adsorption sites the band intensity should remain zero until they become involved in the process. According to figure 5 the intensity increases up to about 2 mmoles/g concentration and then decreases. Above this value the band peak is not observable. This result, if correct, is inconsistent with the proposed assignments. It should be noted, however, that the band is rather weak and difficult to evaluate. 6,880 and 5,180 cnz-l bauds
From approximately 0.3 mmoles/g water content (fig. 3 and 4) two shoulders become observable at 6,880 and 5,180 cm-1 and develop with increasing coi~centration.
T h e assignment of the band at 6,880 cm-l to capil- lary condensed water [29, 24, 41 is supported by the facts that the band (i) is specific t o the water adsorbate, (ii) has a frequency in the vicinity of the first overtone of the water stretching vibration at 6,920 cm-l, (iii) becomes dominant at high concentrations, and (iv) at saturation has Av+ and molar absorptivity ( E ) values of 570 cm-l and 0.23 litre mole-1 cm-l, respect- ively, very similar to those of liquid water (530 cm-' and 0.24 litre mole-1 cm-1, respectively).
T h e 5,180 cm-l band is also attributed to capillary condensed water because (i) the band is specific to the water adsorbate, (ii) its intensity is a function of the water concentration, and (iii) it has a frequency in the vicinity of a combination band (vz -1- v3) of bulk water (5,170 cm-1).
7,150 and 5,270 cnz-1 bartrIs
Because the 5,270 cm-1 band (i) is specific to the water adsorbate, and (ii) increases with increasing water content (fig. I), it is assigned t o adsorbed water in agreement with previous workers [28,29, 24,4].
At saturation in the composite 5,270-5,180 cn-1 bands the 5,180 cm-l band is dominant with Avt = 300 cm-l and e = 0.88 litre mole-l cm-1 values similar to those of bulk water (Av.+ = 290 cm-1 and E = 1.0 litre mole-1 cm-1). Therefore the water giving rise to the 5,180 cm-l band is not perturbed and that giving rise t o the 5,270 cm-l band is perturbed with respect t o bulk water.
Since the 7,150 cm-l band is absent in the spectrum of the clean glass and its intensity is a function of the adsorbate concentration it could be assigned either to the adsorbate o r t o a functional group of the glass perturbed by the presence of the water. This latter possibility was accepted by Wirzing [24], who assigned the band to perturbed Si-OH vibration which was originally at 7,330 cm-1.
Because the magnitude of the frequency shift, Av, is a measure of the interaction between the adsorbate molecule and the surface group, such a shift for the strongly adsorbed water is expected t o be relatively large. T h e value of Av (180 cm-l) is, however, smaller than that of benzene (236) and acetone (1,036 cm -I)
[32], so that the assignment to adsorbed water is preferred.
Microporosity
The band at 6,880 cm-I begins t o develop at very low water concentration. If it is assigned to bulk water, the appearance of this band indicates the pre- sence of such water at coverages well below the inception of the hysteresis loop.
The sites o n a surface become occupied in the decreasing order of their energies. According t o the present results, however, the water molecule is adsorb- ed at a site where its vapour pressure is rather low, yet is not perturbed from a spectroscopic point of view at a concentration less than a monolayer, and the free silanol band intensity is not zero. This suggests that some of the high energy sites become accessible only as the adsorption of water proceeds. This mecha- nism is consistent with the secondary hysteresis effect detected in the vapour pressure and extension iso- thernls of the water-porous glass system [22].
F R E Q U E N C Y , C M - '
Fig. 5.
-
Spectra in the 4,500 cnl-l region at various water concentrations (1.0-mm-thick specimen).The shape of the pores in porous glass is generally assumed t o be of the " ink-bottle" type [33]. In such a system accessibility t o the sites is prevented by too narrow neck radii which are either (i) smaller than that of the water molecule, o r (ii) of such dimensions that the molecule entering it is immobilized by the wall-molecule interaction. I n fact, Broekhoff and D e Boer [33] established the presence of lnicropores in the porous glass by analyzing the results of Emmett and Cines [34]. Cusumano and Low [35] reached similar conclusions in their study of benzene adsorp- tion o n porous silica glass, but found that in their case the filling of micropores began only a t 0.6 mono- layer coverage.
Site of Adsorption
Whether o r not the free hydroxyl groups are the centre of adsorption on siliceous surfaces has been the subject of considerable controversy. I n a number of cases it was found that the intensity of the band due to the free silanol groups was essentially unaffected on adsorption of water [29, 36-42], while in others it definitely decreased [6, 43-47].
A D S O R P T I O N 1 -0- 1
--,--
1. . .
. .,
. . . . D E S O R P T I O N -*---.--
.
...* .,..
I I I I 0I Fig. 6.
-
Intensity changes of 7,330 cm-l,2 . 0 4 . 0 6 . 0 8 . 0 1 0 . 0 2 - O 7,150 cnl-1 and 6,880 cm-1 bands as functions
A M O U N T A D S O R B E D , M M O L E S l G of adsorbed water on 1.0-mm porous glass plate.
In their extensive studies on porous silica glass, Low and Ramasubramanian [17, 48, 491 show that B-OH groups not only exist on the well-dehydroxylated glass surface but are the main centres of water adsorpt- tion. A band in the fundamental region at 3,600 cm-1 has been ascribed to molecular water adsorbed on boron.
The present results d o not seem to show peculiari- ties attributable to the presence of B-OH groups; the spectra are very similar to those obtained with silica gel [4, 241, which contains no boron. Low and Rama- subramanian established that the band due to boron hydroxide appears only in the last stages of degassing at elevated temperature (above 600 "C). This is in agreement with Hair and Chapman [50], who showed that the increased temperature promotes the enrich- ment of the porous glass surface with boron. There- fore, it is inferred that these groups do not give rise to bands in the overtone region if the samples are subjected to low temperatures only.
In fact, perhaps the contradicting observations regarding the adsorption site of water may be caused by differences in the pretreatment of the specimens and can be explained by the following considerations. Prior to spectroscopic investigation, pumping is usually supplemented by heating to drive off the adsorbed water. This is almost mandatory if the strongly absorbing fundamental bands are studied and the specimen is not extremely thin. When the heating temperature is too high, the hydroxyl concen- tration is drastically reduced so that the adsorption of water on such samples proceeds according to a different mechanism. The presence of water on the surface on subsequent adsorption does not, in itself, bring about rehydration until after the relative pres- sure reaches a value greater than 0.6 [51] and even then is not quite reversible [l6].
The results obtained in this work clearly show that the bands due to the free silanol groups (7,330 and 4,540 cm-l) decrease as the adsorbed water concen-
tration increases (fig. 3, 5 and 6). These results agree with those of Galkin et al. [44-461, who studied the fundamental region and serve as evidence that the free silanol group is the primary adsorption site of water on fully hydroxylated porous glass.
This conclusion is supported also by the results of the study of dimensional changes. Folman and Yates 1521 observed a contraction of the glass sub- strate if the adsorbing molecules were capable of forming hydrogen bonds with the surface hydroxyl groups. Water was found to be an exception because it caused no contraction [38] in spite of being prone to form hydrogen bonds, an observation which served as a basis for the conclusion that water interacts with other than the free silanol groups. It was shown recently [22], however, that contraction does occur on adsorption of water, in agreement with the spec- troscopic evidence.
Structure of the Monolayer
The amount of water required for a complete BET monolayer is 4 mmoles/g or 18 ,umoles/m? It has been shown that various silica surfaces at maximum hydration contain approximately 9 , u m o l e s / m ~ r 5.4 OH groups/100 A 2 [53-581 and this is assumed to be valid also for porous glass. From these values it would follow that the ratio of the H2O molecules to the Si-OH groups is approximately 2 : 1. The present results, however, lead to the conclusion that the ratio is I : 1.
It is difficult to visualize how one O H group could form stable bonds with two water molecules. A cyclic structure, consisting of 2 OH groups and 4 H e 0 mole- cules, however, could well exist. Hertl and Hair [59] suggested recently that a six-membered ring of water molecule is interacting with surface silanol groups of the silica. Subsequently, Chua [60] pointed out that a six-membered ring arrangement of water is predicted by molecular orbital calculations to be the
most stable and suggests that a n o n ~ a l o u s water [61] is in fact formed in a six-membered " chair " shape,
hydrogen bonded to each other. The present spectro- scopic results may be considered as an indication that the anonlalous properties of water formed in silica capillaries are a result of the ordering influence of the first layer on the subsequent ones. The absor- bance vs concentration plots shown in figures 1 and 6,
and the previously mentioned disappearance of the 4.540 and 4,435 cm-I bands, however, clearly indicate a change in the adsorption mechanism i t 2 nln~oles/g concentration. This behaviour strongly suggests that the Si-OH t o H z 0 ratio is 1 : 1.
CONCLUSIONS
I t has been confirmed that the heating effect of the undispersed infrared beam significantly interferes with the study of adsorption systems. In the present work it has been estimated that the temperature rise
of the sample was 24 "C. By eliminating the heating effect the "spectroscopic isotherms" could be determined.
The systematic simultaneous study of the spectro- scopic and adsorption characteristics proved t o be a useful method of investigation. It was shown that for the porous silica glass-water system the centre of adsorption is the free hydroxyl group and in the inonolayer the ratio of HsO/OH is 1 to 1 . The pre- sence of perturbed and unperturbed water o n the surface was inferred from the spectral changes.
ACKNOWLEDGMENTS
T h e authors are grateful to Mr. P.J. Sereda for the helpful discussions.
This paper is a contribution from the Division of Building Research, National Research Council of Canada, and is published with the approval of the Director of the Division.
DCtermination simultanke des caractkristiques spec- troscopiques et des isothermes d'adsorption de I'eau
dans la silice. - On a itudii le micanistne rle I'adsoro-
tion de I'eau sur la silice au moj.ai rl'une ~nitliorle qui
consiste h ditertniner sitnuItanCme17t la co~icentrrrtion
s~rperficiefle, lrr pression rle vapeur et le spectre inf7a-
rouge. On est pass6 d'une cotzcetztration rl'eau nulle h la
plehie saturation en plus de 60 &tapes. L'appareil h haut
\vide ~rtilisi conzprend uti tube rle silice clans lequel l'adsor-
bant poreux h 96 0/, de s i l i c ~ est suspetzdu h une hilice
de silice et placi datzs la trajectoire d'lm rayon de
lut?iiPre du .spectrol)lzoto~~~~tre. 0 1 1 a obser1.i q l r ~ Ie
raj.o/i not? di.sper.si dlr spectrophotonzPtre itzfrarouge
orrli~zaire ougmetite de 24 " C la tempirature rle l'ichmz-
tilloti. Cette clzaleur, qui tnodifie co~z.sidirablet~ietzt la
cotzcetztratiotl superficielle, a pu atre iIilnilz&e dons la grisetzte exj)e'rience, et la quailtiti rl'err~l arlsorbie
a PtP r/ite~.tnitiie par g r a ~ ~ i ~ n i t r i e el7 ~ngtne ter7zp.s q ~ l e
se firisrrietit les 1nesLrre.r sl)ectroscol~iques.
L 'arlsorption al)paretz f e des bandes 7,330 et 4,540 on-I rli~nitiue cle faqon logrrrithtnique, et cellcj rles ba~irles
5,270 et 7,150 c w L augtnetzte rlc facon lin&rrire, h
tnesure qu'augmente la concentration rl'eau. Puisqlre IPS premieres bandes sont dues aux groupes libres de silanol en surface, kes risultats app~rient fortement 1'1iypotl~Pse qlre c'est bien slrr ceux-ci, et non sur rl'autres grozrpes, que se produit /'adsorption de I'eau. Le tau.v rle /'augmentation rl'ititensiti des bandes 5,270 et 7,150 cm-1, qui sont associies avec I'eau
adrorbie, change h une concentratio~i de 2 tnmoles/g,
rigion rlatis laquelle I'intensiti des bandes dues aux groupes libres rle sila17ol atteitzt une 1,aIeur trPs faible.
Par Id on pourrait tnotitrer que le rapport HzOISi-OH
clans la tnotzocouclze est de 1 : 1. Les ris~r1tat.s suggPrent
igale~netzt que ce genre rIe ~ w r e poreux (Corning 7,930)
c o ~ i t i ~ n t r1e.s micropores qui comtnencent d s'etnplir
bien alla/zt le &but de la boucle d'hyst&r&sis de I'iso- thertne d'ad.sorptio17. Cela concorde avec d'autres it~rdes sur I'arl.sorption, dons lesquelles on a dice16 zlne boucle secotzrlaire rl'liystirisis. On a obserllt
qu'une partie de I'eau ad.sorb&e existe h l'itat non
perturbi, d ~ r poitzt rIe llue ~l~ectroscopique, s~rr toute
la rkgiot7 rle cot7centratiotz.
REFERENCES
[I] LITTLE L.H. - It~firrrerl Spectra of' Arlsorberl S1)ecies. [8] CANT N.W., LITTLE L.H. - Can. J. Chem. 42,
Academic Press, London-New York, 1966. 802, 1964.
[2] HAIR M.L. - I~ifrrrrerl Spectroscol)y itz Siirface [9] SEANOR D.A., AMBERG C.H. - Rev. Sci. Instr. 34,
Cl~eniistry. Marcel Dekker, Inc., New York, 1967. 917, 1963.
[3] KISELEV A.V., LYGIN V.I. - Itz Infrared Spectra of Adsorbed Species. Academic Press, 1966, p. 213. [4] ANDERSON J.H. Jr, WICKERSHEIM K.A. - Surf.
Sci. 2, 252, 1964.
[5] ANDERSON J.H., PARKS G.A. - J. Phys. Chem.
72, 3662, 1968.
[6] MCDONALD R.S. - J. Phys. Chem. 62, 1168, 1958.
[7] G A L K I N G A., K~SELEV A.V., L Y C ~ ~ N V.I. - J. Phys. Chem. 41, 386, 1967.
[lo] ANGELL C.L. - Vac. Microbal. Techn. 6, 77, 1
[I I] WHITE J.L., JELLI A.N., ANDRE J.M., FRIPIAI - Trans. Faraday Soc. 63, 461, 1967.
[12] PER^ J.B. - J. Pllys. Chem. 70, 2937, 1966. [13] CHAN R.K., MCINTOSH R. - Can. J. Chem.
845, 1962.
[14] NORDBERG M.E. - J. Amer. Ceram. Soc. 27,
1944.
966. J.J.
[15] BENESI H.A., JONES A.C. - J. Phys. Chem. 65,
179, 1959.
[I61 YOUNG G . J . - J. Coll. Sci. 13, 67, 1958.
[I71 Low M.J.D., R A M A S U B R A M A N I A N N. - J. Phys. Clicni. 71, 730, 1967.
[I81 ELMER T.H., C H A P M A N I.D., NORDBERG M.E. - J. Phys. Cliem. 66, 1517, 1962.
[19] AMBERG C.H., MCINTOSH R.L. - Can. J. Chenl. 30, 1012, 1952.
[20] FERGUSON C.B., Wadc W.H. - J. Coll. Interface Sci. 24, 366, 1967.
[21] R A N D M.J. - J . Electrocllem. Soc. 109, 402, 1962. [22] SIDEBOTTOM E.W., LITVAN G . G . - Trans. Faraday
Soc. 67, 2726, 1971.
[23] H A L L E R W. - J. Cheni. Phys. 42, 686 ,1965. [24] W I R Z I N G G . - N a t ~ ~ r w i s s . 50, 466, 1963.
[25] FOLMAN M., YATES D.J.C. -- J. Pliys. Cliem. 63, 133, 1959.
[26] KURBATOV L.N., N E U I M I N G.G. - Dokl. Akad. Nauk SSSR 68, 341, 1949.
[27] Y A R O S L A V S K I ~ N.G., T E R E N I N A.N. - Dokl. Akad. Nauk SSSR 66, 885, 1949.
[28] Y ~ R O S L A V S K I I N.G. - Zhur. Fiz. Khim. 24, 68, 1950.
[29] NIKITIN V.A., SIDOROV A.N., K A R Y A K I N A.V. - Zli. Fiz. Khim. 30, 117, 1956.
[30] SCHOLZE H. - N:lturwissenschaften, 47,226, 1960. [31] W H A L L E Y E . - III Developn~ent in Applied Spcctro-
scopy. Vol. 6, Pergamon Press, 1968, p. 277. [32] T E R E N I N A.N. -- 112 Surfacc Chemical Conipounds
and Their Role in Adsorption Phenomena; Trans- lation by U.S. Atomic Energy Comniission, No 3 750. [33] BROEKHOFI; J.C.P., DE BOER J.H. - J. Catalysis,
10, 153, 1968.
[34] EMMETT P.H., C I N E S M. - J . Piiys. Coll. Clicm.
51. 1260, 1947.
[35] C U S U M A N O J.A., Low M.J.D. - J. Phys. Chcm. 74, 793 and 1951, 1970.
[36] S I D ~ R O V A.N. - Zh. Fiz. I<him. 30, 995, 1956. [37] Zlidanov S.P. - Zli~lr. Fiz. Khim. 32, 699, 1958. [38] FOLMAN M., YATES D.J.C. - Trans. Faraday Soc.
54, 1684, 1958.
[39] SIDOROV A.N. - Optic. a n d Spectros., 8, 424, 1960.
[40] BASILA M.R. - J. Phys. Chem. 66, 2223, 1962. [41] ELMER T.H., C H A P M A N I.D., NORDBERG M.E. -
J. Phys. Chem. 67, 2219, 1963.
[42] IGNATEVA L.A., KISELEV V.F., C H U K I N G.D. - Dokl Akad. Nauk SSSR. 181, 914, 1968.
[43] DAVYIIOV V.Ya., KISELEV A.V. - Koll, Zhurn. 30, 353. 1968.
[44] G A L K I N G.A., KISELEV A.V., L Y G I N V.I. - Russian J. Phys. Cheln. 42, 765, 1968.
[45] GALKIN G.A., KISELEV A.V., LYGIN V.I. - Russian J. Phys. Cliem. 43, 11 17: 1969.
[46] G A L K I N G.A., K ~ S E L E V A.V., L Y G I N V.I. - Russian J. Phys. Cliern. 43, 1292, 1969.
[47] KISELEV A.V. - Russian J. Phys. Chem. 40, 1073. 1966.
[48] Low M.J.D., R A M A S U B R A M A N I A N N. - J. Phys. Chem. 70, 2740, 1966.
[49] LOW M.J.D., RAMASUBRAMANI.~N N. - J. PhyS. Chem. 71, 3077, 1967.
[50] H A I R M.L., C H A P M A N 1.D. - J. Amer. Ceram. Soc. 49, 65 1 , 1966.
[51] HOCKEY J.D., PETI-IICA B.A. - Trans. Faraday Soc. 57, 2947, 1961.
[52] FOLMAN M., YATES D.J.C. - Proc. Roy. Soc. A32, 246, 1958.
[53] Davydov V.Ya., KISELEV A.V., Z N U R A V L E V L.T. -- Trans. Faraday Soc. 60, 2254, 1964.
[54] D E BOER J.H., VLEESKENS J.M. - Proc. Kon. Ned.
Akad. Wetenscli. B61, 85, 1958.
[55] FRIPIAT J.J., UYTTERI-IOEVEN J. - J. PhyS Chelll. 66, 800, 1962.
[56] Z H U R A V L E V L.T., K I S E L E V A.V. - Russian J . Phys. Chem. 39, 236, 1965.
[57] A G Z A M K H O D Z H A E \ ~ A.A., Z H U R A V L E V L.T., KISE-
L E V A.V. - Iz\~est. Akad. Nauk SSSR Ser. Khim., 1 186, 1968.
[5S] AGZAMKHODZHAEV A.A., Z H U R A V L E V L.T., KISE-
LEV A.V., S H E X G E I ~ I Y A K.Ya. - Izvest. Akad Nauk SSSR, Sel-. Khim., 21 1 1 , 1969.
[59] HERTL W., H;ZIR M.L. - Naturc 223, 1151, 1969. [60] C H U A K.S. - Nature, 227, 834, 1970.
[61] DERYAGIN B.V., F E D Y A K I N N.N. - Dokl. Akad. Nauk SSSR 147, 403, 1962.
IMPRIMERIE BAYEUSAINE 8, rue Royale, 14401 BAYEUX