HAL Id: cea-02418706
https://hal-cea.archives-ouvertes.fr/cea-02418706
Submitted on 19 Dec 2019
HAL is a multi-disciplinary open access
archive for the deposit and dissemination of
sci-entific research documents, whether they are
pub-lished or not. The documents may come from
teaching and research institutions in France or
abroad, or from public or private research centers.
L’archive ouverte pluridisciplinaire HAL, est
destinée au dépôt et à la diffusion de documents
scientifiques de niveau recherche, publiés ou non,
émanant des établissements d’enseignement et de
recherche français ou étrangers, des laboratoires
publics ou privés.
Distributed under a Creative Commons Attribution| 4.0 International License
Manufacturing Data Uncertainties Propagation Method
in Burn-Up Problems
T. Frosio, P. Blaise, T. Bonaccorsi
To cite this version:
T. Frosio, P. Blaise, T. Bonaccorsi. Manufacturing Data Uncertainties Propagation Method in
Burn-Up Problems. Science and Technology of Nuclear Installations, Hindawi, 2017, 2017, pp.7275346.
�10.1155/2017/7275346�. �cea-02418706�
Manufacturing Data Uncertainties Propagation Method in Burn-Up Problems
Article in Science and Technology of Nuclear Installations · January 2017 DOI: 10.1155/2017/7275346 CITATION 1 READS 107 3 authors:
Some of the authors of this publication are also working on these related projects: Irradiated Materials for Radiation Dosimetry and Energy Applications View project
Radiological characterization of radioactive waste produced at particle accelerators View project Thomas Frosio CERN 15 PUBLICATIONS 14 CITATIONS SEE PROFILE Thomas Bonaccorsi CEA 7 PUBLICATIONS 13 CITATIONS SEE PROFILE Patrick Blaise
Atomic Energy and Alternative Energies Commission
171 PUBLICATIONS 641 CITATIONS SEE PROFILE
All content following this page was uploaded by Thomas Frosio on 27 January 2017.
Research Article
Manufacturing Data Uncertainties Propagation Method in
Burn-Up Problems
Thomas Frosio,
1Thomas Bonaccorsi,
1and Patrick Blaise
21Reactor Physics and Fuel Cycle Division, Reactor Studies Department, CAD, DEN, French Atomic Energy and
Alternative Energies Commission (CEA), 13108 Saint Paul-l`es-Durance, France
2Experimental Physics Division, Reactor Studies Department, CAD, DEN, French Atomic Energy and
Alternative Energies Commission (CEA), 13108 Saint Paul-l`es-Durance, France Correspondence should be addressed to Thomas Frosio; [email protected]
Received 25 August 2016; Revised 15 November 2016; Accepted 12 December 2016; Published 26 January 2017 Academic Editor: Alejandro Clausse
Copyright © 2017 Thomas Frosio et al. This is an open access article distributed under the Creative Commons Attribution License, which permits unrestricted use, distribution, and reproduction in any medium, provided the original work is properly cited. A nuclear data-based uncertainty propagation methodology is extended to enable propagation of manufacturing/technological data (TD) uncertainties in a burn-up calculation problem, taking into account correlation terms between Boltzmann and Bateman terms. The methodology is applied to reactivity and power distributions in a Material Testing Reactor benchmark. Due to the inherent statistical behavior of manufacturing tolerances, Monte Carlo sampling method is used for determining output perturbations on integral quantities. A global sensitivity analysis (GSA) is performed for each manufacturing parameter and allows identifying and ranking the influential parameters whose tolerances need to be better controlled. We show that the overall impact of some TD uncertainties, such as uranium enrichment, or fuel plate thickness, on the reactivity is negligible because the different core areas induce compensating effects on the global quantity. However, local quantities, such as power distributions, are strongly impacted by TD uncertainty propagations. For isotopic concentrations, no clear trends appear on the results.
1. Introduction
Sensitivity analysis (SA) methods are invaluable tools allow-ing the study of how the uncertainty in the model output relies on the different sources of uncertainty in the model inputs [1]. As a ranking method, it can be used to determine the most contributing input variables to an output behavior as the noninfluential inputs or clarify some correlated effects within the model. The objectives of SA are numerous; one can mention model verification and understanding, model simplification, and factor prioritization [2]. Finally, the SA helps in the validation of a computer code, guidance research efforts, or the justification in terms of system design safety. There is a high amount of literature on procedures and techniques for SA. The main outcomes can be found in [3, 4]. There are many possible uses of SA, described within the categories of decision support, communication, increased understanding, or system quantification and model development. Many different approaches to SA are described
elsewhere, varying in the experimental design used and in the way results are processed. An example of manufacturing uncertainties propagation is described in [5].
Tolerance analysis is also becoming an important tool for nuclear engineering design. This seemingly arbitrary task of assigning tolerances can have a large effect on the cost and performance of manufactured products, such as fuel design and fabrication. However, the fact of propagating tolerances instead of uncertainties does not lead to a representative approach of the errors because; in this case, only a bias is taken into account. It is then imperative to understand what kind of physical data creates and propagates uncer-tainties on the neutronics parameters for both safety and performance reasons. In Material Testing Reactors (MTR), the performance parameters can be core fuel cycle or isotope production. Therefore, it is necessary to calculate isotopic concentrations uncertainties in the reactor core.
We focus in this paper on technological data propagation, with a special attention to uranium enrichment and plate Hindawi Publishing Corporation
Science and Technology of Nuclear Installations Volume 2017, Article ID 7275346, 10 pages https://doi.org/10.1155/2017/7275346
thickness, as example of manufacturing uncertainties prop-agation. In a general engineering framework much broader than nuclear engineering only, as tolerances affect both cost and quality of a product, tolerancing is now considered as being a critical engineering design function. As such, toler-ance allocation is a significant task that deserves considerable attention. The current situation is a compromise between designers, who usually specify tight tolerances to ensure high quality, and manufacturers, who prefer loose tolerances to reduce manufacturing cost [6]. So, adequate (i.e., reasonable or well-balanced) tolerances must be achieved in order to both ensure the desired performance and ease the fabrication process.
In general, there are no specific guidelines for allocating tolerances for any component, but [4] quotes the following paragraph [7]: “The most common practice is to allocate some tolerance that seems appropriate on the basis of experience or intuition, and then conduct an analysis to ensure that the allocated tolerance suits the desired design function. In order to do this, the designer must be able to realize all possible effects of the tolerances specified, especially if universal interchangeability is one of the design goals. The effects of specified tolerances are generally analyzed by creating an analytical model that can predict the accumulation of tolerances in an assembly. Prediction of tolerance accumu-lation is necessary because critical fits, clearances, etc. are usually controlled by the accumulation of several component tolerances”.
After a reminder of the theoretical approach and the implementation of tolerance analysis in the MC propagation methodology and UQ in coupled Boltzmann/Bateman prob-lem, a practical example is given for complete depletion cal-culation, based on a Material Testing Reactor (MTR) bench-mark. This latter is described, and the associated tolerance data, based on an actual series of manufacturing feedback, are detailed. One will focus on two main technological parameters: uranium enrichment of the plates as well as their thicknesses.
The uncertainty propagation will be performed for two different integral quantities: the reactivity, that is, a more global parameter, and the power factor (i.e., the plate fission rate distribution), more sensitive to local variations. A partic-ular focus on the concentrations of some important isotopes will also be made.
2. Evaluation of the Technological
Uncertainties
The method used to evaluate the uncertainties comes from complete work performed in [8, 9].
The complete evaluation of propagated uncertainties on neutronics parameters requires a precise knowledge of both nuclear data and manufacturing uncertainties. If the primers are relatively well known and characterized through consistent covariance matrices, such as the latest ENDF/B-VII.1 [10] or COMAC [11], manufacturing uncertainties are sometimes sparse and often not taken into account in the UQ process. However, those values can be built by considering (supposed known) tolerances.
The statistical nature of uncertainty analysis naturally relies on the use of Monte Carlo sampling methodology. Monte Carlo sampling methods can be used to perform uncertainty propagation throughout the whole core calcu-lation process. The manufacture of a technological item is simulated, for example, by creating a set of component dimensions with small random changes to simulate natural process variations. In this case, a Gaussian model can be selected as a statistical distribution of uncertainties, and
tolerances can be chosen as variances values at3𝜎, built by
expert elicitation.
Next, the resulting assembly dimensions are calculated from the simulated set of component dimensions. The num-bers of outliers that fall outside the specification limits are then counted. Sample sizes generally range between 5,000 and 100,000, based on the required accuracy of the simulation. The accuracy of Monte Carlo sampling increases with larger sample sizes. Obviously, the computational effort of large sample sizes can be significant, but Monte Carlo sampling offers many advantages because of its flexibility. It also allows the generation of a sample of uncertain inputs. We then obtain a sample corresponding to the outputs of the calculation code.
Of course, the best and more rigorous way is to get actual measurement of each series of manufacturing parameters that would allow building the propagated bias on integral parameters between the theoretical core (i.e., without toler-ance) and the actual (i.e., as built) core. The measurement of each sample enables postulating a statistical model of its manufacturing uncertainty. This is the methodology used in the present study.
2.1. Benchmark Description. The benchmark used is the present paper is a Material Testing Reactor based on 20%
enriched 235UU3Si2Al fuel plates [9]. A unique type of
assembly has been modelled to build the whole core. The benchmark does not contain absorbing assembly in order to simplify the calculation: the goal being to give orders of magnitude of the propagated uncertainties.
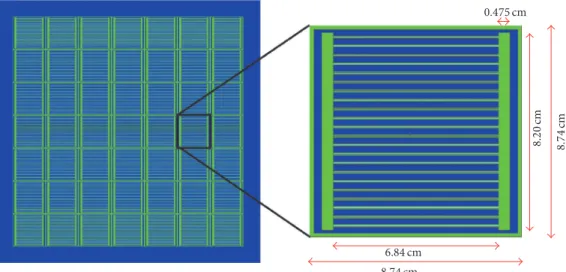
A fuel assembly is made of 22 1.27 mm thick Zircaloy
plates (in green). Each plate contains a 0.51 mm thick U3Si2Al
fuel blade, called “the meat.” The blue elements of Figure 1 represent the water. The assembly stiffeners are made of aluminium.
The benchmark study is performed in 15 energy groups using the APOLLO2.8.3 deterministic code [12] based on a MOC (Method of Characteristics) calculation scheme [13]. The calculation is performed on a 2D quarter of core with ad hoc symmetries. The full Boltzmann/Bateman calculation scheme is described in [8]. Each plate is discretized in 8 sectors, to get a more precise estimation of the local power factor and the concentrations.
For the sake of the present work, two technological parameters and their associated tolerances will be studied.
In the following, they will be noted UO2MB for “UO2mass
balance” and PTh for “plate thickness.”
Perturbation at the beginning of the calculation enables assessing global sensitivities.
Science and Technology of Nuclear Installations 3 0.475 cm 6.84 cm 8.74 cm 8.7 4 cm 8.2 0 cm
Figure 1: Geometric representation of the benchmark.
1 1 UO2MB PTh F req uenc y F req uenc y
Uncertainty: average of 0.994; standard dev. of 0.2% Uncertainty: average of 0.977; standard dev. of 2.5%
Figure 2: Statistical model of manufacturing uncertainty.
2.2. Statistical Distributions of Manufacturing Parameters. The statistical distributions are built by calculating standard deviations and average values of manufacturing parame-ters. We consider, in the following, that measurements of technological parameters are available. An example of this kind of measurement is presented on Figure 2. The means mentioned under each plot correspond to the ratio between theoretical and measurement averaged values. In some cases, inconsistencies are observed. One way for circumvent this inconsistency is to perform a calculation of both average and theoretical cores and compare the results on relevant integral
values (𝑘eff, power distributions, etc.). This comparison gives
a manufacturing bias (not calculated in this work) which can
further be taken into account in the uncertainty tabulation of the core. The red and green curves represent, respec-tively, the probability density function and the cumulative distribution function, normalized. The histogram reproduces the frequency of the values observed by measurement. If the distribution function of a manufacturing parameter is a known law, the best is to make the propagation of this law in the propagation process. If it is not, we can perform the propagation, considering that the parameter follows a Gaussian law. As a Gaussian represents the maximum entropy law, the propagation is then conservative. In our example, the UO2MB parameter is not exactly a Gaussian but we will consider it as such. In these two parameters, the uncertainty
on PTh is more important (2.5% at 1𝜎) than uncertainty
on UO2MB (0.2% at 1𝜎). However, as we will see in the
following, the impact of UO2MB is higher on neutronics uncertainties.
As shown in [8, 9], the response function is modelled by
𝑓 :{{ { R𝑛→ R𝑝 𝜅 = (𝜅1, . . . , 𝜅𝑛) → 𝑌 = (𝑌1, . . . , 𝑌𝑝) = 𝑓 (𝜅) , (1) where 𝛿𝑓 (𝑡) = 𝛿ℎ (𝑡) + ∑ 𝑖⊂𝑠 [𝛿 (ℎ ∘ 𝑁𝑖) (𝑡)] (2)
and different methods can be used to calculate sensitivity indices and uncertainties. The method developed in the following does not allow getting the derivative from (7) as
𝜕ℎ/𝜕𝜅𝑘 which is the sensitivity of the interest responseℎ to
the input 𝜅𝑘. In fact, this would be possible if large CPU
time is available on HPC clusters. For example, to calculate the sensitivity of reactivity to PTh would require 1078 full calculations (i.e., coupled Boltzmann/Bateman from 0 to 100,000 MW⋅d/T). The 49 assemblies of the benchmark are composed each of 22 plates. For UO2MB only, 8624 full calculations should be performed. This kind of calculation is impossible today in reasonable time. Then, calculations are performed for each parameter by sampling their dis-tribution law. Five hundred calculations are performed for each technological parameter, enabling a reconstruction of an estimator of the output distribution laws. Hence, parameters that impact the neutronics values can be identified and ranked. Another difficulty arises here through the coupled calculation and the associated uncertainty propagation com-ing from direct and transmutation terms. Transmutation and direct effects can be decorrelated by doubling the number of calculations, with the methods coming from [9]. In this paper, we will use the MC method described therein with the goal to get a global sensitivity analysis. However, its major drawback is that it does not take into account correlations between input parameters. These correlations could be calculated using Pearson coefficients if the measurements are correlated. For example, if the manufacturer simultaneously measures both fuel size and mass, correlations between these two parameters can be extracted. The geometrical perturbations are done for each assembly independently, using the Salome tools (http://www.salome-platform.org/).
The sampling can be performed using a multidimensional Gaussian law whose probability function is given by
𝑔 (𝜁) = 1 √2𝜋 1 det(𝑀 (𝜅)) ⋅ exp [−1 2(𝜅 − 𝜇) 𝑇 [𝑀 (𝜅)]−1(𝜅 − 𝜇)] , (3)
whereΙΕ(𝜅) = 𝜇 = (𝜇1, . . . , 𝜇𝑛) is the manufacturing data
mathematical expectancies and𝑀(𝜅) is the covariance matrix
of inputs𝜅.
R (https://www.r-project.org/) has here been used as the tool to perform the sampling, made independently of each technological parameter.
Theℓ simulations performed by sampling enable building
the uncertainties of different quantities𝑌 of interest from
̂𝑌 (𝑡) − 𝑌ref(𝑡) = 1ℓ∑ ℓ 𝑌ℓ(𝑡) − 𝑌ref(𝑡) ⏟⏟⏟⏟⏟⏟⏟⏟⏟⏟⏟⏟⏟⏟⏟⏟⏟⏟⏟⏟⏟⏟⏟⏟⏟⏟⏟⏟⏟⏟⏟⏟⏟⏟⏟ Bias ± √ 1 ℓ − 1∑ℓ (𝑌ℓ(𝑡) − 1 ℓ∑ℓ 𝑌ℓ(𝑡)) 2 ⏟⏟⏟⏟⏟⏟⏟⏟⏟⏟⏟⏟⏟⏟⏟⏟⏟⏟⏟⏟⏟⏟⏟⏟⏟⏟⏟⏟⏟⏟⏟⏟⏟⏟⏟⏟⏟⏟⏟⏟⏟⏟⏟⏟⏟⏟⏟⏟⏟⏟⏟⏟⏟⏟⏟⏟⏟⏟⏟⏟⏟⏟⏟ Uncertainty → ℓ → +∞ ± 𝜀𝑌(𝑡) , ∀𝑡. (4)
The equations from [9] for local isotopic concentrations uncertainties are still valid then, and we resume here the theory for the sake of completeness.
During the calculation process, it is possible to extract concentrations values at each evolution step.
Using (4) and if𝑌 represents an isotopic concentration,
it is then possible to build the uncertainty, comparing to a reference calculation.
We write𝑀𝑁(𝐴, 𝑡), the isotopic covariance matrix in the
mesh element𝐴 at step 𝑡 (unknown), as follows:
𝑀𝑁(𝐴, 𝑡) = 𝑍𝑇(𝐴, 𝑡) Ω 𝑍 (𝐴, 𝑡) , (5)
where𝑍(𝐴, 𝑡) is a matrix representing sensitivities of isotopic
concentrations((𝜕𝑁𝑖/𝜕𝜅𝑘)(𝐴, 𝑡))𝑖,𝑘and Ω is the correlation
matrix(𝑟𝑘1,𝑘2)𝑘1,𝑘2 between input manufacturing
uncertain-ties.
As Ω is a correlation matrix, only ones are on its
diagonal. Then we can get the uncertainty to each isotopic
concentration𝑖 with the formulation:
𝑍𝑖,𝑖(𝐴, 𝑡) = (√∑ 𝑘 𝜕𝑁𝑖 𝜕𝜅𝑘 (𝐴, 𝑡) 𝜕𝑁𝑖 𝜕𝜅𝑘 (𝐴, 𝑡) 𝜀𝑘𝜀𝑘)𝑖,𝑖 (6)
with𝑍𝑖,𝑖(𝐴, 𝑡) the uncertainty of isotopic concentration in a
core mesh. The MC estimator of𝑍𝑖,𝑖is then written as
̂ 𝑁𝑖(𝐴, 𝑡) − 𝑁ref(𝐴, 𝑡) =1ℓ∑ ℓ 𝑁𝑖,ℓ(𝐴, 𝑡) − 𝑁ref(𝐴, 𝑡) ⏟⏟⏟⏟⏟⏟⏟⏟⏟⏟⏟⏟⏟⏟⏟⏟⏟⏟⏟⏟⏟⏟⏟⏟⏟⏟⏟⏟⏟⏟⏟⏟⏟⏟⏟⏟⏟⏟⏟⏟⏟⏟⏟⏟⏟⏟⏟⏟⏟⏟⏟ Bias ± √ 1 ℓ − 1∑ℓ (𝑁𝑖,ℓ(𝐴, 𝑡) −1ℓ∑ ℓ 𝑁𝑖,ℓ(𝐴, 𝑡)) 2 ⏟⏟⏟⏟⏟⏟⏟⏟⏟⏟⏟⏟⏟⏟⏟⏟⏟⏟⏟⏟⏟⏟⏟⏟⏟⏟⏟⏟⏟⏟⏟⏟⏟⏟⏟⏟⏟⏟⏟⏟⏟⏟⏟⏟⏟⏟⏟⏟⏟⏟⏟⏟⏟⏟⏟⏟⏟⏟⏟⏟⏟⏟⏟⏟⏟⏟⏟⏟⏟⏟⏟⏟⏟⏟⏟⏟⏟⏟⏟⏟⏟ Uncertainty → ℓ → +∞ ± 𝜀𝑁𝑖(𝑡) = 𝑍𝑖,𝑖(𝐴, 𝑡) , ∀𝑡. (7)
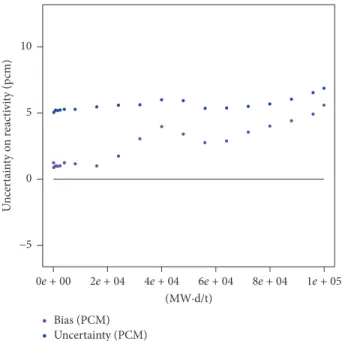
Science and Technology of Nuclear Installations 5 Bias (PCM) Uncertainty (PCM) −5 0 5 10 U n cer ta in ty o n r eac ti vi ty (p cm) 2e + 04 4e + 04 6e + 04 0e + 00 8e + 04 1e + 05 (MW·d/t)
Figure 3: Uncertainty on reactivity (pcm) induced by PTh.
3. Results on Propagation of
Two Physical Parameters
In this paragraph, we discuss the results obtained on both manufacturing parameters propagated in the calculation code. In the following, the shapes of the outputs follow a normal law. Its variance is here called “uncertainty” and mean is here called “bias.”
3.1. Propagation of Plates Thickness. Calculations are per-formed with perturbations of the plate thickness. For each calculation, the thickness is sampled in its distribution law. 3.1.1. Propagation on Reactivity. The results related to reac-tivity uncertainty are shown in Figure 3. We observe a weak impact on the propagated uncertainty (blue curve). The
impact is around 5 pcm at1𝜎 during all the irradiation. This
low value is justified by the fact that the perturbations are almost compensated on the whole core geometry. For some plates, the perturbation increases the thickness, as, for others, it decreases. So, because of the important number of plates (more than a thousand), the average of all the perturbations cancels out. Moreover, the perturbations are made with a constant mass balance in the plate to get only the geometrical perturbation. If the uncertainty on plate mass balance is known, another calculation can be performed to get this particular impact.
However, we observe an important impact on the bias (compared to the standard deviation). This impact is a model bias, coming from the mesh perturbations and from the average of measured values compared to theoretical value (Figure 2). In fact, when the thickness of the plates is modified, the perturbation of the calculation mesh is
0 MW·d/t 100,000 MW·d/t 0.02 0.04 0.06 0.08 0.10 0.12 0.14 0.16 0.02 0.04 0.06 0.08 0.10 0.12 0.14 0.16
Figure 4: Uncertainty on power factors (%) induced by PTh.
automatically produced. Another part of this bias comes from the convergence of the MC estimator.
3.1.2. Propagation on Power Factors. As for the reactivity, the perturbation of plate thickness has a relatively weak impact on the power factors (Figure 4). The propagated uncertainty
is of the order of 0.16% at 1𝜎 for the maximal value. At
the beginning of life, the uncertainties are concentrated principally in the centre of the assemblies. In fact, the thickness perturbation modifies the moderation ratio. This effect is most important in the centre of the assemblies, where the power factor is lower. During depletion, the uncertainties decrease with uranium consumption. So, after relatively large burn-up values, the total uncertainty on the perturbed core converges to the one of the reference core. The uncertainties induced by technological uncertainties on plate thicknesses are then compensated by the fuel consumption.
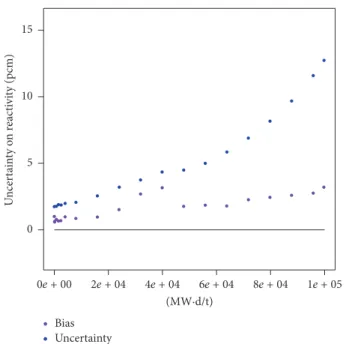
Bias Uncertainty 0 5 10 15 U n cer ta in ty o n r eac ti vi ty (p cm) 2e + 04 4e + 04 6e + 04 8e + 04 1e + 05 0e + 00 (MW·d/t)
Figure 5: Uncertainty on reactivity (pcm) induced by UO2MB.
3.2. Propagation of UO2 Mass Balance. For the UO2MB parameter, the results are slightly different and are detailed in the next 2 paragraphs.
3.2.1. Propagation on Reactivity. The propagated uncertainty values for reactivity, presented on Figure 5, remain weak for the same reasons as previously. At the beginning of life,
the uncertainty on reactivity is close to 3 pcm at1𝜎. During
irradiation, this value increases to reach 15 pcm at 1𝜎. The bias observed on the reactivity is only the result of the convergence of MC estimator. The bias is weak compared to the total uncertainty of the reactivity (including nuclear data [8, 9]). Increasing the number of samples is possible but not efficient because of the large CPU time needed for each calculation. The uncertainty increase comes from a flux displacement in the core during the depletion process. During irradiation, the areas with higher mass balance uncertainties are consumed at first, hence inducing a flux displacement to the outer regions. The elements in the outer regions become more important in the reactivity uncertainty, which is then increased conse-quently.
3.2.2. Propagation on Power Factors. For the power factors, we observe a random map (Figure 6) because of the absence of strong space dependency for mass balance uncertainty. Hence, no trend on power factors uncertainties can be observed or pointed out during depletion. We can only observe the results of a lot of sampling. The maximal value
of uncertainty is 1% at 1𝜎. With this value being higher
compared to uncertainty coming from PTh parameter and PTh uncertainty being ten times lower than uncertainty on UO2MB, this parameter has a higher impact on power distribution. During irradiation, the uranium consumption
0 MW·d/t 100 MW·d/t 0.60 0.65 0.70 0.75 0.80 0.85 0.90 0.95 1.00 0.60 0.65 0.70 0.75 0.80 0.85 0.90 0.95 1.00
Figure 6: Uncertainty on power factors (%) coming from UO2MB.
in the core centre is responsible for the decrease of the associated UO2MB propagated uncertainty in this area.
4. Computation of Simultaneous Nuclear
Data and Manufacturing Data Uncertainty
Propagation
The total propagated uncertainty coming from both nuclear data (fission yield and cross sections) and manufacturing data is obtained by applying the process previously described in [8, 9]. The covariance matrices used are the same as those used in [9] (read [14, 15] for fission yields and [11, 16–18] for cross sections). The results obtained by the propagation are described for the three parameters: reactivity, power factors, and isotopic concentrations.
Science and Technology of Nuclear Installations 7 Bias (pcm) Uncertainty (pcm) 4e + 04 2e + 04 6e + 04 8e + 04 1e + 05 0e + 00 (MW·d/t) −200 0 200 400 600 Re ac ti vi ty uncer ta in ty (p cm)
Figure 7: Uncertainty on the reactivity during depletion (pcm at 1𝜎).
4.1. Reactivity. For the reactivity (cf. Figure 7), the total uncertainty is mainly the uncertainty propagated from nuclear data as the manufacturing uncertainties propagation is very low. So, the uncertainty is the result of fission yield and cross section uncertainty propagation. The total uncertainty coming from nuclear data and technological data is here starting around 400 pcm at the beginning of life of the reactor
core. It increases during the life to reach 600 pcm at 1𝜎
at 100,000 MW⋅d/t. As detailed in [9] the uncertainty on reactivity coming from fission yield is around 120–170 pcm
at1𝜎 from some tenth of MW⋅d/t. This has the particularity
to modify the bent shape of the curve at the beginning of life. The observed bias is negligible and can come from the mesh differences between the input data or the Monte Carlo estimator convergence. At the end of life, the cross section uncertainties are the major contributors to the total reactivity uncertainty, the fission yield uncertainty being responsible for about 20% of the total.
4.2. Power Factors. The power factors map uncertainties are principally caused by the UO2MB parameter except at the core-reflector interface. We observe in Figure 8 at the
beginning of life an uncertainty of 1.8% at1𝜎 for the fuel at
the interface, which corresponds to the value already found in [9], that is, without technological data. When one moves away from this interface, the uncertainty drops significantly
for reaching 1.0% at 1𝜎, which is the value coming from
UO2MB only, the propagated uncertainty from nuclear data being almost zero in this area. We showed in [9] that nuclear
data uncertainty propagation gives 0.6% at 1𝜎 in the core
centre and that fission yields were negligible for power fac-tors uncertainties. During the depletion process, the power factor uncertainty decreases everywhere and converges to the UO2MB value. 0 MW·d/t 0.8 1.0 1.2 1.4 1.6 1.8 0.7 0.8 0.9 1.0 1.1 100,000 MW·d/t
Figure 8: Uncertainty on power factors (% at1𝜎).
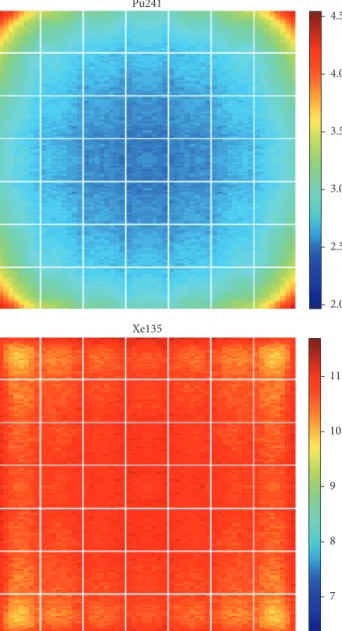
4.3. Isotopic Concentrations. For the isotopic concentrations, no clear trend can be extracted from the results. The next figures reproduce cumulated propagated uncertainties for several isotopic concentrations. Some present an uncertainty coming principally from nuclear data while others come from manufacturing data. We showed in [9] that propagated nuclear data uncertainties on xenon concentration reached
8% at 1𝜎. In Figure 9, the total uncertainty (taking into
account nuclear data and manufacturing data) is increased, demonstrating that manufacturing uncertainties induce an additional uncertainty on xenon isotopic concentration.
However, for 239Pu and 149Sm build-ups (Figure 10), the
uncertainties are slightly reduced, indicating that negative correlations are generated in the calculation by
manu-facturing data and nuclear data perturbation. For 235U,
Figure 11 shows an important heterogeneous uncertainty, essentially coming from UO2MB, hence from manufacturing
Xe135 Pu241 2.0 2.5 3.0 3.5 4.0 4.5 7 8 9 10 11
Figure 9: Uncertainty on local isotopic concentrations for some Pu241 and Xe135 at 48000 MW⋅d/t (% at 1𝜎).
uncertainty. The uncertainties on155Gd and241Pu are also
presented as they are important.
Table 1 summarizes some major results obtained for isotopic concentration uncertainties as a function of the location.
5. Conclusions
A methodology for manufacturing uncertainty propagation based on Monte Carlo sampling has been presented and tested on a MTR benchmark. An adequate use of the manu-facturer information enables simulating different realisations of the core. Those realisations enable getting estimators of standard deviation for different neutronics parameters such as reactivity, power factors, and local isotopic concentrations. Two manufacturing parameters are propagated in the study.
Sm149 Pu239 1.0 1.5 2.0 2.5 3.0 0.9 1.0 1.1 1.2 1.3 1.4
Figure 10: Uncertainty on local isotopic concentrations for some Sm149 and Pu239 at 48000 MW⋅d/t (% at 1𝜎).
Table 1: Summary of isotopic concentrations uncertainties.
Position isotope Core centre Core periphery
Pu241 2,0% 4,0–4,5% Xe135 11,5% 10,0–11,5% Sm149 3,5% 1,0–1,5% Pu239 1,0–1,1% 1,0–1,1% Gd155 12,0–15,0% 8,0–12,0% U235 0,8–1,2% 0,8–1,2%
One is the UO2mass balance in the fuel and the other is a
geometric characteristic, the fuel plate thickness.
It is shown that the propagation of these manufacturing parameters uncertainties on reactivity is negligible. This comes from the fact that the perturbed core elements are numerous. So, globally for the core, compensations arise and
Science and Technology of Nuclear Installations 9 U235 Gd155 0.8 1.0 1.2 1.4 1.6 2 4 6 8 10 12 14
Figure 11: Uncertainty on local isotopic concentrations for some Gd155 and U235 at 48000 MW⋅d/t (% at 1𝜎).
contribute to reducing the reactivity perturbation, which is a global parameter. As an example, the propagation of a 2,5% uncertainty on the fuel plate thickness, coupled with a 0.2%
uncertainty on the UO2mass balance, induces a combined
effect on the reactivity of less than 20 pcm (10−5Δ𝑘/𝑘) at 1𝜎.
For local parameters, the results are different. The mass balance strongly impacts the power factors map during all the depletion cycle. Although the uncertainties decrease during depletion, because of the fuel consumption, it remains
important (approximately 1% at1𝜎 for local power factors).
More surprisingly, the plate thickness has almost no impact on the power factor. It is principally the induced perturbation on the moderation ratio coming from the thickness perturba-tion, which impacts the power map. This explains the more significant uncertainty at the centre of the fuel assembly.
In a second step, a complete uncertainty propagation of all uncertain data (nuclear data such as cross sections and fission
yields and manufacturing data) through the depletion cycle has been performed to observe the combination of all these uncertainties. It is shown that even if these manufacturing data uncertainties can be neglected for reactivity, there is no clear trend for isotopic concentrations due to the coupling of different sources of uncertainties. For example, contributions
to the135Xe uncertainty during depletion come from both
nuclear data and manufacturing data. From [9], nuclear data
propagated uncertainties were responsible for 8% on135Xe
concentration, for a total propagated uncertainty from both
nuclear data and technological data of 11% at 1𝜎. On the
opposite, 235U is mostly sensitive to manufacturing data
uncertainties and less sensitive to nuclear data. We got (see
[9]) less than 0.1% of propagated uncertainty on235U
con-centration from nuclear data and the present work exhibits a
1.0% at1𝜎, due to both nuclear data and technological data
uncertainties.
Competing Interests
The authors declare that they have no competing interests.
References
[1] B. Iooss and P. Lemaˆıtre, “A Review on global sensitivity analysis methods,” in Uncertainty Management in Simulation-Optimization of Complex Systems, vol. 59 of Operations Research/Computer Science Interfaces Series, pp. 101–122, Springer, Boston, Mass, USA, 2015.
[2] D. L. Allaire and K. E. Willcox, “A variance-based sensitivity index function for factor prioritization,” Reliability Engineering & System Safety, vol. 107, pp. 107–114, 2012.
[3] A. Saltelli, K. Chan, and E. M. Scott, Eds., Sensitivity Analysis, Wiley Series in Probability and Statistics, John Wiley & Sons, Chichester, UK, 2000.
[4] C. Glancy and K. Chase, “A second order method for assembly tolerance analysis,” in Proceedings of the ASME Design Engi-neering Technical Conferences, pp. 12–15, Las Vegas, Nev, USA, September 1999.
[5] M. Pecchia, A. Vasiliev, H. Ferroukhi, and A. Pautz, “Criticality safety evaluation of a Swiss wet storage pool using a global uncertainty analysis methodology,” Annals of Nuclear Energy, vol. 83, pp. 226–235, 2015.
[6] R. B. Malmiry, J.-Y. Dantan, J. Pailh`es, and J.-F. Antoine, “From functions to tolerance analysis models by means of the integration of CTOC with CPM,” in Proceedings of the 1st Seminar of the European Group of Research in Tolerancing, E-GRT, Erlangen, Germany, June 2015.
[7] M. Mazur, Tolerance analysis and synthesis of assemblies subject to loading with process integration and design optimization tools [Ph.D. thesis], School of Aerospace, Mechanical and Manu-facturing Engineering RMIT University, Melbourne, Australia, 2013.
[8] T. Frosio, T. Bonaccorsi, and P. Blaise, “Nuclear data uncer-tainties propagation methods in Boltzmann/Bateman coupled problems: application to reactivity in MTR,” Annals of Nuclear Energy, vol. 90, pp. 303–317, 2016.
[9] T. Frosio, T. Bonaccorsi, and P. Blaise, “Fission yields and cross section uncertainty propagation in Boltzmann/Bateman coupled problems: global and local parameters analysis with a
focus on MTR,” Annals of Nuclear Energy, vol. 98, pp. 43–60, 2016.
[10] D. L. Smith, “Evaluated nuclear data covariances: the journey from ENDF/B-VII.0 to ENDF/B-VII.1,” Nuclear Data Sheets, vol. 112, no. 12, pp. 3037–3053, 2011.
[11] C. De Saint Jean, P. Archier, G. Noguere et al., “Estimation
of multi-group cross section covariances for 235,238U, 239Pu,
241Am,56Fe,23Na and27Al,” in Proceedings of the Conference
on Advances in Reactor Physics—Linking Research, Industry, and Education (PHYSOR ’12), Knoxville, Tenn, USA, April 2012. [12] R. Sanchez, I. Zmijarevi, M. Coste-Delclaux et al., “APOLLO2
Year 2010,” Nuclear Engineering and Design, vol. 42, no. 5, pp. 474–499, 2010.
[13] J. F. Vidal, O. Litaize, D. Bernard, A. Santamarina, and C. Vaglio-Gaudard, “New modeling of LWR assemblies with the APOLLO2 code package,” in Proceedings of the International Conference on Mathematics and Computation (M&C 2007), Monterey, Calif, USA, April 2007.
[14] N. Terranova, O. Serot, P. Archier, V. Vallet, C. De Saint, and M. Sumini, “A covariance generation methodology for fission product yields,” in Proceedings of the 4th International Workshop on Nuclear Data Evaluation for Reactor applications, EPJ Web of Conferences, March 2016.
[15] N. Terranova, O. Serot, P. Archier, C. De Saint Jean, and M. Sumini, “Covariance matrix evaluations for independent mass fission yields,” Nuclear Data Sheets, vol. 123, pp. 225–230, 2015. [16] D. Bernard, L. Leal, O. Leray, A. Santamarina, and C. Vaglio,
“U235 covariance matrix associated with JEFF3.1.1 evaluation,” in Proceedings of the JEF/DOC-1360. JEFF Meeting, Paris, France, December 2010.
[17] C. Vaglio-Gaudard, A. Santamarina, D. Bernard et al., “New
56Fe covariances for the JEFF3 file from the feedback of integral
benchmark analysis,” Nuclear Science and Engineering, vol. 166, no. 3, pp. 267–275, 2010.
[18] C. De Saint Jean, P. Archier, P. Leconte, E. Privas, G. Noguere,
and O. Litaize, “Covariances on239Pu,238U and235U neutron
cross sections with CONRAD code,” in Proceedings of the Workshop NEMEA-7, 2013.
Tribology
Advances inHindawi Publishing Corporation
http://www.hindawi.com Volume 2014
International Journal of
Aerospace
Engineering
Hindawi Publishing Corporation
http://www.hindawi.com Volume 2014
Fuels
Journal ofHindawi Publishing Corporationhttp://www.hindawi.com Volume 2014
Journal of
Petroleum Engineering
Hindawi Publishing Corporation
http://www.hindawi.com Volume 2014
Industrial EngineeringJournal of
Hindawi Publishing Corporation
http://www.hindawi.com Volume 2014
Power Electronics
Hindawi Publishing Corporation
http://www.hindawi.com Volume 2014 Advances in
Combustion
Journal ofHindawi Publishing Corporation
http://www.hindawi.com Volume 2014
Journal of
Hindawi Publishing Corporation
http://www.hindawi.com Volume 2014
Renewable Energy
Submit your manuscripts at
https://www.hindawi.com
Hindawi Publishing Corporation
http://www.hindawi.com Volume 2014
Structures
Journal ofInternational Journal of
Rotating Machinery
Hindawi Publishing Corporation
http://www.hindawi.com Volume 2014
Energy
Journal ofHindawi Publishing Corporation
http://www.hindawi.com Volume 2014
Hindawi Publishing Corporation http://www.hindawi.com
Journal of
Engineering
Volume 2014
Hindawi Publishing Corporation
http://www.hindawi.com Volume 2014
International Journal of
Photoenergy
Hindawi Publishing Corporation
http://www.hindawi.com Volume 2014
Nuclear Installations
Science and Technology ofHindawi Publishing Corporation
http://www.hindawi.com Volume 2014
Solar Energy
Journal of Hindawi Publishing Corporationhttp://www.hindawi.com Volume 2014
Wind Energy
Journal ofHindawi Publishing Corporation
http://www.hindawi.com Volume 2014
Nuclear Energy
International Journal ofHindawi Publishing Corporation
http://www.hindawi.com Volume 2014
High Energy PhysicsAdvances in
The Scientific
World Journal
Hindawi Publishing Corporation
http://www.hindawi.com Volume 2014
View publication stats View publication stats