HAL Id: cea-02339665
https://hal-cea.archives-ouvertes.fr/cea-02339665
Submitted on 4 Nov 2019
HAL is a multi-disciplinary open access
archive for the deposit and dissemination of
sci-entific research documents, whether they are
pub-lished or not. The documents may come from
teaching and research institutions in France or
abroad, or from public or private research centers.
L’archive ouverte pluridisciplinaire HAL, est
destinée au dépôt et à la diffusion de documents
scientifiques de niveau recherche, publiés ou non,
émanant des établissements d’enseignement et de
recherche français ou étrangers, des laboratoires
publics ou privés.
Effect of ballistic damage in UO_2 samples under ion
beam irradiations studied by in situ Raman spectroscopy
G. Gutierrez, Claire Onofri, S. Miro, M. Bricout, F. Leprêtre
To cite this version:
G. Gutierrez, Claire Onofri, S. Miro, M. Bricout, F. Leprêtre. Effect of ballistic damage in UO_2
samples under ion beam irradiations studied by in situ Raman spectroscopy. Nuclear Instruments and
Methods in Physics Research Section B: Beam Interactions with Materials and Atoms, Elsevier, 2018,
434, pp.45-50. �10.1016/j.nimb.2018.08.010�. �cea-02339665�
1
Effect of ballistic damage in UO2 samples under ion beam irradiations studied by in situ Raman
spectroscopy
G. Gutierrez1*, C. Onofri2, S. Miro1, M. Bricout1, F. Leprêtre1
1DEN-Service de Recherches de Métallurgie Physique, CEA, Paris-Saclay Univ., F-91191 Gif-sur-Yvette, France
2
CEA, DEN, DEC, F-13108 St Paul lez Durance, France.
* corresponding author: gaelle.gutierrez@cea.fr
Abstract
The damage induced in uranium dioxide (UO2) during ion irradiation at low energy was studied by
micro-Raman spectroscopy. Polycrystalline UO2 samples were irradiated by 0.9-MeV I, 2-MeV Au at
25°C and by 4-MeV Kr ions at -160°C in a wide range of fluence. In situ Raman measurements reveal
similar spectra evolution no matter the ion beam used. The T2g band centred at 445 cm-1 related to the
fluorine structure reveals a broadening with the irradiation damage increase. In addition, several bands
ranging from 500 to 700 cm-1, which are attributed to sub- or sur-stoichiometric structural defects, are
observed at the first time of irradiation. Their intensities rise up with the irradiation fluence increase to
a similar asymptotic relative values for all the irradiation conditions. The obtained Raman kinetics are
compared with data from the literature on the microstructure evolution observed by Transmission
Electronic Microscopy (TEM) and on the fraction of displaced atoms determined by Rutherford
2
Intro
Raman spectroscopy is an efficient technique to determine the structural evolution in materials under irradiation. Nuclear fuel [1], cladding materials [2] or matrices for high level nuclear waste management [3] have been successfully characterized by this technique. Radioactive fuel samples [4, 5] as well as ion beam irradiated uranium dioxide (UO2) samples [6,7] can be studied and compared.
Several papers have investigated the Raman spectra evolution of UO2 after ion beam irradiation [1, 6,
7]. In addition to the standard T2g band, additional bands in the range of 500 to 700 cm-1 are observed
after sample oxidation or are induced by ion irradiation performed under vacuum [1, 4-7]. At 575 cm-1, the LO Raman-forbidden mode in the perfect fluorite structure becomes active by the presence of disorder in the crystal due to a breakdown in the selection rules [1, 8]. Two other bands at around 520 and 630 cm-1 denoted as U1 and U3 could be associated with sub-stoichiometry UO2-x and with
structural defects in the cuboctahedral symmetry of the interstitial oxygen in hyper-stoichiometric UO2,
respectively [7, 9, 10].
The present study aims to investigate the effect of ballistic damage generated by ion beam irradiations in UO2. The damage kinetics of polycrystalline samples under ion beam irradiation was monitored in
real time by using the JANNuS (Joint Accelerators for Nanoscience and Nuclear Simulation) platform in Saclay, France. In situ Raman setup with a frequency-doubled Nd: YAG (532 nm) laser is coupled with a triple beam chamber [11]. Samples were irradiated with low energy ions in order to determine the Raman spectra evolution under ballistic damage. Experiments have been performed at room temperature (25°C) with I ions at an energy of 0.9 MeV and with Au ions at 2 MeV. A complementary irradiation at low temperature (-160°C) has been also carried out with Kr ions at an energy of 4 MeV. To follow in real time the radiation damage evolution, in situ Raman spectra have been recorded for different irradiation fluences.
Experimental procedures
UO2 polycrystalline pellets with an average grain size of 7.6 µm were cut in discs (thickness: 500 µm)
and polished on one side. An annealing at 1400°C during 4 h under an Ar-H2 (5%) was performed in order to remove the damage induced by polishing. Pellet density has been measured to be around 10.74 g.cm−3 (∼98 % of densification).
The irradiations were carried out at JANNuS-Saclay facility with 0.9 MeV I ions and 2 MeV Au ions at a controlled temperature of 25°C and with 4 MeV Kr ions at -160°C. The irradiations were performed
3
under a vacuum lower than 10-7 mbar in order to prevent any oxidation. Irradiation conditions and parameters calculated using the SRIM code are reported in Tab.1 [12].
The JANNuS facility also includes the possibility of in situ Raman monitoring during irradiation. The experimental set up is described in [11]. Raman spectra were recorded in broad wave-number range between 200 and 900 cm-1 for virgin and irradiated samples using an Invia Reflex Renishaw spectrometer coupled with a Leica microscope. A laser power lower than 1 mW was used in order to avoid oxidation during the analysis. In situ Raman measurements after beam shut off were carried on irradiated samples with a frequency-doubled Nd:YAG (532 nm) laser and a 2400 groove/mm grating. The Raman spectrometer has been calibrated by using silicon monocrystalline samples. Raman spectra were recorded during 120 s at each step of irradiation fluence. Raman spectrum can be recorded during ion irradiation but, in order to obtain representative data avoiding any additional evolution of the microstructure, the ion beam is stopped during the acquisitions.
The fitting module of the Wire Raman spectroscopy software (Renishaw) was used for the spectra simulation. A combination of Lorentzian (often used for crystal) and Gaussian line shape (expected for disordered materials) called Voigt profiles was used. The accuracy on band position deduced from spectrum simulation is determined at ± 1 cm−1.
Results
The figure 1 presents the Raman spectra between 300 and 900 cm-1 in situ recorded on UO2 samples
irradiated with 2 MeV Au ions at 25°C for fluences ranging from 4.7×10¹² to 1.2×10¹⁶ Au.cm-2. Before irradiation (spectrum 0 in black), we observed a band centred at 445 cm-1 assigned to the triply degenerate Raman active mode (T2g) commonly Raman active for all the fluorine structures [14]. This
band is relied to the breathing vibration of oxygen atoms around the uranium atoms in the crystalline structure. In the 500 and 700 cm-1 range, we also remark one intense band at 575 cm-1 and two bands with a smaller intensity at 520 and 630 cm-1. The band at 575 cm-1 is associated to the first order T1U
LO scattering mode [8]. This mode is Raman-forbidden in the perfect fluorite structure and becomes active by the presence of disorder in the crystal due to a breakdown in the selection rules [1, 8]. The assignment of 520 and 630 cm-1 bands is less obvious. The first one denoted as U1 is associated with sub-stoichiometry UO2-x [1]. The third band denoted U3 is assigned to structural defects in the
4
LO, U3) is already observable before irradiation highlighting the presence of defect in the virgin samples due to the preparation or to a surface oxidation [15]. As shown on Fig.1, from our first fluence (4.7×10¹² Au.cm-2) to 1014 Au.cm-2, the intensity of T2g band decreases and a broadening is observed.
In addition, the triplet bands in the range of 500-700 cm-1 increases. The U1 and U3 bands less marked on the virgin samples are more intense after irradiation. Then, from an irradiation fluence of 1014 Au.cm-2, the Raman spectra do not seem to evolve any more. We must note that our Raman measurements have been performed with a 532 nm wavelength laser. In these analysis conditions, the LO band is much more intense compared to the U1 and U3 bands due to a resonance effect [16]. The U1 and U3 evolutions is more difficult to follow especially for low damage level. For that reason, in the following part, the triplet band in the 500 and 700 cm-1 range will be discussed together and referred as the defect massif.
The Raman spectra have also been in situ recorded for UO2 samples irradiated at 25°C with 0.9 MeV I
ions and at -160°C with 4 MeV Kr ions. We observed a similar evolution with an increase of the defect massif area at first step of irradiation and a decrease of T2g band with a broadening. In order to
compare the results obtained from the different irradiations, the line width (FWHM) of T2g band,
characteristic to the undisturbed fluorite lattice, is reported on Fig. 2.a as a function of the maximum displacement per atoms (dpa). It exhibits similar evolution for all the irradiated samples. Below 0.03 dpa, no significant linewidth evolution is observed. After an irradiation inducing 0.03 dpa, a broadening occurs and increases linearly with the damage. Then a stabilization at an asymptotic relative value of around 30 cm-1 is shown. In addition, a small T2g shift (<1.5 cm
-1
) to the lower frequencies is noticed for all the irradiations.
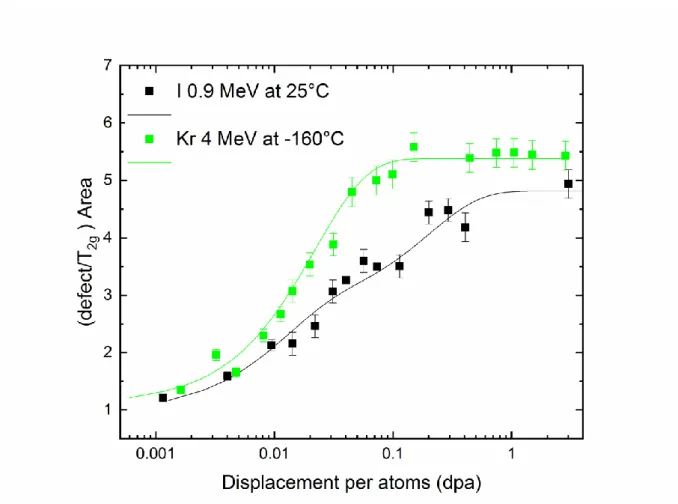
Since the defect massif is associated to the structural disorder, the ratio between its area and T2g band
area describes the damage build-up kinetics in UO2 for different irradiation conditions. Fig. 2.b
presents this ratio as a function of the maximum dpa. We observed that, as soon as the UO2 samples
are submitted to irradiation damage (first step at 0.001 dpa), the band intensity increase for all the curves. We notice a shift of massif defect evolution between the samples irradiated at 25°C and the one at -160°C. It indicates that the area increase occurs in a faster way for the irradiation performed at low temperature (Kr) than for the ones at room temperature (I, Au). A similar asymptotic relative value is achieved for all the irradiation conditions but at different damage level according to the irradiation temperature. The evolution of defect massif area is well reproduced by the multiple step damage
5
accumulation (MSDA) model [17]. The evolutions inducing during I ions irradiation at 25°C and Kr ions irradiation at -160°C have been fitted by the following equation (Fig. 3):
1 1 , 1 1 1, 1 exp( ( )) exp 1 exp
n i n n sat n D n k k k i i sat i D D f G f G f
(1) where fD,i satis the level of damage at saturation, n is the number of steps required for the achievement of the total disordering process, Φi is the threshold ion fluence of the ith step, and σi the disordering cross-section at the ith step. G corresponds to the Heaviside function H multiplied by its argument. In the MSDA model, the damage accumulation results from atomic rearrangements steps induced by microscopic and/or macroscopic events [17]. Each step is correlated to a new defect configuration, which is generated by the damage accumulation. In our case, the damage build-up is accumulated via a two-step mechanism (n = 2 in Eq. (1)): the first step up to 0.065 and 0.0054 dpa at an irradiation temperature of 25°C and -160°C, respectively, and the second for higher value. The first step occurs for a very small amount of damage level and is shorter for the lower irradiation temperature. Concerning the second step, it is interesting to note that a higher disordering cross-section (σ2) is determined for an irradiation at a temperature of -160°C (12.7 nm2) than at 25°C (3.7 nm2). These results indicate a faster increase of level damage for an irradiation temperature of -160°C. The level of damage at saturation (fD,2
sat
) decreases from 5.3 at 25°C down to 4.8 at -160°C. However, due to our resolution limit, this difference is not quite significant. Thus, the first step observed for very low damage level, should be, for example, the consequence of point defect evolving in clusters on the Raman spectra. However, complementary experiments are required to conclude on this point.
Discussion
The results from the different irradiation experiments highlight that, during an irradiation favouring the ballistic damage at 25°C, one damage level (dpa) seems to induce one Raman spectra. Indeed, we have observed that a broadening and an intensity decrease of T2g band occur for all the performed
irradiations. The intensity loss of the T2g band indicates deviations from the perfect cubic fluorite
structure [9]. In addition, the disorder arising from irradiation induces the relaxation of selection rules allowing a greater range of vibrational modes to contribute to Raman scattering. This could be experimentally observed by an asymmetrical broadening of the Raman band [18, 19]. We do also measure a shift to lower frequencies with a value closed to our resolution limit (<1.5 µm). Similar T2g
red-shift was reported for UO2 samples irradiated with He 2+
6
[7, 5]. It could highlight the defects formation (point defects, dislocations or voids) and a lattice swelling. This point will be discussed in the following part by comparing the evolution kinetics of different defects obtained by other characterizations (TEM and RBS-C).
In addition, the defect massif area, correlated with the damage build-up, increases with the irradiation doses and then reaches saturation at the dose of around 0.2-0.4 dpa (Fig. 2). The cross section analysis of an irradiated samples with He ions at 25 MeV by Raman spectroscopy highlights also a T2g broadening correlated with a grow up of U1, LO and U3 bands area when the ballistic stopping
power becomes predominant compared to the electronic one [7].The Raman spectra comparison between the irradiations performed at 25°C and -160°C indicates a faster increase of level damage for an irradiation at -160°C. It could be explained by the freezing of generated defects at low temperature and a higher recombination during the irradiation at 25°C [20]. However, a stabilization at a closed asymptotic value of T2g linewidth and defect massif area were observed. This increase of defect massif
was also reported in literature after irradiations with Kr ions at an energy of 0.2 MeV [6] and of 4 MeV [21].
Indeed, after an irradiation at 500°C with Kr ions at an energy of 4 MeV, Onofri et al. reported an increase of defect massif area up to 6 times higher than for the virgin one after an irradiation fluence of 3.1016 Kr.cm-2 (i.e. 90 dpa) then a saturation is reached for higher fluences [21]. This ratio difference is closed to the one obtained in our study (around 5 times compared to the virgin samples). It seems to show that no matter the irradiation temperature the area ratio between defect massif and T2g band
stabilizes at a quite similar value indicating a similar measured disordered level or saturation of Raman signal. However, as no Raman measurement has been performed at lower Kr irradiation fluence by [21], we cannot conclude if this saturation is achieved for a higher damage level at a higher irradiation temperature.
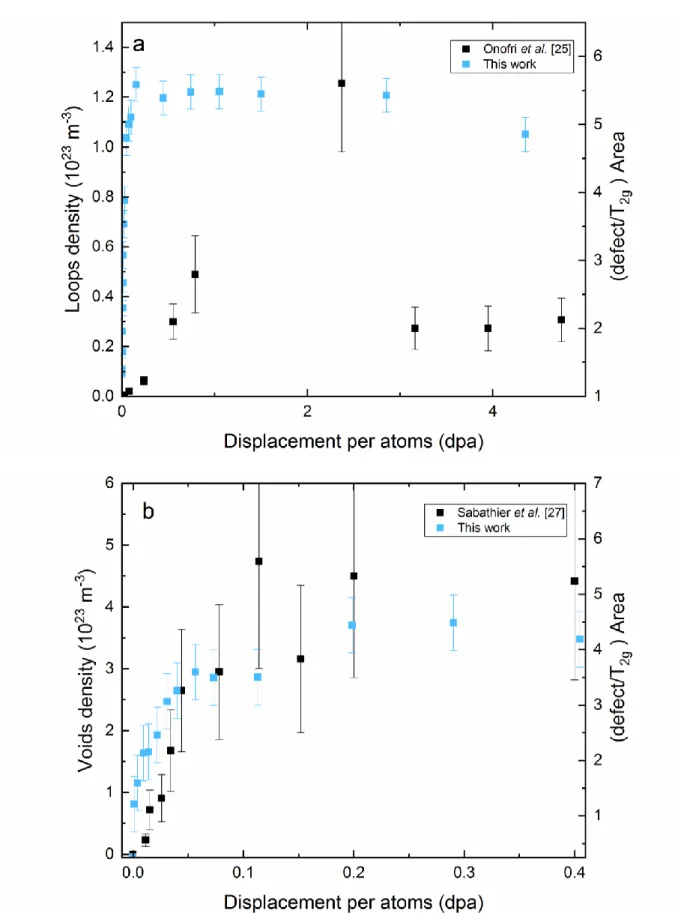
Point defects generated by irradiation can cluster forming extended defects such as voids and dislocation loops. Several studies report the nucleation of dislocations loops at very low damage level [22-26]. For instance, Onofri et al. have in situ observed the first dislocation loops nucleation under irradiation at -180°C with 0.39 MeV Xe ions from a damage level of around 0.008 dpa [25] (Fig. 4.a). The loop density increases with the irradiation fluence up to a saturation value, which depends on the temperature [22, 23, 25]. Then, a decrease occurs due to the formation of dislocation line. Lastly, the loop density remains constant. Thus, the evolution kinetics of dislocations is very different from the
7
one observed in the current work (Fig. 4.a). Simultaneously to the dislocation formation, voids nucleation was observed at low damage level too [27-29]. The bubble/cavity density increases in the first time of the irradiation and then reaches a constant value of 2 - 4 × 1024 m-3. The voids generated in UO2 samples under irradiation with Au ions at 4 MeV at 25°C and observed in situ by Sabathier et
al. [27] were compared to our Raman spectra change. Fig. 4.b gathers the value of defect massif area
during the 0.9 MeV I ions irradiation at 25°C and the void density as a function of the generated dpa. Quite similar evolution is shown by the both techniques. The first voids observation is noticed at low damage level (0.03 dpa) which is correlated with the increase of massif defect area at our first irradiation step (0.001 dpa). Then, no significant evolution of the defect massif or of the void density was observed after an irradiation inducing around 0.3 dpa.
Lastly, Rutherford Backscattering Spectroscopy in Channelling mode (RBS-C) can characterize the fraction of displacement atoms (fD) during irradiation. Fig. 5 presents the damage kinetics obtained by
RBS-C during 0.5 MeV La ions irradiation at 25°C as function as the maximum dpa [30]. The damage fraction increase occurs for values higher than 4 dpa whereas the value of defect massif area during the 0.9 MeV I ions increases after a radiation damage of 0.03 dpa. It clearly indicates that the two evolutions are not similar. However, for UO2 samples, ion channelling is able to measure disorder on
the U sub-lattice and O sub-lattice but with different cross section. Indeed, by using the
16
O(4He,4He)16O resonant reaction with He ions at an energy of 3.085 MeV, the backscattering event of 4He on O sub-lattice is increased by a factor of 15 compared to standard Rutherford elastic backscattering [31]. However, the backscattering event of 4He on U sub-lattice, proportional to Z2, remains around 7 times higher than for O sub-lattice. The damage evolution obtained by RBS-C analysis is more sensitive to the U than to the O sub-lattice disorder. As we clearly observed different evolution with Raman kinetics, the changes on Raman spectra seems to be more sensitivity to damage on the O sub-lattice in good agreement with the literature where the U1 and U3 bands are correlated with oxygen sub- or sur-stoichiometry, respectively [7,10, 32].
Conclusions
In situ Raman coupled with ion irradiation at low energy have been carried out on uranium dioxide.
The
results confirmed that polycrystalline samples were not amorphized by nuclear damage even for very high defect level (200 dpa). Quite similar maximum asymptotic value of the defect massif area and of T2g band width was found for all the investigated projectiles. Only the shape evolution of defect8
massif area change with the irradiation temperature. Indeed, the saturation is achieved at a smaller defect level for low temperature (-160°C) than at 25°C. The study of the damage kinetics evolution induced by ion irradiations shows a good match between voids nucleation and Raman spectra changes (massif of defects). On the contrary, the evolutions kinetics of dislocations and of damage fraction obtained by RBS-C are very different from the one observed in the current work. It should indicate that the defect massif increase is linked to the formation of point defect and defect cluster evolving in the void nucleation. Future work will aim at correlating the microstructural evolution by TEM and the Raman spectra change in uranium dioxide.
ACKNOWLEDGMENTS
The staffs of the JANNUS facilities at Saclay are sincerely acknowledged for their assistance during ion irradiations.
9
Reference
[1] L. Desgranges, G. Guimbretière, P. Simon, C. Jegou, R. Caraballo, Nucl. Instrum. Meth. Phys. Res. Sect. B Beam Interact. with Mat. Atoms 315 (2013) 169.
[2] J.-M. Costantini, A. Kahn-Harari, F. Beuneu, F. Couvreur, J. Appl. Phys., 99 (2006) 123501.
[3] H.M. Anamul, M. Toulemonde, C. Jegou, S. Miro, Y. Serruys, S. Bouffard, S. Peuget, Scien. Rep. 6 (2016) 30191.
[4] J.M. Elorrieta, D. Manara, L.J. Bonales, J.F. Vigier, O. Dieste, M. Naji, R.C. Belin,V.G. Baonza, R.J.M. Konings, J. Cobos, J. Nucl. Mater. 495 (2017) 484.
[5] Z. Talip, S. Peuget, M. Magnin, M. Tribet, C. Valot, R. Vauchy, C. Jégou, J. Nucl. Mater. 499 (2018) 88.
[6] P.R., Graves, App. Spect., 44 (1990) 1665.
[7] G. Guimbretière, L. Desgranges, A. Canizares, G. Carlot, R. Caraballo, C. Jégou, F. Duval, N. Raimboux, M.R. Ammar, P. Simon, Appl. Phys. Lett. 100 (2012) 251914.
[8] T. Livneh, J. Phys. Condens. Matter 20 (2008) 85202.
[9] H. He, D. Shoesmith, Phys. Chem. Chem. Phys. 12 (2010) 8108.
[10] L. Desgranges, G. Baldinozzi, P. Simon, G. Guimbretière, A. Canizares, J. Raman Spectrosc. 43 (2012) 455.
[11] S. Miro, E. Bordas, L. Thomé, J.-M. Costantini, F. Leprêtre, P. Trocellier, Y. Serruys, L. Beck, D. Gosset, R. Verlet, J. Huguet-Garcia, M. Tupin, M. Belleil, J. Raman Spectrosc. 47 (2016) 476.
[12] J. F. Ziegler, J. P. Biersack, U. Littmark, in The Stopping and Range of Ions in Solids, (Eds: J. F. Ziegler), Pergamon, New York, 1985, Vol. 1.
[13] J. Soullard, J. Nucl. Mater. 135 (1985) 190.
[14] V.G Keramidas, W.B. White, J. Chem. Phys. 59 (1973) 1561.
[15] L. Desgranges, G. Guimbretière, P. Simon, F. Duval, A. Canizares, R. Omnee, C. Jégou, R. Caraballo, Nucl. Instrum. Methods Phys. Res. Sect. B Beam Interact. Mat. Atoms 327 (2014) 74. [16] R. Mohun, L. Desgranges, J. Léchelle, P. Simon, G. Guimbretière, A. Canizarès, F. Duval, C. Jegou, M. Magnin, N. Clavie, N. Dacheux, C. Valot, R. Vauchy, Nucl. Instrum. Methods Phys. Res. Sect. B Beam Interact. Mat. Atoms 374 (2016) 67.
[17] J. Jagielski, L. Thomé, Appl. Phys. A, 105 (2009) 073513.
10
[19] X. Huang, F. Ninio, L.J. Brown, J. Appl. Phys., 77 (1995) 5910. [20] H. Matzke, A. Turos, Nucl. Instrum. Methods Phys. Res. Sect. B Beam Interact. Mat. Atoms 46 (1990) 117.
[21]C. Onofri, C. Sabathier, H. Palancher, G. Carlot, S. Miro, Y. Serruys, L. Desgranges, M. Legros, Nucl. Instrum. Methods Phys. Res. Sect. B Beam Interact. Mat. Atoms 374 (2016) 51.
[22] L. F. He, M. Gupta, C. A. Yablinsky, J. Gan, M. A. Kirk, X. M. Bai, J. Pakarinen, T. R. Allen, J. Nucl. Mater. 443 (2013) 71.
[23] C. Onofri, C. Sabathier, C. Baumier, C. Bachelet, H. Palancher, M. Legros, J. Nucl. Mater. 482 (2016) 105.
[24] L. F. He, J. Pakarinen, M. A. Kirk, J. Gan, A. T. Nelson, X. M. Bai. A. El-Azan, T. R. Allen, Nucl. Instrum. Methods Phys. Res. Sect. B Beam Interact. Mat. Atoms 330 (2014) 55.
[25] C. Onofri, C. Sabathier, C. Baumier, C. Bachelet, H. Palancher, B. Warot-Fonrose, M. Legros, Influence of exogenous xenon atoms on the evolution kinetics of extended defects in polycrystalline UO2 using in situ TEM, will be submitted to JNM.
[26] Y. Haddad, L. Delauche, A. Gentils, F. Garrido, Nucl. Instrum. Methods Phys. Res. Sect. B Beam Interact. Mat. Atoms in Press https://doi.org/10.1016/j.nimb.2017.12.019.
[27] C. Sabathier, L. Vincent, P. Garcia, F. Garrido, G. Carlot, L. Thome, P. Martin, C. Valot Nucl. Instrum. Methods Phys. Res. Sect. B Beam Interact. Mat. Atoms 266 (2008) 3027.
[28] C. Sabathier, G. Martin , A. Michel , G. Carlot , S. Maillard , C. Bachelet , F. Fortuna, O. Kaitasov , E. Oliviero, P. Garcia, Nucl. Instrum. Methods Phys. Res. Sect. B Beam Interact. Mat. Atoms 326 (2014) 247.
[29] A. Michel, C. Sabathier, G. Carlot, O. Kaïtasov, S. Bouffard, P. Garcia, C. Valot, Nucl. Instrum. Methods Phys. Res. Sect. B Beam Interact. Mat. Atoms 272 (2012) 218.
[30] T. H. Nguyen, F. Garrido, A. Debelle, S. Mylonas, L. Nowicki, L. Thomé, J. Bourçois, J. Moeyaert, Nucl. Instrum. Methods Phys. Res. Sect. B Beam Interact. Mat. Atoms 326 (2014) 264.
[31] H.S. Cheng, H. Shen, J. Tang, F. Yang, Nucl. Instrum. Methods Phys. Res. Sect. B Beam Interact. Mat. Atom 83 (1993) 449.
11
TABLE Table 1 Energy ( MeV) Irradiation temperature (°C) Flux (at.cm-2.s-1) Rp (nm) Maximum dpa at 1015 at.cm-2 I 0.9 25 1×10¹¹ 150 7.5 Au 2 25 5×10¹¹ 210 11.5 Kr 4 -160 5×10¹¹ 420 3Tab. 1: Irradiation conditions used during this study and simulated by SRIM software [12]. The projected range (Rp), the maximum displacement per atoms (dpa) have been simulated for a density
of 10.74 g.cm−3, in full cascade mode with threshold displacement energies of 20 and 40 eV for the O and U sub-lattices, respectively [13].
12
FIGUREFigure 1
13
Figure 2Fig. 2: (a) The T2g width evolution and (b) the ratio between defect massif area and T2g band area after
irradiation with 0.9 MeV I ions and 2 MeV Au ions at 25°C. The hatched rectangles represent the reference T2g width of virgin UO2 before irradiation and the initial ratio.
14
Figure 3Fig. 3: The ratio between defect massif area and T2g band area after irradiation with 0.9 MeV I ions
15
Figure 4Fig. 4: a) Evolution of defect massif area obtained by Raman during 4 MeV Kr irradiation at -160°C compared to the loops density determined by TEM observations during 0.39 MeV Xe irradiation at
-16
180°C as function of the displacement per atoms [25]. b) Evolution of defect massif area obtained by Raman during 0.9 MeV I irradiation compared to the voids density determined by TEM observations during 4 MeV Au ions irradiation at 25°C as function of the displacement per atoms [27].
17
Figure 5Fig. 5: Evolution of defect massif area obtained by Raman during 0.9 MeV I irradiation compared to fraction of randomly displaced atoms determined by RBS-C during 0.5 MeV La ions irradiation as function of the displacement per atoms [30].
![Tab. 1: Irradiation conditions used during this study and simulated by SRIM software [12]](https://thumb-eu.123doks.com/thumbv2/123doknet/13052016.383114/12.892.200.692.203.329/tab-irradiation-conditions-used-study-simulated-srim-software.webp)