HAL Id: cea-02492578
https://hal-cea.archives-ouvertes.fr/cea-02492578
Submitted on 27 Feb 2020HAL is a multi-disciplinary open access archive for the deposit and dissemination of sci-entific research documents, whether they are pub-lished or not. The documents may come from teaching and research institutions in France or abroad, or from public or private research centers.
L’archive ouverte pluridisciplinaire HAL, est destinée au dépôt et à la diffusion de documents scientifiques de niveau recherche, publiés ou non, émanant des établissements d’enseignement et de recherche français ou étrangers, des laboratoires publics ou privés.
F. Wang, T. Chaudat, C. Piedagnel, G. Nahas, G. Guilhem, M. Vassaux, B.
Richard
To cite this version:
F. Wang, T. Chaudat, C. Piedagnel, G. Nahas, G. Guilhem, et al.. Seismic behavior of composite concrete floor without earthquake design provisions part 2: numerical analyses. SMiRT 23 - The 23rd International Conference on Structural Mechanics in Reactor Technology, Aug 2015, Manchester, United Kingdom. �cea-02492578�
Transactions, SMiRT-23
Manchester, United Kingdom - August 10-14, 2015 Division V
SEISMIC BEHAVIOR OF COMPOSITE CONCRETE FLOOR WITHOUT
EARTHQUAKE DESIGN PROVISIONS
PART 2: NUMERICAL ANALYSES
Fan Wang1, Thierry Chaudat1, Corine Piedagnel2, Georges Nahas2, Gilbert Guilhem2, Maxime Vassaux3, Benjamin Richard3
1
Research engineer, CEA, DEN, DM2S, SEMT, Laboratoire d’Etudes de Mécanique Sismique, F-91191 Gif-sur-Yvette, France
2
Engineer, IRSN/PSN-EXP/SES/BEGC,
BP
17, 92262 Fontenay aux Roses, France3
Research engineer, CEA, DEN, DM2S, SEMT, Laboratoire d’Etudes de Mécanique Sismique, F-91191 Gif-sur-Yvette, France
ABSTRACT
In some existing nuclear facilities in France, composite concrete floors were designed to support only gravity loads. Therefore those slabs were constructed without earthquake design provisions. In order to assess the structural behaviour and seismic margins of such slabs with respect to construction codes used in France for existing buildings, CEA and IRSN have launched a research program which is divided into two parts: (1) experimental tests performed on two full scale identical models, (2) numerical analyses of the test results using the finite element method.
The experimental program has been described in a separate paper (Part 1: Experimental program) in this conference. This second paper is dedicated to the numerical investigations carried out mainly after the experimental campaigns. Using the finite element code Cast3M developed at CEA/Saclay, 3D finite element modelling for the test models is performed. Both linear elastic and nonlinear analyses are conducted under static (for Model-1) and dynamic (for Model-2) loads and the results are compared with the experimental results. A new robust concrete model recently developed in CEA is used for the nonlinear analyses. In performing the dynamic analyses, a finite element model of the shaking table is also incorporated to account for its coupling effect with the test model.
INTRODUCTION
In some existing French nuclear facilities built before 1990, floors are composed of a cast in-place slab poured on precast reinforced (or pre-stressed) concrete planks. This type of composite floors has often been designed under uniformly distributed gravity loads. Therefore, constructive arrangements are not satisfactory to resist seismic loads. In order to assess the actual seismic behaviour of such composite floors, CEA and IRSN have carried out experimental tests performed on two full scale identical models representing a typical composite floor. The first model (Model-1), tested at GINGER CEBTP, was subjected to a mono-axial in-plane static cyclic loading up to collapse. The second model (Model-2), tested at CEA/Saclay on the AZALEE shaking table, was subjected to a series of increasing bi-axial horizontal seismic excitations. These experimental campaigns have been described in a separate paper (Part 1: Experimental program) in this conference. They have shown satisfactory seismic margins with respect to construction codes used in France for existing building (PS92 and more recently Eurocode 8 - Part 3), despite the lack of seismic provisions in their initial design.
Numerical investigations have been carried out in order to assess and simulate the seismic behaviour of the floors. 3D finite element modelling for the test models was performed using the finite element code
Cast3M developed at SEMT CEA/Saclay. Both linear elastic and nonlinear analyses were conducted under static (for Model-1) and dynamic (for Model-2) loadings. This paper is dedicated to the presentation of these numerical analyses. It consists of the following parts:
Finite element modelling of the test models,
Linear and nonlinear analyses of Model-1, tested under static loadings, Linear and nonlinear analyses of Model-2, tested on the shaking table.
A new robust concrete model recently developed in CEA was used for the nonlinear analyses (Vassaux, 2015). In performing the dynamic analyses, a finite element model of the AZALEE shaking table has also been incorporated to the system to account for its coupling effect with the test model.
FINITE ELEMENT MODELLING OF THE FLOOR MODELS,
Code Cast3M
The numerical investigations presented were performed using a general purpose finite element computer code Cast3M, developed in the Service of mechanical and thermal studies (SEMT) of the French Atomic Energy Commission (CEA). Its scope covers mechanical linear elastic problems in statics and dynamics, thermal and heat transfer problems, material and geometric nonlinear problems. The computer code is presented in detail on its website: http://www-cast3m.cea.fr . It can be downloaded from the website and used for free for research and education purpose.
Finite element mesh
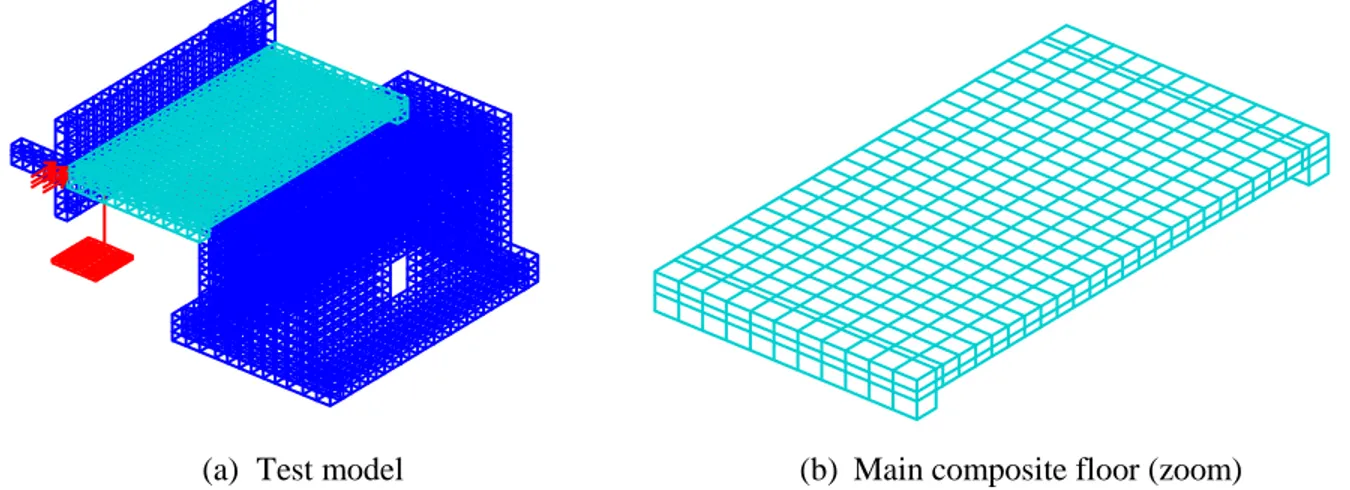
Concrete: Figure 1 shows the 3D finite element mesh generated by Cast3M for the two test models. The concrete of the test model is represented by 2780 8-nodes solid elements. The maximal size of the element is about 20 cm. Figure 1(b) shows in particular the mesh for the floor’s main span which is composed of two layers of elements: the lower layer represents the two parallel precast planks. On the real test models, there was an empty space of 5 mm width between the two planks. Although this empty space is not geometrically modelled here, the two planks are meshed separately and are only linked by the monolithic upper layer which represents the cast-in-place topping slab. In fact, perfect adhesion is considered between the planks and the topping slab in this paper.
(a) Test model (b) Main composite floor (zoom) Figure 1: Finite element mesh: concrete and steel columns
23rd Conference on Structural Mechanics in Reactor Technology Manchester, United Kingdom - August 10-14, 2015 Division V
Steel columns: The two doubly-hinged (top and bottom in both X and Y directions, see figure 2) steel columns supporting the cross-beam are represented by 2-nodes bar elements in figure 1(a). Their fixing plates are modelled by 8-nodes solid elements. These columns are supposed to transfer vertical loads but no horizontal forces. This point has been checked after the shaking table test as the deformation of the columns (IPE160) was carefully measured by a number of strain gauges stuck to each flange of the columns. In fact, the horizontal forces transmitted by the columns due to possible hinge frictions turned out to be totally negligible compared to the inertial forces generated by the additional mass and the mass of the cross-beam.
Figure 2: Hinge used for the steel columns Figure 3: Finite element mesh: Reinforcement Reinforcement: Figure 3 shows the finite element mesh for the reinforcing bars in the test models. As can be seen, only those steels bars that are directly associated with the floor’s main span are explicitly modelled using 2-nodes bar elements (red lines). The mesh represents the D10 deformed bars in the precast planks, the D8 deformed U-form linkage bars in the topping slab and the longitudinal reinforcing bars in the edge-beams. These steel elements are linked to the surrounding concrete elements by an operator in Cast3M (RELA with option ACCROC) by establish displacement continuities between the nodes of the steel elements and that of the concrete.
Apart from the floor’s main span, the rest of the test model has been designed to stay elastic during the experimental test and is considered as such in the numerical analyses. Consequently, reinforcement outside the floor’s main span is not considered in the finite element model for simplicity, as their role is limited to a negligible contribution to the global structure stiffness.
Material properties
In the aim of performing post-test numerical analyses, material properties of the floor models were measured by standard test procedure at GINGER/CEBTP.
Concrete properties: For each of the concrete castings throughout the Model-1 construction, concrete properties were obtained on standard cylindrical specimens (16×32 cm) at the time of the static test. The average compressive strength, the Young’s modulus and the tensile strength are given in Table 1. One can note that the strength of the floor (precast planks and the topping slab) is about 25 MPa as it was aimed in order to represent floors encountered in some existing buildings. The other parts of the model are cast with concretes of different compositions of much higher strength.
Concrete properties of Model-2 were also measured on standard specimens at the approximate time of the shaking table tests. Their values are similar to that given in table 1 and are not shown here.
Reinforcement properties: The same batch of deformed reinforcing bars was used for the construction of both Model-1 and Model-2. Their mechanical properties were obtained from tests performed on the steel bars specimens. The average tensile strength and the ductility of the bars are given in table 2.
Table 1: Average concrete properties, Model-1 Concrete casting Compressive strength
(MPa) Young’s modulus (MPa) Tensile strength (MPa) Caisson: foundation 53,4 25700 4,35
Caisson: lower part 54,1 26800 4,05
Caisson: upper part 41,0 22500 3,2
Precast planks 25,9 19800 3,0
Topping slab 25,4 22900 2,7
Table 2: Average reinforcing steel properties, Model-1 and Model-2 Type of steel
bars Model zone
Yield stress (MPa) Tensile strength (MPa) Elongation (%) D8 Topping slab 517 596 6.7 D10 Precast planks 571 641 9.2 D14 Edge-beams 545 633 10.2 D20 Edge-beams, cross-beam 530 614 11.3
Nonlinear concrete model
Concrete behaviour is reproduced using a phenomenological model based on continuum damage mechanics and plasticity theories. The model, inspired from previous work by Richard et al. (2013) and Sellier et al. (2013), is thoroughly presented in Vassaux (2015).
Constitutive laws associated to the mechanical response of a Representative Volume Element (RVE) are split in two parts:
on one hand, the behaviour related to the continuum part of the RVE, namely the homogenised cohesive material, which can be weakened by the apparition of cracks,
on the other hand, the behaviour related to the cracked part of the RVE, namely the homogenised contact problem induced at the cracks surfaces.
The behaviour of the continuum part of the RVE is described using a scalar isotropic damage model to reproduce the typical stiffness degradation and softening behaviour, well known of quasi-brittle materials such as concrete. The damage model used is derived from Mazars et al. (1989) and Richard et al. (2013) works, and inelastic behaviour has been further enhanced to reproduce tension/compression dissymmetry preserving a unique scalar damage variable.
The behaviour of the cracked part of the RVE is described using regularisation of the Signorini's contact condition assuming a multiple contact problem. Cracks are considered to close progressively, which can be homogenised at the RVE scale using a highly regular non-linear elastic model. Such modelling choice enables the reproduction of progressive stiffness recovery without loss of robustness due to discontinuous constitutive laws. In addition, plasticity theory is introduced to reproduce the consequences of frictional sliding induced at the cracks surfaces, namely hysteresis effect.
23rd Conference on Structural Mechanics in Reactor Technology Manchester, United Kingdom - August 10-14, 2015 Division V
Nonlinear steel model
The nonlinear behaviour of the reinforcing bars is reproduced by a classic elasto-plastic law with kinematic hardening which can account for the Bauschinger effect under cyclic loading.
NUMERICAL INVESTIGATION OF MODEL-1, TESTED UNDER STATIC LOADINGS
Elastic analysis
Prior to the static test of Model-1, elastic analysis was performed in order to determine the critical zones of the floor for experimental instrumentation. A horizontal (Y direction) 10 KN static force is applied to the model as shown in Figure 1(a) by the red arrows. Figure 4 shows the numerical results in terms of model deformation and strain distribution. As can be seen, shear and bending deformations are mostly confined on the floor’s main span. The clumping caisson, intentionally designed as a rigid box, contribute very little to the global deformation.
The largest tensile strain in the X direction is caused by bending and lies at the floor-caisson junction (Figure 4(a) and 4(c)). Shear strains are distributed mainly in the diagonal zone of the floor. The top view (Figure 4(b)) displays a continuous distribution on the monolithic topping slab whereas the bottom view (Figure 4(d)) shows a shear strains discontinuity along the floor’s centreline. This is due to the empty gap between the two precast planks which is taken into account in the element mesh described above.
(a) Axial strain ϵxx, top view (b) Shear strain γxy, top view
(c) Axial strain ϵxx, bottom view (d) Shear strain γxy, bottom view
Nonlinear analyses
Following the static cyclic test of Model-1 at GINGER/CEBTP, nonlinear analyses were conducted to assess and simulate the floor’s structural behaviour. The nonlinear concrete and steel models described earlier were employed. Two analyses were performed using Cast3M code: the first one under monotonic loading to calibrate the model parameters and the second one under cyclic loading as it happened in the experiment.
Analysis under monotonic loading: This analysis was performed by imposing an increasing horizontal displacement in the Y direction on the area where the hydraulic jack is connected to the test model, as shown in Figure 1(a). Thanks to the robustness of the new concrete model, the step-by-step analysis was carried out efficiently with a very satisfactory convergence rate. Figure 5 displays the state of the floor for a jack displacement equal to 2.4 mm, corresponding to the beginning of concrete cracking. The figure on the left (a) shows the concrete damage in red colour indicating that the first cracking is caused by bending. This agrees well with observations during the static test. The figure on the right (b) shows the reinforcing bars strain distribution. One can see that the strains are well below the yielding value (2.85×10⁻³) at this stage of loading.
(a) Concrete damage (b) Reinforcing bars strain Figure 5: State of the floor, displacement = 2.4 mm, monotonic loading
Figure 6: Force-displacement relationship,monotonic loading
Blue line: experiment envelope Red line: numerical model
23rd Conference on Structural Mechanics in Reactor Technology Manchester, United Kingdom - August 10-14, 2015 Division V
Regarding the floor’s global behaviour, Figure 6 presents the comparison between the numerical force-displacement relationship and the envelope of the experimental curve. The two curves are rather close except for the initial stage of loading where the numerical model seems overestimate the floor’s stiffness. Analysis under cyclic loading: Using the same numerical model, the second analysis was performed by imposing the alternative cyclic displacement history as it happened during the static test. Although the number of steps of loading was much greater than in the previous analysis, the model performed very efficiently and no convergence problem had been encountered. Figure 7 depicts the state of the floor at a stage of large displacement (8.4 mm) beyond cracking. The figure on the left (a) shows the floor’s concrete damage pattern. One can see that shear friction cracks seem to be the main failure mechanism here, even though a diagonal crack also appeared. The figure on the right (b) shows the strains in the reinforcement. They are below the yielding value.
(a) Concrete damage (b) Reinforcing bars strain Figure 7: State of the floor, displacement = 8.4 mm, cyclic loading
(a) Experiment (b) Numerical model
Figure 8: Force-displacement relationship, cyclic loading, Model-1
The force-displacement curve under cyclic loading obtained by the numerical model is plotted side by side with the experimental one in Figure 8. Overall, one can observe a certain similarity between the numerical curve and experimental one. The model describes fairly well the shear resistance of the floor and visibly its energy dissipation capacity. When comparing more specifically the forms of hysteresis
-1500 -1000 -500 0 500 1000 1500 -20 -15 -10 -5 0 5 10 Déplacement en mm E ff o rt e n k N P1 à P5 P6 et P7 P8 et P9 P10 et P11 P12 à P15 P16 à P19 P20 à P23 P24 et P25 P26 et P27 P28
loops, one can nevertheless note some differences. In particular, the pinching of hysteresis loops around the origin is not reproduced by the numerical model.
NUMERICAL INVESTIGATION OF MODEL-2, TESTED ON THE SHAKING TABLE
Following the shaking table test of Model-2 in EMSI laboratory CEA/Saclay, numerical analyses were conducted to study the modal properties of the structure and to simulate its dynamic response. A finite element model of the shaking table has also been incorporated to the system to account for its coupling effect with the structure.
Finite element modelling of the shaking table
The AZALEE shaking table is a hollow structure composed of plates of aluminum alloy. Its flexibility can have an influence on a rigid and heavy specimen such as the floor model. An elastic model composed of 10232 shell elements has been developed for the table. It is validated against the measured table frequencies and has been used in previous studies, notably during the International SMART Benchmark (Richard, 2013). Figure 9 shows the table model and its first mode in free-free conditions. The first calculated frequency is 82 Hz, rather close to the measured value of 80 Hz. This model was coupled with that of the test structure to perform the modal analysis and calculate the seismic response.
(a) Finite element model (b) First mode (free-free conditions) Figure 9: AZALEE shaking table model and its first vibration mode
Modal analysis
Modal analyses were conducted using the operator VIBR in Cast3M code. The first vibration modes of Model-2 were calculated in two ways: in fixed-base conditions and coupled with the shaking table model. In the latter case, vertical displacements are fixed under the table on the areas of connections with the 4 vertical hydraulic actuators and horizontal displacements are respectively blocked in X and Y directions at the level of the 4 ears of the table that are connected to the horizontal actuators. In fact, actuators are assumed to block the table movement in the direction of their axis.
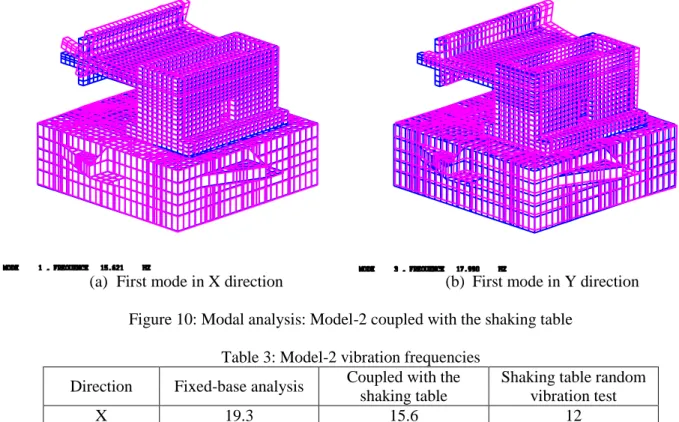
Figure 10 displays the first modes of the coupled system respectively for X and Y directions. One can notice a strong coupling between the shaking table and the test model. In fact, the frequencies of these coupled modes are significantly lower than those of the fixed-base modes as can be seen in table 2 in which the frequencies obtained by random vibration test are also given. Although the flexibility of the
23rd Conference on Structural Mechanics in Reactor Technology Manchester, United Kingdom - August 10-14, 2015 Division V
shaking table is taken into account, the numerical modal analysis still overestimates the stiffness of the system.
(a) First mode in X direction (b) First mode in Y direction Figure 10: Modal analysis: Model-2 coupled with the shaking table
Table 3: Model-2 vibration frequencies Direction Fixed-base analysis Coupled with the
shaking table
Shaking table random vibration test
X 19.3 15.6 12
Y 28.5 17.9 13
Dynamic analyses for the shaking table tests
Dynamic analyses were carried out on the coupled system to simulate the model response during the shaking table tests. The non-linear model used previously in the static simulation was updated with the material properties of Model-2 and a 5% Rayleigh damping was employed. Seismic loading was applied in the form of imposed displacements. They correspond to the signals recorded at the level of the 4 horizontal actuators which control the shaking table, while the movements of the 4 vertical actuators were supposed to be blocked. Analyses were performed in sequence for 7 main seismic tests, taking into account possible damages in the preceding tests. Precisely, the state of the model at the end of each dynamic analysis was saved in a file and was restored for the following analysis.
To illustrate the results of the dynamic analyses, Figure 11 plots the calculated (red line) cross-beam acceleration time history and its response spectrum respectively for the X and the Y directions. They are compared with the experimental results also plotted (black line) in the figure. Regarding the time history response, one can note that the numerical results are very close to the experimental ones. However when comparing the response spectra, gaps appear for frequencies beyond 6 or 10 Hz, especially for the Y direction. This can be explained by the fact that the numerical model still overestimates the system’s stiffness even though the flexibility of the shaking table has been taken into account.
CONCLUSION
Numerical investigations were performed for the two test models using 3D finite element modelling. Both linear elastic and nonlinear analyses were conducted under static (for 1) and dynamic (for
Model-2) loads. A new robust concrete model developed in CEA was used for the nonlinear analyses and the results were compared with the experiments. It has been shown that the numerical model was capable to capture the main features of the structural behaviour the tested floor models.
(a) X direction acceleration (b) X direction response spectrum
(c) Y direction Acceleration (d) Y direction response spectrum Figure 11: Cross-beam response, Test “Run 91”, ZPA = 2g (numerical: red, test: black) REFERENCES
Richard, B. and Ragueneau, F. (2013). “Continuum damage mechanics based model for quasi brittle materials subjected to cyclic loadings: Formulation, numerical implementation and applications”, Engineering Fracture Mechanics, 98, 383–406.
Sellier, A., Casaux-Ginestet, G., Buffo-Lacarrière, L. and Bourbon, X. (2013). “Orthotropic damage coupled with localized crack reclosure processing. Part I: Constitutive laws”, Engineering Fracture Mechanics, 97, 148–167.
Mazars, J. and Pijaudier-Cabot, G. (1989). “Continuum damage theory-application to concrete”. Journal of Engineering Mechanics, 115(2), 345-365.
Vassaux, M. (2015). “Comportement mécanique des matériaux quasi-fragiles sous sollicitations cycliques: de l'expérimentation numérique au calcul de structures”, Thèse de doctorat, École Normale Supérieure de Cachan.
Richard, B (2013). “Projet SMART - Analyse dynamique non linéaire du Run#4 de la campagne SMART 2011 à l'aide de CAST3M-CEA” Note technique SEMT/EMSI/NT/13-002/A