MASSACHUSETTS INSTITUTE OF TECHNOLOGY ARTIFICIAL INTELLIGENCE LABORATORY
Working Paper 199 April 1980
APPLICATIONS OF CIRCULAR ARRAY SENSORS
Charles D. Trawick
A.I. Laboratory Working Papers are produced for internal circulation, and may contain information that is, for example, too preliminary or too detailed for formal publication. It is not intended that they should be considered papers to which reference can be made in the literature.
ACKNOWLEDGEMENTS
Many thanks are due Jeff Keast for making the photographs in this thesis. Special thanks also go to Noble Larson and Matt Mason for the assistancd which they
generously provided in dealing with hardware and software problems. I also wish to thank Dr. Berthold K.P. Horn
APPLICATIONS OF CIRCULAR ARRAY SENSORS
by
Charles D. Trawick
Submitted to the Department of Electrical Engineering and Computer Science on January 18, 1980 in partial
fulfillment of the requirements for the Degree Master of Science in Electrical Engineering
and Computer Science ABSTRACT
The application of the Reticon RO-64 annular photo-diode array to the task of optical tracking of special
targets, direct optical focusing, and automatic printed circuit board inspection were studied. In order to facili-tate this work, a digital camera unit incorporating the array was designed and constructed.
Of the three applications investigated, the
track-ing task proved to be the most successful, since multiple targets were tracked in real time using the array. In the
focusing application, the digital approach was found to be too slow for real-time use, and suggestions were made for the analog implementation of a focusing algorithmusing the array. The printed circuit board inspection algorithm
detected errors successfully, but the inefficiency of image acquisition with the array is a serious drawback, leading to the conclusion that linear arrays of similar design would provide faster and less expensive inspection.
Thus the annular geometry is best suited to the one-time sampling of-points on a circle in an image, as in the case of the tracking and focusing tasks. The focusing task suffers mainly from the amount of computation required to achieve focus, and from its competition with more estab-lished indirect focusing techniques.
Thesis Supervisor: Dr. Berthold K.P. Horn
Title: Associate Professor of Computer Science and Engineering
Chapter One
INTRODUCTION
Motivation
The automation of many relatively simple tasks has been hindered by the lack of effective machine vision sys-tems. Machines have been devised to perform many manipu-lative tasks with great speed and precision, but when such a system must deal with objects whose precise location or
orientation is not known, human assistance is still required. In vision-intensive tasks such as inspection or focusing, where a judgement as to the general quality of a part or image is necessary, special approaches have been developed whereby the processes could be automated in some cases. However, the lack of robustness and high cost of such sys-tems remains a barrier to wholesale automation.
Vision systems are characterized by a tremendous flux of data. In a conventional monochromatic television frame, approximately a million bits of information are available; much more is present in most photographs. Even in the special case of binary images, tens of thousands of points are required for the resolution demanded for many
tasks. Thus it is clear that the acquisition and processing of such data in any on-line time frame requires a system of extremely high memory capacity and processing speed.
5
At the same time, the information of value in a pic-ture, such as the edge of a part or the surface of a work-space, often tends to be either concentrated in a small portion of the image (edges and lines) or distributed holistically over a large area (e.g., quality of focus, surface characteristics). This tendency suggests that more careful acquisition and possibly pre-processing of image data can greatly reduce the overall processing requirements.
Many image processing systems employ local operators which, as has been conjectured in the case of the human eye
[131, may serve to enhance the detection of such features as lines, edges, pattern defects, and so on. In most systems to date, such operators are applied to a vast array of image points after the entire image has been acquired. An alter-nate implementation is pipeline processing of the video signals, provided the local operator is not prohibitively complex.
Yet another approach is the use of a specialized detector, such as an integrated array of photodiodes, which gathers only the data required for a single application of the local operator. This has the drawback that, should multiple applications of the operator be required, multiple detectors or a mechanism for repositioning the array will be necessary. However, it has the advantage that, should such a detector be repositioned, very uniform response and dimen-sionality of the image would be assured. Since such
applications (such as tracking a target) the acquisition of meaningful image information might well be maximized while the total number of image points acquired remains very small.
Areas of Application
Focusing. Automatic focusing is a case in which the desired information about the image (i.e., its degree of defocus) is present "holistically." That is, as more image points are sampled, the degree of defocus can be more and more accurately ascertained. This is due to the fact that focus is indicated by the abruptness of edges and sharpness of detail in the image, and as more and more such high
spatial frequency elements are accumulated, the effects of defocusing can be more readily separated from noise in the image.
Clearly, then, sampling and processing all image points is a good way to assure efficacious focusing. How-ever, the processing required can be quite expensive, and for most noise levels the improvement over sampling a few well-chosen points is small. So a second approach might be
to choose a single line of points in the image. This method falls easy prey to those images which consist mostly of
stripes or striations parallel to the line sampled. Thus a method of choice is to choose points lying on a circle. Only the most pathological of pictures fail to have some detail or feature lying on such a locus. The "endless" nature of the circular sampling scheme has the added
advantage of simplifying the spatial spectrum of the output by eliminating the edge artifacts which accompany sampling along a non-closed locus.
Tracking. In its simplest form, tracking implies the continuous acquisition of data concerning the location of the object being tracked. If the use of a suitably de-signed tracking "target" is permissible, this is of all
spatial vision tasks possibly the easiest to implement. The use of a local operator on the image only at (or near) the target site can provide sufficient information to maintain tracking, and eliminates the need to have a processor wade through the remainder of the image. Targets such as those in Figure 1 are readily handled by an operator which samples points along a circle enclosing the center of the target, since the black-to-white transition points define lines which intersect at the center of the target. Note that the number of sections in a target provides means for
distin-guishing a number of different targets. The same circular scanning provides enough information for the recognition and tracking of a wide variety of patterns, or even an unmarked object provided the object does not undergo much rotation about an axis perpendicular to the line of sight. Such tracking is accomplished by detecting shifts in the image pattern detected: simple rotation shifts all points equally, while translation shifts those points tangent to the direc-tion of modirec-tion more than other points [6].
Printed-circuit board inspection. The use of local operators also strongly suggests itself for the task of printed-circuit board (PCB) inspection. This is due to the difficulty of exact registration of boards with a master image for comparison. Thus an operator is needed which can locally distinguish correct from incorrect features without a stored prototype or master, but simply requires such in-formation as the acceptable ranges for conductor and insu-lator widths. A number of operators have been investigated on scanning imaging systems, with mixed results. The geo-metric uniformity required in the application of the
op-erators is difficult to achieve by any scanning technique, particularly as boards become larger and denser.
An example of such a scanning system and operator is that devised by a Swedish team [101. Scanning of both the conductor pattern and the holes in the board is accomplished by a linearly swept laser beam and stepping motors which move the board perpendicularly to the sweep. In applying the operator, points lying on a circle are tested for the following error condition: two diametrically opposed points are conductors, while the two diametrically opposed points ninety degrees away are insulators. If the diameter of the circle is set to the minimum permissible feature width, only flawed areas will meet this criterion.
Scope of This Thesis
a number of advantages can be realized through the use of an imaging device of circular geometry. In the past four years, a series of monolithic arrays of silicon photodiodes arranged in an annular pattern has been made available by Reticon.
This thesis work is intended to explore the advan-tages and drawbacks of using such an annular array for focusing, tracking, and PCB inspection. The hardware and software required for such work will be detailed and the cost and performance of the resulting vision system based on them compared with those of the more conventional ap-proaches. Finally, additional areas of applicability are suggested.
Previous Work
Most techniques for automatic focusing rely on distance measuring devices rather than the state of the image. Such approaches work well as long as the optics and distance measuring parts remain calibrated with respect to one another, and are particularly simple and hence desir-able when the object being imaged is flat (such as a photo-graph). In imaging a three dimensional scene, however,
such an approach is more difficult to realize. Polaroid's series of self-focusing cameras (which measure distance with a sonic ranging device) are a good case in point:
although in most situations the system works well, pictures taken through a window will result in a picture with the
window, rather than the scene beyond, in focus. However, due to the complexity of processing image information, auto-matic optical focusing has tended to remain in the
laboratory [1,2].
Tracking and recognition of parts in an industrial setting has been investigated in a number of ways. Binary pattern matching [31 and more analytic techniques [4,5] have
found use in the positioning of integrated circuits prepar-atory to lead bonding. The more sophisticated of these
approaches serve to perform some circuit inspection as well. More in the realm of tracking, BAI Corporation has used circular scanning techniques for a number of years to generate signatures for scene recognition and tracking. Although their hardware is considerably different from the
Reticon devices, the results achieved in avionic weapons and other environments with relatively simple processing are very good. Tracking is accomplished at high speeds without the use of special targets [6].
The General Motors Machine Perception Project has produced a very effective method for parts location and
transfer in a rugged and demanding assembly line environ-ment [7,8]. The design considerations and features
incorporated, although not directly useful for an annular array imaging tool, make clear some of the obstacles which in general serve to separate laboratory imaging and manip-ulation systems from their industrial counterparts.
towards the automation of PCB inspection with little
success. The necessity of using a local operator for error detection has been clear for some time [9]. Consequently, a wide variety of such operators and various means of ap-plying them are present in the literature [9,101. Since flaws tend to decrease the width of either the conductor or insulator, the local operators tend to perform a type of spatial high-pass filtering in indicating errors. Thus some of the line and edge detection methodologies developed for more general vision tasks may find application here
[11,12]. Indeed, some of the simple binary operators set forth by the Swedish PCB inspection project group [101 bear a strong resemblance to Hueckel's edge and line detection operators [121.
Chapter Two
HARDWARE
The intended applications of the annular photodiode array dictate a great deal about the methods of acquiring and handling the photodiode outputs. Consequently a con-siderable amount of effort was devoted to developing and improving the hardware associated with the array, and it is appropriate to discuss the details of accessing, digitizing and interfacing the signals to a computer.
Device Characteristics
The annular photodiode array applied in this study (Reticon RO-64) is one of a family including both linear and annular arrays with similar features. Figure 2 depicts the basic array construction. The arrays are monolithic silicon devices, and share the high quantum efficiency and broad spectral response which characterize silicon photodiodes. The same types of noise present in other silicon photo-detectors are also present, but Johnson noise and inter-ference from associated circuitry are.the dominant types in this study.
In Figure 2, each diode is shown accompanied by a capacitor, which serves to integrate the photocurrent
14 not phisically distinct from the associated photodiode, but is primarily the depletion layer capacitance of the diode. Thus it is a function of the reverse bias present across the diode. With the normal reverse bias of five volts, the capacitance of each diode is approximately 3 picofarads.
The signal stored in a diode-capacitor cell is
accessed by means of the n-channel MOSFET between the video bus and the anode of each diode. Since the photodiode
cathodes are connected directly to a five-volt common bus, switching on a single MOSFET permits external access to the signal. The MOSFETs are actuated by a dynamic shift reg-ister or ring counter, which results in sequential access to all of the diodes on the video bus. This accessing
mechanism can be operated (subject to the speed limitations of the external circuitry) at any rate from 2 to 2500
kilohertz. During the access interval, it is required that the external circuitry reset the reverse bias to five volts as well as measure the signal level.
Readout Methods
A small charge stored on a capacitor can be measured in a wide variety of ways. Three approaches were investi-gated in this study: that suggested by the manufacturer of the array, an intermediate experimental approach, and a more robust final method.
Offered in conjunction with the array is a Reticon printed circuit board (RCO-64) which amplifies the current
15 which discharges from each cell through a resistor to ground
[14]. (See Figure 3.) The output thus takes the form of exponential discharge waveforms. Since each cell must recover completely to the baseline to ensure continued ac-curacy of readout, the exponential discharges must be fairly short compared to the total access interval, as shown in Figure 4a. For most applications, it is essential that the peak be sampled by a sample and hold circuit, resulting in a waveform such as that in Figure 4b.
There are several difficulties inherent in this method, as depicted in Figure 5. First, the peak value of the output is ideally proportional to the voltage built up by the discharge of the photodiode. However, this voltage is not linearly related to the integral of the photocurrent due to the non-constant capacitance of the diode. Also, the finite slew rate of the amplifier reduces the peak value somewhat. Both of these effects tend to affect large sig-nals more than small sigsig-nals. Secondly, the sample and hold operation must be very accurate in sampling the peaks, since a small variation to either side of the peak will greatly affect the result.
Finally, in addition to the charge amplifying cir-cuit and the sample and hold circir-cuit, analog to digital
conversion is required. Thus a fairly straightforward read-out process requires three separate units to provide a
signal suitable for interfacing to a computer. The other two approaches both combine the digitization process closely
Sync
I
Shift Register or Ring Counter
OOO__
T..
1ý 3'T
1
Video Bus Out Cv -ommon Figure 2 Vout = Iin (R2R3 + R2R4 + R3R4)/R4 R2 R3 Video Bus Typical values: Ri = 100k R2 = 200k R3 = 5k R4 = 1kPulse Video Out
Figure 3
I
I- -I- -
-
-'
---Typical Pulse Video with Standard Video Card t = RICv 250 500 750 time (Aseconds) 1000 b) 4. Sample-and-Hold.3 Output (volts) 2.
Corresponding Boxcar Output from Sample-and-Hold 750 1000 time Cuseconds) Figure 4 Video Card Output (volts)
Exposure ýmjoules/cm') (28700K Tungsten Source) b) Array Video Bus Current 's by ?ut rate time Figure
5
18 ual "I C19
with the charge readout, and consequently eliminate the need for much of the circuitry previously required.
The intermediate experimental approach retains the resistive discharge of each photodiode. However, instead of the peak current, the width of the peak above a threshold is measured, starting from the clock signal which initiates access to the new cell. This method is manifestly non-linear, but closer inspection reveals that it is in fact logarithmic, distorted only by the non-constant capacitance of the diode. The decaying waveforms of amplitude A, fol-lowing a clocking operation at time TO, is of the form:
A * exp(-(t-TO)/RC). If a cutoff threshold of B is adopted, timing will cease when B/A = exp(-(Ti-TO)/RC), or when
In(B/A) = -(Tl-TO)/RC. Thus the final width measurement is
T = Tl-TO = -RC * In(B/A) = RC * In(A/B). This is
equiv-alent to the logarithm of A to the base exp(l/RC), with an additive offset of -RC * Ln (B). Note that T is expressed in units of time. The actual digital output depends on the clock frequency used in measuring the pulsewidth, as well as the value R of the resistor. The threshold B must be set as low as possible to permit measurement of small sig-nals, since there is no provision for negative logarithms.
A logarithmic output is very desirable for many applications, since it permits additive separation of terms which are normally multiplicative, such as photodiode sensi-tivity, surface reflectance and illumination. However, the drawback of this approach lies in the thresholding process.
The slope of an exponentially decaying pulse is at all points directly proportional to the amplitude, with the consequence that a low threshold requires switching on a slowly changing signal. Any feedback from the thresholding output to its input is likely to overwhelm these slow vari-ations in the signal, resulting in hysteresis or oscillation. In addition, the threshold is extremely critical at such a small value. Any change in its value at best results in a change in the offset and at worst places it at or below the baseline, disabling the entire process. As a result, the practical dynamic range is not as great as originally hoped, and a more robust technique would be preferred.
The final approach to charge measurement is slightly more complex than the logarithmic method, but much simpler than the original technique. The circuit is shown in
Figure 6. The improvement lies in the use of a constant current sink instead of.aresistor to recharge the cells. Thus in measuring the width T = Q/I(recharge) of the re-charge pulse, the actual photore-charge is accurately
determined, despite the changing capacitance of the cell. Since the slope of the recharge pulse, -I(recharge)/C, is fairly constant, the thresholding process is not as sensi-tive to noise. See Figure 7a. The constant current sink must drop some voltage, and consequently its output should not be allowed to approach its baseline voltage (-1.2 volts).
For this reason, the threshold detection process provides the recharging baseline by switching off the recharge
Il Z 12 Figure 6 a) Comparator Input Voltage b) 0,
I
slope = -I(recharge)/C adjusted by P2 only I(bias) adjusted byI
--
-: width
a-Array Clock Comparator Threshold
)
rigure ( flows P1 and P2 time large) illcurrent at the threshold. Thus the threshold is ideally equal to zero volts, but since it doubles as the baseline, as long as it remains constant and reasonably close to zero its value is not critical.
The primary sources of error, then, lie in the con-stant current sink itself, and in the bias current of the comparator. It is assumed that the comparator input current is constant; the "idle" current of the current sink must be set to balance this. During the recharge part of the cycle, the current sink must allow for the same bias current as well as the desired recharge current itself. Thus the
current sink is necessarily controlled in part by the output of the comparator, and requires two adjustments to control the "idle" current as well as the recharge current. See Figure 7b.
Referring again to Figure 6, the current sink itself is a current mirror comprised of transistors TRl and TR2, with a resistive network and third transistor TR3 to provide
the reference current. The comparator output switches this reference current by an amount adjustable from zero to 100 percent by means of potentiometer Pl. The large resistor R1 determines the total available reference current. This available current can then be shunted through TR3 by ad-justing P2 to set the recharge current to the desired value.
The digital portion of the array interfacing cir-cuitry is shown in Figure 8. After loading the preset value from the computer, the counter (ICl-IC3) measures the
01 2
AIC7A
Re
Computer Data Input (12 bits) Figure 8
recharge pulsewidth by counting up at 14.31818 megahertz. The results are latched in IC4 and IC5. Clocking of the array, triggered by each computer access of the latch, is performed by IC6 and IC7.
This digitization process is considerably slower than that originally implemented using a sample and hold and a successive approximation analog-to-digital converter.
However, the exposure time requirements and the processing limitations are quite consistent with the slower analog-to-digital conversion process.
The computer, a Digital Equipment Corporation
PDP-11/45, communicates with the camera unit by means of a standard DR11-C interface card. In addition to the camera's preset input and latch output, the computer has access to a START input and an EOS (End Of Scan) output. The START in-put is required by linear arrays to initiate a readout scan of the array. All arrays have an EOS output which indicates the end of a readout scan to permit synchronization.
The complete camera unit is shown in Figure 9. The unit contains the digital and analog circuitry detailed above, as well as a small power supply. Flat cables serve to connect the DR11-C interface card to the camera. The array itself is mounted in a removable socket module po-sitioned behind the front end of the camera, where the lens is mounted.
DEC * 79
oC * 79
Figure 9
9-Camera Performance
In order to measure the performance of the camera, it is instructive to examine a single readout operation by means of an oscilloscope. The results of such a measurement
are shown in Figure 10, along with calculations of the min-imum detectable charge. The noise figure of plus or minus eight is independent of the light level, so it is most
like-ly due to internal noise sources such as 60-cycle interfer-ence. However, the remaining six bits provide a dynamic
range which is more than sufficient for the three applica-tions in this study.
350 mV
Capacitance = Cv + C(photodiode) + C(Scope Probe)
= 20pF + 3pF + 12pF = 35pF Q = C x V, I = C x V/Sec
Q = 12.3 pCoul, I = 245 nAmp Counter Output =713 * 8
Minimum Resolvable Charge = 12.3pC/(713/16) = 0.276 pCoul
Counter Output at Saturation: approximately 1500 Useful Dynamic Range: 1500/16, or more than 6 bits
Figure 10
Chapter Three
TRACKING
As mentioned in the INTRODUCTION, optical tracking is a task for which the annular array is well suited.
Several tracking techniques are possible with the array. However, the relatively simple approach using targets
similar to those in Figure 1 was selected for this investi-gation, in order to permit the tracking computations to be performed at a useful, real-time rate without requiring special hardware.
The Ideal Target
Although the general target format has been speci-fied, more consideration of the desirable features of
targets is necessary.
Since the black-to-white transitions between target sectors will serve as the points of reference in tracking, it is essential that this contrast ratio be maximized. Also, since a large number of reference points implies
greater redundancy in the calculation of the location of the target center, many-sectored targets are favored. This must be traded-off against the limited angular resolution of the annular array, since each transition must be accurately locatable even when the target is not well centered within the circle of points imaged by the array. Another limit
29
arises from computational speed as the number of target sec-tors increases. The number of lines to be calculated for a target of n sectors is n/2, while the number of intersec-tions of these lines is n(n-2)/4. Thus the computational burden increases rapidly for many sectored targets.
The best size for a target is a function primarily of the size of the imaged circle. Effective tracking re-quires that the target center be contained within this circle. Therefore targets of at least twice the diameter of the imaged circle will prevent the unnecessary loss of targets due to scanning beyond the target edge while the target center is still within the circle. Also, since the target presentation need not be perpendicular to the
camera's line of sight, target foreshortening may occur. Thus target size should be further increased to take full advantage of this feature.
A Discrete-Time Tracking System
If the array camera is to track a moving target, some method must be arranged by which the imaged circle can be moved over the tracking area. Servo-driven mirrors at the camera, or a numerically controlled platform for the target area are possible solutions. The calculations of the position of the target center must then be used to provide an error signal to the repositioning mechanism. Since it is unlikely that the array coordinate system will exactly match that of the repositioner, a (hopefully linear) coordinate
transformation must be determined and used in applying the error information as feedback.
The type of feedback to be used is a function of the types of motion which must be tracked. Simple position
error feedback is sufficient for only a finite range of
velocities, and gives constant position error for a constant velocity input, but it is adequate for this study.
The limit on the target velocity is imposed in part by the limited permissible target displacement between the camera's sampling operations. The absolute upper limit on the displacement is the radius of the imaged circle. This limit can be further restricted by tracking error propa-gating from the previous sample. The radius of the imaged circle is in turn determined by the camera's distance and lens. These are dictated by the desired accuracy of the tracking process--the smaller the circle being imaged, the smaller the effects of error in the tracking calculations. For a sufficiently high camera sampling rate, the maximum velocity could still be very large. The sampling
rate is limited, however, by the limited sensitivity of the array and its associated circuitry, by the finite accessing and processing capability of the computer, and by the re-sponse time of the repositioning mechanism.
The dominant source of error arises from the
discrete angular nature of the array. Since the array dealt with here contains only 64 photodiodes in 360 degrees, each diode represents about 5.6 degrees. Assuming a target
sector edge can always be located to the nearest photodiode, a maximum error of plus or minus 2.8 degrees results. As Figure 11 illustrates, this results in an error of up to 7 percent of the image circle radius for a pair of lines
inter-secting at 90 degrees. For non-perpendicular lines the
maximum error is greater, being directly proportional to the cosecant of the angle between the lines. The precision of locating the sector edges can be greatly improved by use of interpolation. Averaging the results from many-sectored targets can serve to further reduce the error.
Tracking with a Mirror Deflection System
The actual tracking function implemented using the array camera makes use of a General Scanning CCXY-100 mirror deflection system to provide the repositioning capability needed. As can be seen in Figure 9, the deflection unit is mounted along with the camera on a wall bracket, permitting
a large, clear field of view. The X and Y deflection volt-ages which serve to control the mirrors are supplied by an Analogic digital-to-analog converter, which is in turn con-trolled by the computer. With this arangement, large
deflections are completed in less than 6 milliseconds.
The tracking area, depicted in Figure 12, is located on the opposing wall, 5 meters from the camera. It is
illuminated by an intense incandescent lamp. The camera is equipped with a 3-inch, f/4 Bell and Howell lens, which has a focal length of 1 inch. This arrangement yields an imaged
5.60
5.60
(not to scale)
Figure 11
circle approximately 12 centimeters in diameter at the tracking area.
Figure 13 shows the result of a typical camera scan when positioned on a target. While the camera is approxi-mately aimed at a target, the results of an array scan are loaded into a 64 word buffer. The first step in processing such information is the separation of such artifacts as the array pattern noise and irregularities of illumination from the target sector transitions. This is accomplished by taking the first difference of the data, which transforms the sector transitions into prominent positive and negative peaks. Taking the absolute value and clearing all points below an appropriate threshold then leaves the sector
trans-itions as the only non-zero points in the buffer. The threshold is selected to be one-fourth of the maximum peak in the buffer, first because since the sector transitions may either coincide with the boundaries of two photodiode cells or fall somewhere within a point, the resultant first difference peaks may be distributed over two cells, or
concentrated in a single cell. If all sector transitions have roughly the same contrast, the worst case variation in peak height will occur when one transition coincides with a cell boundary while another is centered on a cell--the
second peak will be half the height of the first. Secondly, an additional factor of two is assumed sufficient to sepa-rate the smallest peaks from the largest noise components.
34 DEC * 79 Figure 12 SEC * 79 Figure 13
i
process serve to indicate the number of sectors detected. If this number does not match the number of sectors in the target being tracked, an error is indicated. If it does match, further computation ensues. Each peak will usually
contain either one or two points, but a centroid calcu-lation serves to locate the sector transition point
accurately in any case. These locations are actually angles measured around. the annular array to the sector transition points. From these polar coordinates, Cartesian coordinate pairs are determined by interpolation from a 96 word
sine/cosine lookup table. The points are then paired and the coefficients of the lines thus defined are found. The coordinates of the target center are then found by averaging together the intersection points resulting when all lines are taken two at a time.
In order to initiate the tracking process, a deter-mination must be made of the coordinate transformation
relating the array circle coordinates ito those of the mirror deflection system. The deflection system is first
initial-ized to roughly point at a fixed calibration or "home" target. The target center is then found in terms of the array coordinates. A known displacement of first the X and then the Y deflection mirrors is introduced, and the changes of the calculated target center coordinates in response to each deflection are divided by the magnitude of the deflec-tion. The results form a 2x2 matrix which can be used to map the deflection system coordinates into the array
36
coordinates. The inverse of this matrix is then calculated to provide the necessary coordinate transformation for the application of tracking feedback to the mirrors. All
calcu-lations are performed in fixed point binary notation.
Tracking Multiple Targets
The tracking system lends itself well to the track-ing of multiple targets, since the mirror deflection system can be used to time-multiplex the tracking of individual targets. For this reason, the tracking control program is written to permit the specification of additional targets. Providing the number of sectors of a new target permits the system to recognize it when it is placed in front of the home target. Once it is thus "acquired," the target is
inserted into the "tracking cycle" and tracked independently of other targets. Subsequent failure of the sector count to match the target specification results in extra scans of the target during the tracking cycle up to a preset limit, in an attempt to re-acquire the target. Beyond this limit, the target is labelled "lost" and is reduced again to one scan per tracking cycle.
Tracking Performance
Due to the importance of accuracy during the cali-bration process, the array clock period is set to 260
micro-seconds until the calibration is complete and tracking
commences. For tracking, speed is more important than this small increase in accuracy, so the clock period is reduced
37
to 100 microseconds. This permits a complete array scan in 6.4 milliseconds. Since the array cells integrate continu-ously between one access and the next, all cells must be reset after the repositioning of the mirrors to prevent the use of "smeared" images. Since the repositioning alone takes almost 6 milliseconds, two complete array scans must be discarded for each repositioning operation. Thus only one scan in three is useful, and acquisition of this scan requires 19.2 milliseconds.
As noted previously, the imaged circle has a
diameter of 12 centimeters. Thus, in the absence of track-ing errors, a target may move up to 6 centimeters between scans without being lost. This translates to a maximum target speed of roughly 3 meters per second for a single target. Reliable tracking has been measured at speeds of up to 1.3 meters per second. This reduction is due to errors in the calibration and tracking calculations, which manifest themselves in a wobble of the deflection mirrors about the correct position. (The tracking process is con-veniently monitored by displaying the X and Y deflection voltages on an oscilloscope in X-Y mode. Figure 14 shows the results of a three target tracking operation displayed in this way.)
Practical Tracking
Since maximum target speed is directly proportional to target size and inversely proportional to the number of
DEC *
39
targets being tracked, the applications of the tracking system as it stands are limited. Introduction of a shutter on the camera could double or triple the tracking speed by closing while the mirrors are in motion and thus eliminating the necessity of throwing away "smeared" images. The intro-duction of second- or third-order terms in the feedback
would change the limiting factor to acceleration or change in acceleration of the target instead of speed.
Chapter Four
FOCUSING
Image focusing, a task performed swiftly and effort-lessly by the human eye, does not lend itself to easy
automation. Most efforts rely on the measurement of dis-tance to the object being imaged. However, focusing an image by measuring and maximizing a focus quality factor derived from the image itself is more desirable because it
is directly linked to the image quality. Thus it is susceptible only to such things as would tend to corrupt the picture itself. The use of the annular array in gen-erating such a focus quality factor is motivated by its provision of some two-dimensional coverage of the image
while requiring only one-dimensional storage and computation.
The Focusing Function
Lens systems can be described as linear systems, operating in a spatially invariant manner on a
two-dimensional array of points. The accuracy of such a descrip-tion is limited by lens abberadescrip-tions and errors, and by the wave nature of light. The output image of a lens system may thus be obtained by convolving the input with the lens'
point spread function, analogous to the impulse response of a one-dimensional, linear, time-invariant system. (The
issue of image size will not be dealt with here.)
At perfect focus, the point spread function of a lens is an impulse at the origin, or center of the image. The output image is thus directly proportional to the input
image. Figure 15a depicts this convolution. As a lens moves from perfect focus, the point spread function becomes a pillbox. The result is the smearing together of features in the output image. Figure 15b shows this convolution. Figure 15c shows the same operation performed in the spatial frequency domain.
As Figure 15c suggests, one effect of defocusing is the attenuation of the high spatial frequency components in the image. Horn [2] has shown that the energy present in the high spatial frequency range, as extracted by an ideal high-pass filter, serves as a good indicator of focus. This
focusing function can be used to iteratively arrive at the point of best focus, maximizing the function by a "hill-climbing" process.
The use of such a function in focusing has two drawbacks when compared with the conventional distance-measuring approach. First, it is iterative rather than closed in form, and requires repeated adjustments of the lens, sampling of the image and evaluation of the focusing function to arrive at the point of best focus. This limits the speed of the focusing operation. Also, the digital evaluation of the focusing function is complex and time-consuming. The use of custom LSI or analog methods may
Input Image Point * Spread Function = Output Image
*
/
/
Figure 15 W~/overcome this difficulty.
Maximizing Focus
There are several ways in which the focusing
function can be applied to reach the point of maximum focus. The simplest "hill-climbing" approach involves ad-vancing the lens position by steps of a maximum length L. This length L is limited so as to permit the detection of even the narrowest possible peak of the focusing function.
(The narrowest possible peak arises from a pattern at the limit of the array's resolution. Such a pattern contains energy only at the highest spatial frequency incorporated in the focusing function. The width of such a peak is a
function of the depth of field of the lens.) As the lens is advanced, any decrease in the focusing function brings about a reversal of direction, and division of the step length by a factor K. This process coverges to within a maximum error of L * (K-N)/2 within N reversals, requiring an average of K/2 times the step time for each reversal.
Greater speed can be realized by entering the analog-realm, as is mentioned in greater detail in Chapter Six.
The narrowest peak once again provides a good test for the convergence of the system. The feedback system which ap-plies the focusing function output to the focusing mechanism must be carefully designed to neither miss nor oscillate
about such a narrow peak.
object, advantage should be taken of the knowledge of the previous lens location. This is done by using the previous position as a starting place, with the result that focus is continuously maintained near maximum, even when the distance to the object changes.
The "Best" Focus
In maximizing the focusing function it is important to take several limiting factors into consideration. The optics and imaging devices in any system are subject to limits of resolution and noise. Also, the point of "best" focus is not always the maximum point on the focusing
function.
Resolution Limitations
Any imaging device has a spatial frequency limit above which image variations cannot be resolved. In the case of photographic film, this is a function of the emul-sion and processing, which in turn determine the grain size. In the case of solid state imaging devices, the resolution is determined by the size and spacing of the individual sensing elements. This spatial frequency limit places an upper limit on the focusing requirements, since once the point spread function becomes smaller than a single sensing element, further focusing effort has little effect in the spatial frequency range to which the imaging device is sensitive.
array, because the array, with 10.2 photodiodes per milli-meter, must be able to detect any focusing shortcomings detectable by the rest of the system. Thus the array reso-lution should equal or exceed that of any associated imaging devices.
Noise Limitations
The noise in the array output brings about excursions in the digital value from a single photodiode which are
independent of the level of illumination, and of the partic-ular photodiode observed. These fluctuations are produced by baseline noise in the comparator, which brings about
fluctuations in the comparator output pulsewidth. Since the noise is uncorrelated with respect to location within the array, its spatial power spectral density is flat. The resulting noise contribution to the focusing function is small compared to the individual fluctuations in the array output.
It should be remembered that the implementation of a focusing function with the annular array is a compromise intended to provide good focus information without the computational expense of a two-dimensional fourier trans-form. However, as a consequence of the relatively small number of points sampled, a given detector noise level makes a larger contribution to the focusing function than in the case of a two-dimensional implementation. Thus to permit the focusing error to be undetectable, the array noise level
should be at least as low as that of the accompanying imaging device--ideally much lower.
Complicating Factors
If all scenes were flat and had the same spatial spectrum, the process of focusing would simply entail find-ing the location of the maximum value of the focusfind-ing
function. Since in such a case the focusing function has a single peak, this task would on the average be complete within a single half-sweep through the range of possible
lens positions.
The height and width of a peak in the focusing
function is determined by: 1) the lower cutoff frequency of the focusing function, 2) the depth of field of the lens and 3) the spatial spectrum of the scene. If the array meets the stipulation of equal or superior resolution and noise characteristics when compared with the imaging device, the effect of such changes on the peak poses no problem. The maximum value will still be easily found.
The introduction of depth into the scene adds a new dimension to the focusing function as well. Just as a human observer can make a decision to focus his eyes on a near object or a far object, the need now arises in the focusing process for a "high-level" decision to be made: Which
object is the important one?
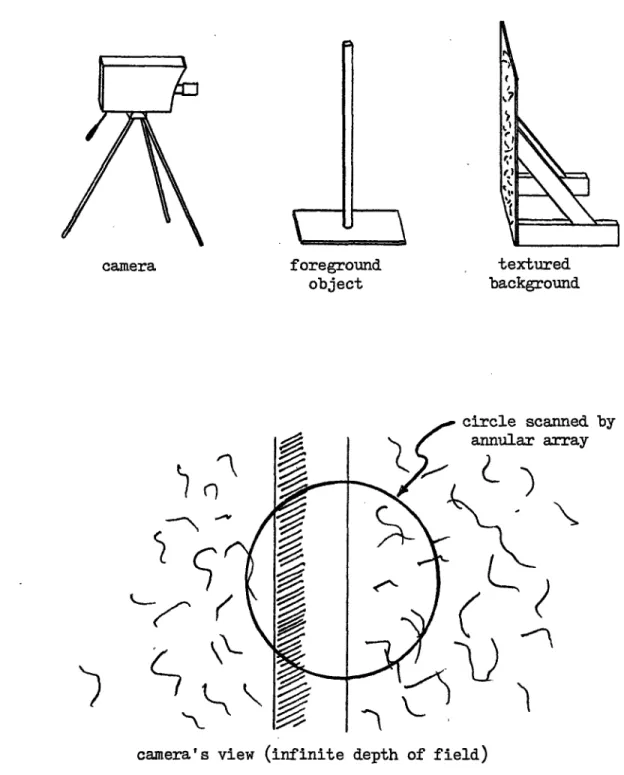
An example of this difficulty is presented in
L
foreground object textured background -annea oy arraycamera's view (infinite depth of field)
Figure 16 camera
I
P-u
to be the important feature in the scene. However, the textured background produces a far higher peak in the
focusing function. While a local maximum of the focusing function still marks the preferable point of focus, there is now more than one local maximum.
The presence of multiple peaks gives rise to another problem. If the peaks must be distinguished from one an-other, their height and width become significant, since overlaps may occur. This problem can best be minimized by raising the lower cutoff frequency used in calculating the focusing function, since this step tends to reduce the width of the focusing function peaks.
Unfortunately, not all objects are certain to have features containing spatial frequencies near the resolution limit of the array, and raising the cutoff frequency may consequently render some objects undetectable by the focus-ing function. This suggests that a variable cutoff
frequency adjustable to the object of interest can optimize the ability of the system to focus on that object. Refer to Figure 17, a plot of focusing function output versus lens position and cutoff frequency. Line "a" indicates the
focusing function for a fixed cutoff frequency. Line "b" indicates the focusing function for a fixed energy. In this case, the focusing function output becomes an independent
(and constant) variable, while the cutoff frequency becomes the dependent focus quality factor. This second type of focusing function minimizes the offset of a local maximum
g Function
put
due to the "tail" of a large peak nearby, since the low frequency terms which normally comprise such a tail will be ignored in the presence of the high frequency contributions of the object being focused on.
Conclusions
When the direct optical focusing capability achiev-able with the annular array is compared with the performance of other automatic focusing methods, it must be concluded that for the present the indirect methods are more useful
for most applications. The most promising avenue for focusing with the array is the analog extraction of the focusing function, since without extensive special purpose hardware a single digital evaluation of the focusing
function requires several milliseconds. Possible approaches to the use of the array in such an analog system are ex-plored in Chapter Six.
Given a usable focusing system, interaction with higher level vision routines will be required for any but the simplest scenes. Input will be required to overcome the natural affinity of such a focusing system for textured
surfaces, and to designate which features in a scene are of interest.
Chapter Five
PRINTED CIRCUIT BOARD INSPECTION
The locus of image points sampled by the annular array closely matches that of a local operator devised for printed circuit board (PCB) inspection by a Swedish research group [101. The reliability of such operators has proven a problem, however. This is largely due to the difficulty of applying them accurately over an entire PCB without geo-metric distortion. The spatial stability of a monolithic imaging array suggests that a series of arrays implementing an inspection algorithm might be used to rapidly and
reliably scan PCB's for errors.
The P-Algorithm
The local operator which the array is best suited to implement is termed the P-algorithm, because the periphery of a circle is the only area sampled in its application. Figure 18 illustrates the application of the operator using the annular array.
The operator is designed to detect any feature with a width which is less than the diameter of the circle
scanned. As Figure 19 shows, all features, whether conduc-tor or insulaconduc-tor, must be drawable with a round-tipped pen of this same diameter. This places some restrictions on
Implementation of P-algorithm
error
output
b) a marginal case, slightly exaggerated
7,
c) d)(
Errors detected by P-algorithm Figure 19 a)2
the PCB to be inspected, since normal inside corners (Figure 19b) do not meet this criterion.
The P-algorithm was devised for use with a complete area scan, since to guarantee the detection of all flaws the operator must be applied at points one resolution cell apart. The annular array has a diameter equal to roughly twenty resolution cells. Thus in an exhaustive scan, the array will image each resolvable point on the PCB an average of forty times. This degree of redundancy suggests that there is room for improvement. However, inspection work with the annular array can serve to provide a general indication of the robustness with which monolithic photo-diode arrays can be used to inspect PCB's.
Inspection With the Annular Array
A sample PCB with trace widths of approximately 1 millimeter was selected for a test of the inspection
process. Although the board was not designed with automatic inspection in mind, selected areas contain suitable test cases for the P-algorithm.
Since the array diameter is 2 millimeters, a lens system providing a 2:1 magnification was necessary. The requisite lens is a simple lens mounted in a steel pipe, which is affixed to the camera unit. Since the lens is not
equipped with an iris, exposure control is provided by use of an adjustable autotransformer with the incandescent
The camera unit is mounted on a vertically adjust-able support, and positioned so as to look down onto the inspection platform.
The resolution provided by the array at the platform surface is roughly 20 sampled points per millimeter. Thus an exhaustive inspection procedure requires 400 inspection operations to cover a single square millimeter. The limited speed of mechanically repositioning the board renders such an inspection process very slow. For this reason, inspec-tion was carried out by manually posiinspec-tioning the board for inspection of the features of interest. The inspection
process provided indication of errors in the cases of broken traces, bridged traces, and narrow traces and insulators.
A General Inspection System
The redundant and inflexible inspection process performed by the annular array can be made more general by replacing the annular array with a series of linear photo-diode arrays. The same spatial accuracy could then be combined with the scanning efficiency and algorithmic ver-satility which would arise from the use of a linear array. The camera unit is readily adaptable to all of Reticon's self-scanning linear arrays.
Chapter Six
CONCLUSIONS
The purpose of this study has been the investigation of the application of the Reticon RO-64 annular photodiode array to the problems of optical tracking, direct optical focusing and automatic PCB inspection. The most successful of these applications is the tracking investigation, since multiple targets were tracked in real time. The focusing investigation raises questions concerning the speed possible with the direct optical approach, since sonar based distance-measuring focusing systems are in comparison quite fast,
simple and reliable. The investigation of PCB inspection suggests that other photodiode arrays are better suited to the task than the annular array.
The tracking system might be used in a large number of applications if the tracking speed can be further in-creased. For example, targets can serve as a wireless computer input device similar to a joystick or mouse. Multiple stations in a single room could be serviced by a single mirror deflection system. Another application is the optical monitoring of patient position during radiation treatments, enabling the radiation equipment to compensate
for patient movement. The addition of a shutter to the tracking system would immediately increase tracking speed
by a factor of three, since at present the signals
inte-grated during the motion of the tracking mirrors are discarded to avoid error due to smearing.
As was mentioned in Chapter Four, analog signal
processing is the fastest way to produce a focusing function. Figure 20 is a block diagram of such a processor. The cut-off frequency of the focusing function can be made variable by replacing the high-pass filter with a voltage-controlled high-pass filter. The transfer function of the focusing mechanism is non-linear and varies as a function of the image. The high frequency pattern test case maximizes the absolute value of this transfer function, due to the steep-ness of the sides of the focusing function peak.
Figure 21 depicts a system for rapid PCB inspection with linear arrays. The array readout circuitry can be very simple, since analog thresholding serves to distinguish the conductor from the board, and thus each readout produces only one bit. A single processor capable of applying a suitable local operator at a word rate of 20 kilohertz detects errors in an exhaustive inspection at a rate of up to 1 inch per second, with a resolution of 0.05 inch. This system is superior to that proposed by the Swedish team
[9,101, since it eliminates the laser scanning part of the system and its associated non-linearity.
Sample-and-Hold Buffer C Focusing Mechanism Figure 20 rithm units direction of PCB travel Figure 21
References
1. B. Horn, "Focusing" AI Memo No. 160 (1968)
2. B. Horn, "The Application of Linear Systems Analysis to Image Processing. Some Notes." Working Paper 100 (AI Lab) (1974)
3. S. Kashioka, et al., "A Transistor Wire-Bonding System Utilizing Multiple Local Pattern Matching
Techniques" IEEE Trans. on Sys., Man and Cyb. (1976) SMC-6,8 p.562-570
4. M. Baird, "SIGHT-I: A Computer Vision System for Automated IC Chip Manufacture" IEEE Trans. on Sys., Man and Cyb. (1978) SMC-8,2 p.133-139 5. B. Horn, "A Problem in Computer Vision: Orienting
Silicon Integrated Circuit Chips for Lead Bonding" Comp. Graph. and Im. Proc. (1975) 4 p.2 94,303
6. M. Dreyfus, "Visual Robots" Industrial Robot (1974) 6 p.260-264
7. M. Baird, et al., "GM Research Labs' Machine Perception Project" SIGART Newsletter (1975) 55
8. M. Ward, et al., "CONSIGHT: An Adaptive Robot with Vision" Robotics Today (1979) Summer p.26-32 9. M. Ejiri, et al., "A Process for Detecting Defects in
Complicated Patterns" Comp. Graph. and Im. Proc. (1973) 2 p.3 2 6-3 3 9
10. D. Antonsson, et al., "A System for Automatic Visual Inspection of Printed Circuit Boards"
Internskrift LiTH-ISY-I-0264 (1979)
11. M. Hueckel, "An Operator Which Locates Edges in
Digitized Pictures" J.ACMI (1971) 18,1 p.1 1 3-1 2 5 12. M. Heuckel, "A Local Visual Operator Which Recognizes
Edges and Lines: J.ACM (1973) 20,4 p.6 3 4-6 4 7 13. D. Marr and E. Hildreth, "Theory of Edge Detection"
AI Memo No. 518 (1979)
Appendix
APPLYING THE CAMERA UNIT TO OTHER RETICON ARRAYS
The array camera was built in a sufficiently general fashion to permit its use with Reticon photodiode arrays other than the RO-64.
The use of a removable module to mount the array makes it possible to adapt the unit to the different pinouts and package configurations of the various arrays available.
Connection to the module is made by means of a 16-pin dual-inline wire-wrap socket mounted on the digital logic card in the camera. The array mounting module contains a flat cable terminating in a matching 16-pin header. This connection is intended to supply the power supply and bias voltages to the array, as well as initialization and synchro-nization signals. The two-phase clock and video output lines are handled by separate connectors which minimize the coupling of noise into the video line.
In using a Reticon array with a single video output line, the array mounting module should be fabricated with the accompanying pin designation in mind. Apart from the addition of a Start operation
(using CSRO), no other changes are required to convert from the annular array to such a linear array.
In order to use both halves of a linear array with two video ouput lines, several changes are required. First, a means must be provided by which the video charge detection circuitry can be applied
to both video lines. Also, clocking must be provided to both of the access shift registers. Reticon advises that the second set of clock signals be in quadrature with the first, but there are reasons for not
61
doing so. First, it requires the addition of another dual clock
driver, with the associated logic and connections. Second, it provides another burst of clock noise in the middle of what was formerly a quiet
interval.
Multiplexing the two video lines might best be accomplished by means of two n-channel MOSFETs. The sources of the MOSFETs should be tied together and to the input of the charge measuring circuitry. The drains should be connected to the respective video output lines of the array. The gates should be driven in a complementary fashion, according to one of the following readout schemes:
I)the two video lines are accessed on alternate readout scans. The MOSFETs are switched during the interval between the end of one scan and the start of the next.
2)the two video lines are accessed during each clock interval. It is not clear whether this would degrade the signal from the second video line accessed, but if CSR1 is used to switch the MOSFETs, this can be checked fairly easily.
One further point should be mentioned: video line capacitance is critical. The MOSFETs should be chosen to increase this capacitance by as little a possible. Discrete devices or a dual MOSFET would probably
A k Cxrnhezkl 2