HAL Id: hal-02524708
https://hal.univ-cotedazur.fr/hal-02524708
Submitted on 1 Apr 2020
HAL is a multi-disciplinary open access archive for the deposit and dissemination of sci-entific research documents, whether they are pub-lished or not. The documents may come from teaching and research institutions in France or abroad, or from public or private research centers.
L’archive ouverte pluridisciplinaire HAL, est destinée au dépôt et à la diffusion de documents scientifiques de niveau recherche, publiés ou non, émanant des établissements d’enseignement et de recherche français ou étrangers, des laboratoires publics ou privés.
D'arripe-Longueville
To cite this version:
Stéphanie Scoffier-Mériaux, Y Paquet, K. Corrion, F D'arripe-Longueville. Development and validation of the French Self-Regulatory Eating Attitude in Sports Scale. Scandinavian Journal of Medicine and Science in Sports, Wiley, 2010, 20 (4), pp.10. �10.1111/j.1600-0838.2009.00984.x�. �hal-02524708�
PROOF
French Development and Validation of the Self-Regulatory Eating Attitude in Sports Scale (SREASS)
Journal: Scandinavian Journal of Medicine and Science in Sports Manuscript ID: SJMSS-O-421-08.R1
Manuscript Type: Original Article Date Submitted by the
Author: 25-Feb-2009
Complete List of Authors: SCOFFIER, Stéphanie; Université de Nice Sophia-Antipolis, UFR STAPS
PAQUET, Yvan; Université de Reims, UFR STAPS
CORRION, Karine; Université de Nice Sophia-Antipolis, UFR STAPS d'ARRIPE LONGUEVILLE, Fabienne; Université de Nice Sophia-Antipolis, UFR STAPS
Keywords: self-regulation, eating disorders, sports, validation
PROOF
Running head: Self-Regulatory Eating Attitude in Sport 1
2
French Development and Validation of the Self-Regulatory Eating Attitude in Sports Scale 3 (SREASS) 4 5 S. Scoffier 6
Université de Nice Sophia Antipolis,
7
261 Route de Grenoble, BP 3259
8
06205 Nice cedex 03, France 9
10
Y. Paquet 11
Laboratoire de Psychologie Appliquée
12
EA 4298, Université de Reims
13
57 rue Pierre Taittinger
14
51096 Reims cedex, France
15 16
K. Corrion & F. d’Arripe-Longueville 17
Université de Nice Sophia Antipolis
18
261 Route de Grenoble, BP 3259
19
06205 Nice cedex 03, France 20 21 Corresponding author: 22 Stéphanie Scoffier 23
UFR STAPS – Université de Nice Sophia-Antipolis 24
261 Route de Grenoble, BP 3259 25
06205 Nice cedex 03, France 26 Phone: + 33 492 296 529 27 Fax: + 33 492 296 537 28 Email: scoffier@unice.fr 29 30 31
Date submitted: December 14, 2008 32
Revision submitted: February 28, 2009. 33 3 4 5 6 7 8 9 10 11 12 13 14 15 16 17 18 19 20 21 22 23 24 25 26 27 28 29 30 31 32 33 34 35 36 37 38 39 40 41 42 43 44 45 46 47 48 49 50 51 52 53 54 55 56 57 58 59 60
PROOF
French Development and Validation of the Self-Regulatory Eating Attitude in Sports Scale 1 (SREASS) 2 3 Abstract 4
In this study, the French Self-Regulatory Eating Attitude in Sports Scale (SREASS) 5
was developed and then validated. Five subscales measure the control of eating attitude in 6
contexts of: (a) food temptation, (b) negative affects, (c) social interaction, (d) lack of 7
compensatory strategy, and (e) lack of anticipation of consequences on performance. The 8
validation procedure required the participation of 527 student athletes and four successive 9
studies to develop and present a preliminary scale and assess the clarity of the items (study 1), 10
evaluate the factorial structure validity of the scale and test the invariance across gender 11
(study 2), assess the time stability (study 3), and assess the external validity of the instrument 12
(study 4). The present results provide preliminary evidence for the appropriateness of the 13
SREASS for French student athletes. Nevertheless, further evaluation of this instrument is 14
warranted to establish the robustness of the present findings. 15
16
Keywords: self-regulation, eating disorders, sports, validation. 17 18 3 4 5 6 7 8 9 10 11 12 13 14 15 16 17 18 19 20 21 22 23 24 25 26 27 28 29 30 31 32 33 34 35 36 37 38 39 40 41 42 43 44 45 46 47 48 49 50 51 52 53 54 55 56 57 58 59 60
PROOF
French Development and Validation of the Self-Regulatory Eating Attitude in Sports Scale 1 (SREASS) 2 3 Introduction 4
The concept of self-regulation has been explored in many fields of study. In social 5
psychology, self-regulation refers to the capacity to control one’s behavior or perform an 6
activity (Bandura, 1977; Bandura, 1982; Bandura, 1986; Bandura, 1997). This capacity is 7
thought to develop through the interplay of influences between an individual and his or her 8
social environment and implies personal standards and social and moral levels. Bandura 9
(1997) theorized that several factors determine individual regulation. The feeling of self-10
efficacy particularly affects self-regulation. Self-efficacy can be defined as the individual’s 11
conviction of being capable of organizing and carrying out the actions needed to accomplish a 12
task. McAuley (1992) and Dawson, Gyurcsik, Culos-Reed and Brawley (2001) reviewed the 13
psychosocial variables affected by self-regulation. They reported that self-regulation 14
influenced goal choices, activities, and persistence in the face of challenges and obstacles 15
(Bandura, 1986; Locke & Latham, 1990) and health-related behaviors. For example, self-16
regulation was identified by Pehacek and Danaher (1979) as a predictor of smoking cessation 17
without relapse. It has also been linked to exercise and physical activities (Desharnais, 18
Bouillon & Godin, 1986; McAuley, 1992; McAuley & Mihalko, 1998), as well as weight loss 19
and nutrition (see Herman & Polivy, 2004, for a review). Because eating is essential for life, 20
it is considered to be particularly regulated (Herman & Polivi, 2004). The literature on social 21
cognitive theory (Bandura, 1982), the theory of reasoned action (Fishbein & Ajzein, 1975) 22
and the health belief model (Rosenstock, 1974) all indicate the influence of self-regulation 23
and self-regulatory efficacy, among numerous other factors, on eating attitudes. This 24
influence was corroborated by many of the studies cited in AbuSabha and Achterberg’s 25 3 4 5 6 7 8 9 10 11 12 13 14 15 16 17 18 19 20 21 22 23 24 25 26 27 28 29 30 31 32 33 34 35 36 37 38 39 40 41 42 43 44 45 46 47 48 49 50 51 52 53 54 55 56 57 58 59 60
PROOF
review of the literature (1997). For example, the capacity for self-regulation affects students’ 1
control of fruit and vegetable consumption (Baranowski, Perry & Parcel, 1997). 2
Another important predictor of eating attitude is locus of control (AbuSabha & 3
Achterberg, 1997). The theory of locus of control refers to where individuals expect control 4
over events to be located; that is, whether they believe they are themselves the source of the 5
control of reinforcement (Rotter, 1966; 1975). Several studies (e.g., Caggiula & Watson, 6
1992; Saturnino-Springer & Bogue, 1994) examined the respective relationships among 7
eating or weight-control behaviors, the locus of control in health-related behaviors, and the 8
self-regulation of eating attitude. Although the conclusions are diverse because of differences 9
in the study variables, contexts and subjects, some authors (e.g., Bandura, 1977; 1997) saw 10
the link between locus of control and self-regulation as evident. Bandura assumed that an 11
external locus of control (by luck or the influence of a significant other) would diminish self-12
regulation. 13
The literature indicates two principal tools to measure the capacity for self-regulation 14
of eating attitudes: the Eating Self-Efficacy Scale (ESES) of Glynn and Ruderman (1986), 15
which is composed of 25 items loaded on two factors: negative affects and socially acceptable 16
circumstances, and the Eating Disorder Recovery Self-Efficacy Questionnaire (EDRSQ) of 17
Pinto and colleagues (Pinto, Guarda, Heinberg, & DiClemente, 2006; Pinto, Heinberg, 18
Coughlin, Fava, & Guarda, 2008), which is composed of 23 items loaded on two factors: 19
normative regulation of eating attitude and the feeling of efficacy concerning self-20
image. Both tools have certain limits. They measure the self-regulation of eating behavior but 21
only take into account two factors, which seem to overlook the richness of Bandura’s 22
conception (1986; 1997). Also, these tools were developed to measure the self-regulation of 23
eating attitude in daily living contexts and only exist in English. Moreover, the EDRSQ is 24
specifically designed for individuals with eating disorders, like anorexia and bulimia nervosa, 25 3 4 5 6 7 8 9 10 11 12 13 14 15 16 17 18 19 20 21 22 23 24 25 26 27 28 29 30 31 32 33 34 35 36 37 38 39 40 41 42 43 44 45 46 47 48 49 50 51 52 53 54 55 56 57 58 59 60
PROOF
and does not really pertain to those with subclinical pathology or those at elevated risk. 1
Finally, these tools have never been adapted for athletes. 2
Indeed, thinness is assumed to confer a competitive advantage in certain sports and the 3
risk of developing eating disorders is higher in them (Petrie & Greenleaf, 2007): this is 4
particularly so in sports (a) in which low body weight contributes to speed and movement 5
efficiency (e.g., ski jumping, marathons, endurance races), (b) with weight categories 6
(e.g., judo, taekwondo), and (c) with aesthetic criteria requiring a high level of self-knowledge 7
and a specific morphology (e.g., artistic ice-skating, gymnastics) (Reels & Gill, 1996; 8
Smolak, Murnen & Ruble, 2000; Sherman & Thompson, 2009; Sundgot-Borgen & Torstveit, 9
2004). Athletes are under high pressure from the sport achievement context itself. Some must 10
conform to an ideal body weight in order to achieve an aesthetically pleasing appearance, 11
whereas others need to maintain low body weight or remain in a specific weight category in 12
order to attain performance excellence; hence, weight in both cases may be essential to 13
success (Sherman & Thompson, 2009). 14
The sports context is moreover characterized by specific socialization agents like the 15
coach (Sundgot & Borgen, 1994) and norms of excellence and accomplishment not found in 16
ordinary life (Beals & Malnore, 1995; Sherman & Thompson, 2009; Scoffier, Maïano & 17
d’Arripe-Longueville, in press). The tools generally used in sports psychology studies are (a) 18
the Eating Attitude Test of Garner, Olmsted, Bohr and Garfinkel (1982), which measures the 19
attitudes and behaviors associated with eating disorders and was validated by Leichner, 20
Steiger, Puentes-Neuman, Perreault and Gottheil (1994) in a population of French-speakers, 21
and (b) the Eating Disorder Inventory of Garner Olmsted and Polivy (1983), which assesses 22
disturbances in eating behavior. No instrument to our knowledge, however, measures the self-23
regulation of eating attitude in athletes. Given the particularly high stakes and intense social 24
pressures of this context, instruments developed for daily living seem limited, and a validated 25 3 4 5 6 7 8 9 10 11 12 13 14 15 16 17 18 19 20 21 22 23 24 25 26 27 28 29 30 31 32 33 34 35 36 37 38 39 40 41 42 43 44 45 46 47 48 49 50 51 52 53 54 55 56 57 58 59 60
PROOF
tool for athletes seems needed to better understand the eating disorders in this population and 1
to develop effective strategies for prevention. 2
The aim of this study was to develop and validate in French a scale to measure the 3
self-regulation of eating attitude in sports: the Self-Regulation of Eating Attitude in Sports 4
Scale (SREASS). Four complementary studies were required to follow Vallerand’s 5
transcultural validation procedure (1989) and the contemporary invariance measurement 6
literature (e.g., Gregorich, 2006). Validity was successively assessed by exploratory factor 7
analysis during the development of the preliminary version (study 1) and by confirmatory 8
factor analysis and partial invariance testing across gender (study 2). The reliability of the 9
scale was assessed by examining the internal consistency of the scales and the stability over 10
time (study 3). Last, construct validity of the concept of self-regulation of eating attitude in 11
sports was tested with external variables: locus of control and eating attitudes (study 4). 12
Method 13
Overview 14
Validity was successively assessed by exploratory factor analysis during the development 15
of the preliminary version (study 1) and by confirmatory factor analysis and partial invariance 16
testing across gender (study 2). The reliability of the scale was assessed by examining the 17
internal consistency of the scales and the stability over time (study 3). Last, construct validity 18
of the concept of self-regulation of eating attitude in sports was tested with external variables: 19
locus of control and eating attitudes (study 4). 20
A total sample of 527 French voluntary student athletes, 285 males and 242 females 21
(Mage = 22.12 years; SD = 3.70 years), enrolled in a University of Sports Sciences, took part 22
in the study. This population of athletes practiced regularly (M = 5.78 hours per week, SD 23
= 3.45) and had an average of seven years of experience (M = 7.35; SD = 1.80) in their sport. 24
The student athletes practiced three sport types: individual sport (N = 204), combat sport (N = 25 3 4 5 6 7 8 9 10 11 12 13 14 15 16 17 18 19 20 21 22 23 24 25 26 27 28 29 30 31 32 33 34 35 36 37 38 39 40 41 42 43 44 45 46 47 48 49 50 51 52 53 54 55 56 57 58 59 60
PROOF
133), and collective sport (N = 190). The participants were all French and the majority was 1
Caucasian. They completed the questionnaires on-line, at home. They chose the most 2
convenient moment and completion did not take more than 10 minutes. They were informed 3
beforehand that they were not obligated to respond and that their anonymity would be 4
respected. They were also informed that this was not a test (i.e., there were no right and 5
wrong answers) and that all responses would remain strictly confidential and only serve 6
research purposes. Consent was obtained from all athletes prior to performing the study. 7
Because human subjects were involved in our study, the ethics committee of the University 8
scientific board was consulted and approved our methods. Four studies were carried out to 9
validate the SREASS, according to Vallerand’s (1989) procedure. 10
Study 1: Development of a Preliminary Version of the SREASS 11
Participants. In the first study, which aimed at developing a preliminary version of the 12
SREASS in French, the sample was composed of 20 student volunteers for the clarity 13
analyses and 160 student volunteers who regularly practiced sports: 75 males and 85 females 14
between 18 and 25 years old (Mage = 23.00 years; SD = 6.47 years). 15
Procedure. A committee of experts (i.e., researchers in the field of social psychology 16
applied to sport) was asked to generate a series of items to evaluate self-regulation of eating 17
attitude in sport by referring to the literature. The major sources were Petrie and Greenleaf’s 18
review of the literature (2007) on the factors influencing eating disorders in sport and the 19
ESES of Glynn and Ruderman (1986) and the EDRSQ of Pinto et al. (2006; 2008), which 20
both contain items to measure the self-regulation of eating attitude in daily living. Finally, 21
semi-directive interviews were held with high-level athletes, who reported their perceptions 22
concerning the typical contexts and situations that influence their capacity for regulating 23
eating attitude (Marsollier, 2007). The participants responded on 6-point Likert-type scales, 24
ranging from (1) “not at all capable” to (6) “completely capable”. 25 3 4 5 6 7 8 9 10 11 12 13 14 15 16 17 18 19 20 21 22 23 24 25 26 27 28 29 30 31 32 33 34 35 36 37 38 39 40 41 42 43 44 45 46 47 48 49 50 51 52 53 54 55 56 57 58 59 60
PROOF
1Study 2: Factorial Structure of the SREASS 2
Participants and procedure. In the second study, the objective was to confirm the 3
factor structure of the instrument developed in the first study in a different population using 4
confirmatory factor analysis (CFA) and to test the invariance of the factorial structure. The 5
population consisted of 181 student volunteers (Mage = 23.50 years; SD = 3.42 years) with 98 6
males and 83 females. The questionnaires were completed either at the beginning or the end 7
of sessions, depending on the student’s availability. Questionnaire completion was carried out 8
under standardized conditions (i.e., isolation, paper, pencil, and prohibition to communicate) 9
and did not exceed more than 10 minutes. 10
Data analyses: We conducted several analyses in this study. First, we performed CFA 11
on the SREASS with AMOS 7.0 software (Arbuckle, 2006). Second, we analyzed the 12
invariance across gender. Measure invariance was assumed if the items had the same meaning 13
for all members of the population. To account for differences in the groups (i.e., gender), or 14
patterns in the relationships among variables, we used the multi-group comparison technique 15
of AMOS 7.0, which consisted of testing the factorial invariance across several groups. To do 16
so, certain aspects of the factorial structure of these models needed to be constrained; that is, 17
maintained invariant. Factorial invariance tests through gender categories were performed on 18
the best CFA model and in the sequential order recommended by Gregorich (2006): (a) 19
dimensional (i.e., no invariance), (b) metric (i.e., equal loadings), (c) strong (i.e., equal 20
intercepts), and (d) strict (i.e., equal uniquenesses). 21
Study 3: Temporal Stability of the SREASS 22
Participants and procedure. The third study was designed to test the reliability of the 23
instrument over time and the internal consistency of the two subscales. The population 24 3 4 5 6 7 8 9 10 11 12 13 14 15 16 17 18 19 20 21 22 23 24 25 26 27 28 29 30 31 32 33 34 35 36 37 38 39 40 41 42 43 44 45 46 47 48 49 50 51 52 53 54 55 56 57 58 59 60
PROOF
consisted of 102 voluntary student athletes (Mage = 20.45 years; SD = 1.46 years) with 60 1
males and 42 females, who completed the questionnaire twice with a four-week interval. 2
Study 4: External Validity of the SREASS 3
Participants and procedure. The fourth study tested the external validity of the 4
SREASS by linking locus of control to eating attitudes. The sample was composed of 84 5
voluntary students (Mage = 21.54 years; SD = 3.47 years) with 32 females and 52 males 6
practicing individual sport. The participants were invited to complete a series of three 7
questionnaires after their training session in a private room. 8
Measures. In the fourth study, many questionnaires were used: 9
Self-regulation of eating attitude in sports scale. Self-regulation of eating attitude was 10
measured using the SREASS developed in studies 1, 2 and 3, and resulted in a 16-item scale. 11
The internal consistency of each of the subscales was acceptable (α > .70). 12
Locus of control scale specific to athletes’ eating behaviors. This scale was adapted from the 13
French version of the Multidimensional Health Locus of Control Scale (MHLCS) (Wallston, 14
Wallston & DeVellis, 1978), with four modified dimensions to distinguish between Favorable 15
Others and Unfavorable Others based on the work of Paquet, Berjot and Gillet (in press). The 16
former refers to the coach and sports friends, and the latter refers to family members (Scoffier 17
et al., in press). This adapted scale is composed of 20 items with Cronbach alphas ranging 18
from .59 to .75 for each dimension. The internal consistency of the scale factors is acceptable 19
and similar to the values for other scales of locus of control, like the French validation of the 20
Levenson scale (Rossier, Rigozzi & Berthoud, 2002). 21
Eating attitudes. The attitudes and behaviors associated with eating disorders were measured 22
with the French version of the Eating Attitude Test (EAT) of Garner et al. (1982), with 26 23
items on three subscales: (a) eating restriction (e.g., “I’m terrified at the thought of being too 24
fat”), (b) bulimia and food obsession (e.g., “I worry too much about food”), and (c) control of 25 3 4 5 6 7 8 9 10 11 12 13 14 15 16 17 18 19 20 21 22 23 24 25 26 27 28 29 30 31 32 33 34 35 36 37 38 39 40 41 42 43 44 45 46 47 48 49 50 51 52 53 54 55 56 57 58 59 60
PROOF
eating (e.g., “I avoid eating when I’m hungry”). For each item the participant had to answer 1
on a 6-point Likert-type scale from “not at all true” (1) to “very true” (6). In line with other 2
works (e.g., Petrie & Greenleaf, 2007), a global index of eating attitudes and behaviors was 3
used. The internal consistency of these subscales was satisfactory (.75 < α >.90). 4
Analyses. Pearson correlation coefficients were calculated for all subscales of the three 5
scales examined in this study. 6
Results 7
Study 1: Development of a Preliminary Version of the SREASS 8
Initially, the experts developed a pool of 25 items intended to measure self-regulation 9
of eating attitudes in sport. Some items were developed by adapting items from the existent 10
scale to the sports context. Other items were developed after analysis of qualitative interviews 11
and additional consultation with sports psychologists, team coaches, and athletes. The expert 12
committee finally retained 20 items (i.e., 4 items per subscale), with three items inversed. 13
In the second step, the clarity of the preliminary version of the SREASS, with 20 14
items, was assessed by 10 students (M = 20.00 years; SD = 2.65 years). They were asked to 15
evaluate the clarity of each item on a 6-point Likert-type scale from (1) “not at all clear” to (6) 16
“completely clear”. The minimum and maximum scores possible were 1 and 6 and all 17
possibilities were used by participants They were encouraged during individual qualitative 18
interviews to justify the points they attributed to each item. Following these interviews, 19
modifications were then made to two items. Clarity was again assessed by another 10 students 20
and satisfactory scores were obtained for the clarity of each of the subscales (i.e., M > 4.00; 21
SD < 1.50). 22
The factorial structure was examined by principal-axis factor analysis (Oblimin-type 23
rotation). In order to extract the most appropriate factors, parallel analysis (Horn, 1965) was 24
used. In the random distribution, values lower than the factor weights were shown for the first 25 3 4 5 6 7 8 9 10 11 12 13 14 15 16 17 18 19 20 21 22 23 24 25 26 27 28 29 30 31 32 33 34 35 36 37 38 39 40 41 42 43 44 45 46 47 48 49 50 51 52 53 54 55 56 57 58 59 60
PROOF
five factors only [i.e., factor 1 (random value) = 1.64, (ACP value) = 4.85; factor 2 (random 1
value) = 1.52, (ACP value) = 3.61; factor 3 (random value) = 1.43, (ACP value) = 2.47; factor 2
4 (random value) = 1.35, (ACP value) = 1.77; factor 5 (random value) = 1.29, (ACP value) = 3
1.32]. This extraction method revealed five factors without constraint to the model. Next, the 4
five-factor model was examined by factor analysis without additional constraint. The 5
following items were not retained: items showing saturation coefficients above .40 on two 6
factors simultaneously, those whose saturation coefficients did not reach this value on either 7
of two factors, and those that did not saturate on a single factor that loaded most of the items 8
with similar semantic contents (Guttman, 1954). These criteria were used to select the 16 9
items presented in Table 1 and included two inversed items (items 2 and 9). Each of these 10
retained items saturated with a weight greater than .65 on the expected factor and with a 11
weight lower than .35 on the other factor. 12
The items were loaded onto five factors pertaining to the self-regulation of eating 13
attitude in the following contexts: (a) food temptation (i.e., Do you feel capable of controlling 14
what you eat when your favorite food is set before you?); (b) negative affects (e.g., Do you 15
feel capable of controlling what you eat when you are irritable?); (c) social interaction (e.g., 16
Do you feel capable of eating a normal amount of food when you have a meal with your 17
parents?); (d) lack of compensatory strategies (e.g., Do you feel capable of making yourself 18
vomit if you’ve just eaten cake at a birthday celebration?); and (e) lack of anticipation of 19
consequences on performance (e.g., Do you feel capable of eating dessert without thinking 20
about the consequences it may have on the next competition?). Next, the number of items for 21
each of these five factors was extended so that we could select the most pertinent 22
formulations in the next step. 23
Factor 1 explained 24.23% of the variance and contained four items measuring the 24
lack of anticipation of consequences related to performance; factor 2 explained 18.04% of the 25 3 4 5 6 7 8 9 10 11 12 13 14 15 16 17 18 19 20 21 22 23 24 25 26 27 28 29 30 31 32 33 34 35 36 37 38 39 40 41 42 43 44 45 46 47 48 49 50 51 52 53 54 55 56 57 58 59 60
PROOF
variance and contained three items relative to food temptation; factor 3 explained 12.35% of 1
the variance and contained three items relative to compensatory strategies; factor 4 explained 2
8.89% of the variance and contained three items relative to social pressure; and factor 5 3
explained 6.62% of the variance and contained three items relative to negative affects. The 4
data were subsequently organized according to a five-factor model with 70.15% of the 5
variance explained, which is satisfactory (Gorsuch, 1983). 6
Study 2: Factorial Structure of the SREASS 7
Preliminary Analyses. Multivariate Analyses of Variance (MANOVAs) were 8
performed on all observed variables, in order to examine the differences due to sport type. 9
The analysis indicated a non-significant main effect of sport type (Wilks’ λ = .70, F(16, 425) =
10
5.22, p > .01, η2 = .30). The variables did not differ according to sport type so the sample was 11
considered as homogeneous. 12
Confirmatory factorial analysis. The 16-item, five-factor model then underwent CFA. 13
Bootstrap re-sampling was performed with AMOS 7.0 software since the data presented 14
significant multivariate non-normality (normalized skewness: 126.40; normalized kurtosis: 15
54.29). Analysis revealed that the 16-item model (Figure 1) was significantly adjusted to the 16
data [χ² (94, N = 425) = 112.01; p < .01 CFI = .97; TLI = .96; RMSEA = .06; LO/HI RMSEA 17
= .042/.076]. 18
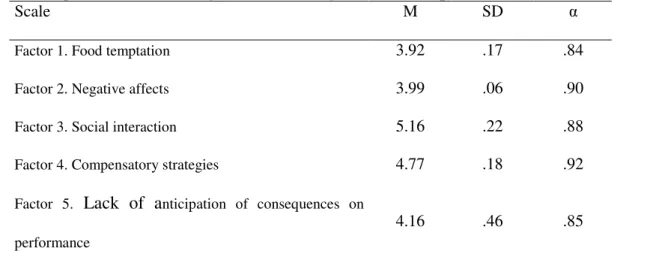
Internal consistency of subscales and correlations between subscales. The means and 19
standard deviation of each subscale were sufficiently homogeneous and are presented in Table 20
2. The Cronbach alpha coefficients were above .84 for the five subscales, demonstrating 21
satisfactory internal consistency (Nunnally, 1978) (Table 2). The inter-subscale correlation 22
coefficients were between -.26 and .91 and are presented with their significance level in 23 Figure 1. 24 3 4 5 6 7 8 9 10 11 12 13 14 15 16 17 18 19 20 21 22 23 24 25 26 27 28 29 30 31 32 33 34 35 36 37 38 39 40 41 42 43 44 45 46 47 48 49 50 51 52 53 54 55 56 57 58 59 60
PROOF
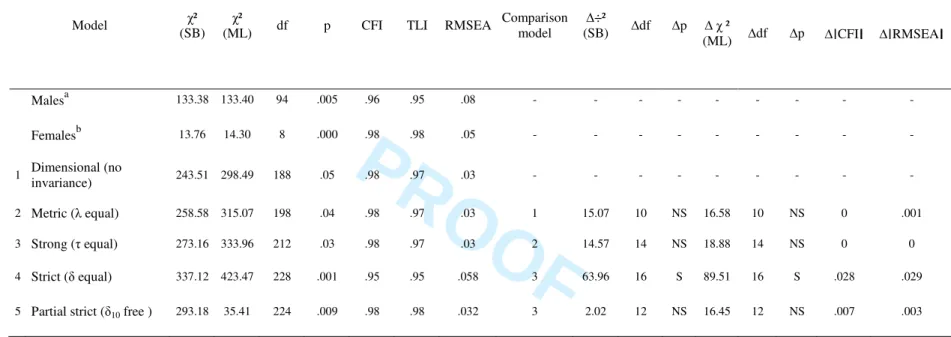
Invariance across gender. Invariance analyses across gender were done with bootstrap 1
resampling. CFA (cf. Table 3) was performed on samples of 98 males (M = 23.50 years; SD 2
= 5.25 years) and 83 females (M = 23.20 years; SD = 6.50 years). Moreover, CFI, TLI and 3
RMSEA were all satisfactory (> 0.90 for CFI and TLI; < .06 for RMSEA). The first 4
invariance model (dimensional)showed a significant χ² value suggesting a lack of fit between 5
the hypothesized model and the data. However, due to the sensitivity of χ² in large samples, 6
other fit indices were assessed (Kline, 1998). The model showed indices of CFI and TLI (> 7
.90) and RMSEA (< .05). The metric model showed a significant χ² value and satisfactory 8
indices of CFI and TLI (> .90) and RMSEA (< .05) [∆SB χ² = 15.07; ∆ML χ² = 16.58, ∆df = 9
10, p = .08; ∆CFI < .01; ∆RMSEA < .015]. The third model (i.e., strong / scalar) showed a 10
significant χ² value and satisfactory indices of CFI and TLI (> .90) and RMSEA (< .05) [∆SB 11
χ² = 14.57; ∆ML χ² = 18.88, ∆df = 14, p = .17; ∆CFI < .01; ∆RMSEA < .015]. The strict 12
model showed a significant χ² value and satisfactory indices of CFI and TLI (> .90) and 13
RMSEA (< .06). Strict factorial invariance was not seen in any case. The modification indices 14
proposed by AMOS 7.0 suggested that the gender equivalence, which was constrained to the 15
error of measurement for item 10, contributed to limiting the invariance of the factorial 16
structure of the SREASS. The fifth model, unconstrained for the error of measurement for 17
item 10 in both groups, showed satisfactory partial strict invariance [∆SB χ² = 27.02; ∆ML χ² 18
= 16.45, ∆df = 12, p = .17; ∆CFI < .01; ∆RMSEA < .015]. 19
This series of sample analyses indicated partial invariance at the most complex level 20
(strict) of the SREASS factor structure across gender. These results indicate that this 21
instrument is valid for both males and females. 22
Study 3: Temporal Stability of the SREASS 23
The time stability of the scale was first verified with a paired Student t-test. The result 24
was overall non-significant, which indicates a lack of significant difference between the two 25 3 4 5 6 7 8 9 10 11 12 13 14 15 16 17 18 19 20 21 22 23 24 25 26 27 28 29 30 31 32 33 34 35 36 37 38 39 40 41 42 43 44 45 46 47 48 49 50 51 52 53 54 55 56 57 58 59 60
PROOF
occasions of measure. Correlation analysis confirmed the time stability of the subscales at T1 1
and T2. The scores (Bravais-Pearson r) were above .70 for each of the subscales 2
(respectively, factor 1: .70, factor 2: .75, factor 3: .80, factor 4: .85, factor 5: .71 and all p < 3
.01). 4
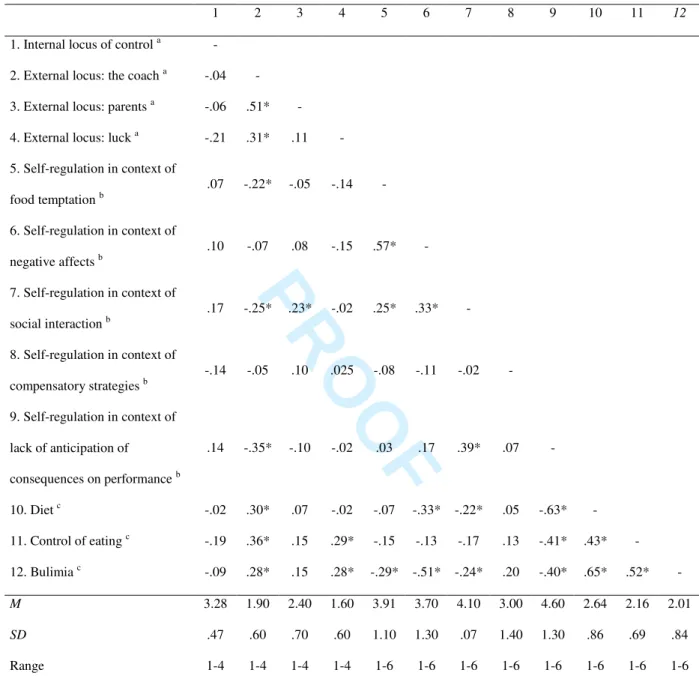
Study 4: External Validity of the SREASS 5
The analyses showed significant correlations, in agreement with the literature (see 6
Table 4). The subscales of the SREASS for food temptation, social interaction and lack of 7
anticipation of consequences on performance were negatively correlated with the subscale of 8
external locus of control regarding the influence of coach and sports friends. The subscale of 9
self-regulation of eating attitude in the context of social interaction was positively correlated 10
with external locus of control regarding parental influence. Thus, in agreement with the 11
literature (Bandura, 1977, 1997), we observed lower self-regulation of eating attitude when 12
significant others were influential. Significant correlations (p < .05) were also observed 13
between self-regulation of eating attitude in contexts of food temptation, negative affects, 14
social interaction, consequences on performance and several of the subscales of eating 15
attitudes. These results confirm the findings of Baranowski et al. (1997) concerning the 16
capacity for self-regulation and students’ control of fruit and vegetable consumption. 17
Discussion 18
The purpose of this study was to develop and validate a French language scale 19
assessing self-regulation of eating attitudes in sports contexts. Four studies were conducted in 20
line with the steps outlined by Vallerand (1989), in order to validate the Self-Regulation of 21
Eating Attitudes in Sports Scale (SREASS). The validity of the tool was successively 22
demonstrated by exploratory factor analysis (study 1), and confirmatory factorial analysis and 23
partial invariance according to gender (study 2). The reliability of the SREASS was 24
demonstrated by satisfactory internal consistency and temporal stability (study 3), and 25 3 4 5 6 7 8 9 10 11 12 13 14 15 16 17 18 19 20 21 22 23 24 25 26 27 28 29 30 31 32 33 34 35 36 37 38 39 40 41 42 43 44 45 46 47 48 49 50 51 52 53 54 55 56 57 58 59 60
PROOF
external validity was confirmed (study 4). These analyses confirmed the validity of a five-1
factor model. The SREASS is composed of five subscales that refer to the specific contexts 2
that significantly influence the control of eating attitude in athletes. These are: food 3
temptation, negative affects, social interaction, lack of compensatory strategies, and lack of 4
anticipation of consequences on performance. 5
The results support in part the findings of Glynn and Ruderman (1986) and Pinto et al. 6
(2006; 2008). Our results are nevertheless original in that they validate an instrument that is 7
highly specific to athletes and that embodies several facets of the concept of self-regulation as 8
it pertains to eating attitudes. Glynn and Ruderman (1986) dealt with two factors: (a) negative 9
affects and socially acceptable circumstances, and Pinto et al. (2006; 2008) took into account 10
two other factors: (a) normative self-regulation of eating and (b) self-regulation of body 11
image. Based on the review of the literature by Petrie and Greenleaf (2007), the qualitative 12
interviews of Marsollier (2007), and published findings (Bandura, 1986), we chose five 13
factors to define self-regulation of eating attitudes in sport. The results confirmed this choice. 14
We tested the invariance of the SREASS across gender and showed that this 15
instrument is valid for both males and females. Moreover, the partial invariance of the model 16
was demonstrated at the most complex level. The SREASS can thus be used to test 17
hypotheses about across-group differences in self-regulation of eating attitude in sport, 18
independently of or in relation with other psychological constructs. These findings enrich the 19
literature because earlier works did not particularly focus on gender differences. 20
Several limitations of the current series of studies must be taken into account when 21
interpreting these findings, however. First, the data were mostly self-reported and thus may 22
have been biased by social desirability. Second, the fourth study was cross-sectional, which 23
limits the stability across time of the relationships between variables. Moreover, this study 24
was only performed with student athletes, who have basic knowledge about the components 25 3 4 5 6 7 8 9 10 11 12 13 14 15 16 17 18 19 20 21 22 23 24 25 26 27 28 29 30 31 32 33 34 35 36 37 38 39 40 41 42 43 44 45 46 47 48 49 50 51 52 53 54 55 56 57 58 59 60
PROOF
of a healthy lifestyle. The observed results thus cannot be generalized to high-level athletes 1
who may inadvertently take in an insufficient number of calories to cover their energy 2
expenditure. In this case, they experience low energy availability but do not display a truly 3
disordered eating pattern. It might be useful to develop a self-regulatory scale for athletes so 4
that they can specifically examine their ability to regulate food intake along the periodized 5
training plan. 6
The external validity was examined through correlational analyses, which showed 7
significant correlations among locus of control, eating attitudes and self-regulation of eating 8
attitude, in agreement with the literature (e.g., AbuSabha & Achterberg, 1997). Further 9
research is needed to confirm the validity of our scale in other athletes and to determine the 10
range of its appropriateness. First, the validity of the SREASS should be tested in adolescents 11
and, if necessary, an age-appropriate instrument could be developed. It would also be 12
interesting to validate this instrument in English to enable cross-cultural studies. Second, the 13
external validity should be examined by associating self-regulation of eating attitudes with 14
other theoretically pertinent variables. The relationships among self-regulation of eating 15
attitudes in sport, the psychosocial factors that determine eating behavior, and the eating 16
attitude itself (Petrie & Greenleaf, 2007) could be examined. For instance, athletes’ 17
achievement goals and self-regulation of eating attitude should be studied in relation to eating 18
disorders (e.g., Pelletier, Dion & Levesque, 2004). These studies will be facilitated because 19
our scale is specific to the sports context, as opposed to the more generic scales currently in 20
use (Glynn & Ruderman, 1986; Pinto et al., 2006; 2008). 21
In conclusion, the SREASS has satisfactory psychometric properties and can be used 22
in a population of young French adults. This scale is a useful instrument that should lead to 23
greater understanding of the self-regulatory mechanisms of eating attitudes in the sports 24
context. Better insight into these mechanisms could then be applied to developing well-aimed 25 3 4 5 6 7 8 9 10 11 12 13 14 15 16 17 18 19 20 21 22 23 24 25 26 27 28 29 30 31 32 33 34 35 36 37 38 39 40 41 42 43 44 45 46 47 48 49 50 51 52 53 54 55 56 57 58 59 60
PROOF
strategies to prevent or resolve athletes’ eating disorders. Self-regulatory efficacy related to 1
eating attitudes could be a good index for dieticians, nutritionists and other professionals 2
involved in this aspect of sports medicine, facilitating the diagnosis of eating disorders with 3
specific symptoms. Coaches would also benefit from greater awareness of their athletes’ self-4
regulation of eating attitudes, as they would be better positioned to develop educational 5
strategies to enhance their athletes’ self-regulatory skills. 6 3 4 5 6 7 8 9 10 11 12 13 14 15 16 17 18 19 20 21 22 23 24 25 26 27 28 29 30 31 32 33 34 35 36 37 38 39 40 41 42 43 44 45 46 47 48 49 50 51 52 53 54 55 56 57 58 59 60
PROOF
References 1AbuSabha R, Achterberg C. Review of self-efficacy and locus of control for nutrition and 2
health-related behavior. J Am Diet Assoc 1997: 97: 1122–1132. 3
Arbuckle J. AMOS 7.0 User’s Guide. Chicago, IL: SPSS 2006. 4
Bandura A. Self-Efficacy: Toward a unified theory of behavioural change. Psychol Rev 1977: 5
84, 191-215. 6
Bandura A. Self-efficacy mechanism in human agency. Am Psychol 1982: 37: 122-147. 7
Bandura A. Social foundations of thought and action. Englewood Cliffs, NJ: Prentice-Hall 8
1986. 9
Bandura A. Self-efficacy: The exercise of control. New York: Freeman 1997. 10
Baranowski T, Perry CL, Parcel GS. "How individuals, environments and health behaviour 11
interact: social cognitive theory", in Glanz K, Lewi FM, Rimer NK. (Ed), Health 12
Behavior and Health Education: Theory, Research and Practice, Jossey-Bass, San 13
Francisco, CA 1997. 14
Beals KA, Manore MM. Behavioral, psychological and physical characteristics of female 15
athletes with subclinical eating disorders. Int J Sport Nut 2000: 10: 128-143. 16
Caggiula AW, Watson JE. Characteristics associated with compliance to cholesterol lowering 17
eating patterns. Patient Educ Couns 1992: 19: 33-41. 18
Dawson KA, Gyurcsik NC, Culos-Reed SN, Brawley LR. Perceived control: A construct that 19
bridges theories of motivated behavior. In GC Roberts (Ed.), Advances in motivation in 20
sport and exercise (pp. 321–356). Champaign, IL: Human Kinetics 2001. 21
Desharnais R, Bouillon J, Godin G. Self-efficacy and outcome expectations as determinants 22
of exercise adherence. Psychol Rep 1986: 59: 1155-1159. 23
Fishbein M, Ajzein I. Belief, Attitude, Intention and Behavior: An Introduction to Theory and 24
Research, Addison-Wesley, Reading, MA 1975. 25 3 4 5 6 7 8 9 10 11 12 13 14 15 16 17 18 19 20 21 22 23 24 25 26 27 28 29 30 31 32 33 34 35 36 37 38 39 40 41 42 43 44 45 46 47 48 49 50 51 52 53 54 55 56 57 58 59 60
PROOF
Garner DM, Olmsted MP, Bohr Y, Garfinkel P. The Eating Attitude Test: psychometric 1
features and clinical correlates. Psychol Med 1982: 12: 871-878. 2
Garner DM, Olmsted MP, Polivy J. Development and validation of a multidimensional eating 3
disorders inventory for anorexia and bulimia, Int J Eat Dis 1983: 2: 15-34. 4
Glynn SM, Ruderman AJ. The development and validation of an eating self-efficacy scale. 5
Cognit Ther Res 1986: 10: 403-420. 6
Gorsuch RL. Factor analysis. Hillsdale, NJ: Erlbaum 1983. 7
Gregorich SE. Do self-report instruments allow meaningful comparisons across diverse 8
population groups? Testing measurement invariance using the confirmatory factor 9
analysis framework. Med Care 2006: 44: 78-94. 10
Guttman L. Some necessary conditions for common factors analysis. Psychometrika 1954: 11
19: 149-185. 12
Herman CP, Polivy J. The self-regulation of eating. In RF Baumeister KD Vohs (Ed.), The 13
handbook of self-regulation: Research, theory, and applications (pp. 492–508). New 14
York: Guilford Press 2004. 15
Horn JL. A rationale and test for the number of factors in factors analysis. Psychometrika 16
1965: 30: 179-185. 17
Kline P. The New Psychometrics: Science, psychology and measurement. London: Routledge 18
1998. 19
Leichner P, Steiger H, Puentes-Neuman G, Perreault M, Gottheil N. Validation d’une échelle 20
d’attitudes alimentaires auprès d’une population québécoise francophone [Validation of 21
an eating attitude scale in a French-speaking Quebec population]. Can J Psychiatry 22
1994: 39: 49-54. 23
Locke EA, Latham GP. A theory of goal setting and task performance. Englewood Cliffs, NJ: 24 Prentice Hall 1990. 25 3 4 5 6 7 8 9 10 11 12 13 14 15 16 17 18 19 20 21 22 23 24 25 26 27 28 29 30 31 32 33 34 35 36 37 38 39 40 41 42 43 44 45 46 47 48 49 50 51 52 53 54 55 56 57 58 59 60
PROOF
Marsollier E. Les comportements alimentaires des trampolinistes de haut niveau : facteurs 1
psychosociaux et définition d'un programme de prévention-santé [The eating behaviors 2
of trampolining elite athletes: psychosocial factors and definition of a preventive health 3
program]. Unpublished master thesis. Université de Nice Sophia-Antipolis 2007. 4
McAuley E. Exercise and motivation: A self-efficacy perspective. In GC Roberts (Ed.), 5
Motivation in sport and exercise (pp. 107–127). Champaign, IL: Human Kinetics 1992. 6
McAuley E, Mihalko SL. Measuring exercise-related self-efficacy. In JL Duda (Ed.), 7
Advances in sport and exercise psychology measurement (pp. 371–390). Morgantown, 8
WV: Fitness Information Technology 1998. 9
Nunnally JC. Psychometric theory (2nd edition). Jossey-Bass, San Francisco 1978. 10
Paquet Y, Berjot S, Gillet N. Validation d’une échelle de locus de contrôle spécifique à la 11
performance en sport individuel [Validation of a locus of control scale specific to 12
performance in individual sport]. Bull Psychol, in press. 13
Pehacek,TGF, Danaher BG. How and why people quit smoking: A cognitive behavioral 14
analysis. In PC Kendall, SD Hollon (Ed.), Cognitive–behavioral interventions: Theory, 15
Research, and Procedures. New York: Academy Press 1979. 16
Pelletier LG, Dion S, Lévesque C. Can self determination help protect women against 17
sociocultural influences about body image and reduce their risk of experiencing 18
bulimic symptoms? Journal of Social & Clinical Psychology. Special Issue: Body 19
Image 2004: 23: 61-88. 20
Petrie TA, Greenleaf CA. Eating disorders in sport: From theory to research to intervention. 21
In G Tenenbaum (Ed.), Handbook of Sport Psychology, 3rd Edition (pp. 352-378). 22
Wiley & Sons, Inc, Hoboken, New Jersey 2007. 23
Pinto AM, Guarda AS, Heinberg LJ, DiClemente CC. Development of the Eating Disorder 24
Recovery Self-Efficacy Questionnaire. Int J Eat Dis 2006: 39: 376-384. 25 3 4 5 6 7 8 9 10 11 12 13 14 15 16 17 18 19 20 21 22 23 24 25 26 27 28 29 30 31 32 33 34 35 36 37 38 39 40 41 42 43 44 45 46 47 48 49 50 51 52 53 54 55 56 57 58 59 60
PROOF
Pinto AM, Heinberg LJ, Coughlin JW, Fava JL, Guarda AS. The Eating Disorder Recovery 1
Self-Efficacy Questionnaire (EDRSQ): change with treatment and prediction of 2
outcome. Eat Behav 2008: 9: 143-153. 3
Reel JJ, Gill DL. Psychosocial factors related to eating disorders among high school and 4
college female cheerleaders. The Sport Psychol 1996: 10: 195-206. 5
Rosenstock IM. Historical origins of the health belief model. Health Educ Monogr 1974: 2 : 6
328-335. 7
Rossier J, Rigozzi C, Berthoud S. Validation de la version française de l'échelle de contrôle 8
de Levenson (IPC): influence de variables démographiques et de la personnalité. 9
[Validation of the French version of the Levenson control scale (IPC): influence of 10
demographic and personality variables]. Ann Med Psychol 2002: 160: 138-148. 11
Rotter JB. Generalized expectancies for internal versus external control of reinforcement. 12
Psychol Monogr 1966: 80: 1-28. 13
Rotter JB. Some problems and misconceptions related to the construct of internal versus 14
external control of reinforcement. J Consul Clin Psychol 1975: 43: 56-67. 15
Saturnio-Springer N, Bogue N. Nutrition locus of control and dietary behavior of pregnant 16
women. App Nurs Res 1994:7: 28-31. 17
Scoffier S, Maïano C, Arripe-Longueville F (d’). The effects of social relationships and 18
acceptance on disturbed eating attitudes in elite adolescent female athletes: the 19
mediating role of physical self-perceptions. Int J Eat Dis, in press. 20
Sherman RT. Thompson RA. Body image and eating disturbance in athletes: Competing to 21
win or to be thin? In JJ. Reel, KA. Beals (Ed.), The Hidden Faces of Eating Disorders 22
and Body Image, (pp. 9-38) AAHPERD, Sewickley, 2009. 23
Smolak L, Murnen SK, Ruble AE. Female athletes and eating problems: a meta-analysis. Int J 24 Eat Dis 2000: 27: 371-380. 25 3 4 5 6 7 8 9 10 11 12 13 14 15 16 17 18 19 20 21 22 23 24 25 26 27 28 29 30 31 32 33 34 35 36 37 38 39 40 41 42 43 44 45 46 47 48 49 50 51 52 53 54 55 56 57 58 59 60
PROOF
Sundgot-Borgen J. Risk and trigger factors for the development of eating disorders in female 1
elite athletes. Med Sci Sports Exerc 1994: 26: 414-419. 2
Vallerand RJ. Vers une méthodologie de validation transculturelle de questionnaires 3
psychologiques : Implications pour la recherche en langue française [Towards a 4
methodology of transcultural validation of psychological questionnaires: Implications 5
for research in the French language]. Can Psychol 1989: 4: 662-680. 6
Wallston KA, Wallston BS, DeVellis R. Development of the Multidimensional Health Locus of 7
Control Scales (MHLCS). Health Educ Monogr 1978: 6: 160-170. 8 3 4 5 6 7 8 9 10 11 12 13 14 15 16 17 18 19 20 21 22 23 24 25 26 27 28 29 30 31 32 33 34 35 36 37 38 39 40 41 42 43 44 45 46 47 48 49 50 51 52 53 54 55 56 57 58 59 60
PROOF
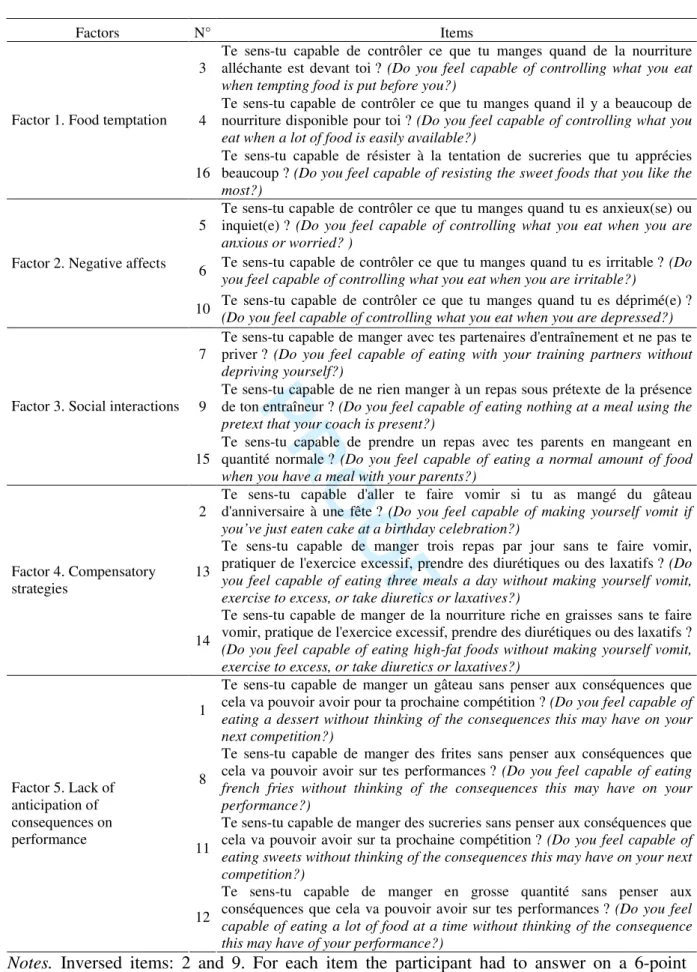
Table 1. Self-Regulation of Eating Attitudes in Sports Scale (SREASS)
1
Factors N° Items
3
Te sens-tu capable de contrôler ce que tu manges quand de la nourriture alléchante est devant toi ? (Do you feel capable of controlling what you eat when tempting food is put before you?)
4
Te sens-tu capable de contrôler ce que tu manges quand il y a beaucoup de nourriture disponible pour toi ? (Do you feel capable of controlling what you eat when a lot of food is easily available?)
Factor 1. Food temptation
16
Te sens-tu capable de résister à la tentation de sucreries que tu apprécies beaucoup ? (Do you feel capable of resisting the sweet foods that you like the most?)
5
Te sens-tu capable de contrôler ce que tu manges quand tu es anxieux(se) ou inquiet(e) ? (Do you feel capable of controlling what you eat when you are anxious or worried? )
6 Te sens-tu capable de contrôler ce que tu manges quand tu es irritable ? (Do you feel capable of controlling what you eat when you are irritable?)
Factor 2. Negative affects
10 Te sens-tu capable de contrôler ce que tu manges quand tu es déprimé(e) ? (Do you feel capable of controlling what you eat when you are depressed?) 7
Te sens-tu capable de manger avec tes partenaires d'entraînement et ne pas te priver ? (Do you feel capable of eating with your training partners without depriving yourself?)
9
Te sens-tu capable de ne rien manger à un repas sous prétexte de la présence de ton entraîneur ? (Do you feel capable of eating nothing at a meal using the pretext that your coach is present?)
Factor 3. Social interactions
15
Te sens-tu capable de prendre un repas avec tes parents en mangeant en quantité normale ? (Do you feel capable of eating a normal amount of food when you have a meal with your parents?)
2
Te sens-tu capable d'aller te faire vomir si tu as mangé du gâteau d'anniversaire à une fête ? (Do you feel capable of making yourself vomit if you’ve just eaten cake at a birthday celebration?)
13
Te sens-tu capable de manger trois repas par jour sans te faire vomir, pratiquer de l'exercice excessif, prendre des diurétiques ou des laxatifs ? (Do you feel capable of eating three meals a day without making yourself vomit, exercise to excess, or take diuretics or laxatives?)
Factor 4. Compensatory strategies
14
Te sens-tu capable de manger de la nourriture riche en graisses sans te faire vomir, pratique de l'exercice excessif, prendre des diurétiques ou des laxatifs ? (Do you feel capable of eating high-fat foods without making yourself vomit, exercise to excess, or take diuretics or laxatives?)
1
Te sens-tu capable de manger un gâteau sans penser aux conséquences que cela va pouvoir avoir pour ta prochaine compétition ? (Do you feel capable of eating a dessert without thinking of the consequences this may have on your next competition?)
8
Te sens-tu capable de manger des frites sans penser aux conséquences que cela va pouvoir avoir sur tes performances ? (Do you feel capable of eating french fries without thinking of the consequences this may have on your performance?)
11
Te sens-tu capable de manger des sucreries sans penser aux conséquences que cela va pouvoir avoir sur ta prochaine compétition ? (Do you feel capable of eating sweets without thinking of the consequences this may have on your next competition?) Factor 5. Lack of anticipation of consequences on performance 12
Te sens-tu capable de manger en grosse quantité sans penser aux conséquences que cela va pouvoir avoir sur tes performances ? (Do you feel capable of eating a lot of food at a time without thinking of the consequence this may have of your performance?)
Notes. Inversed items: 2 and 9. For each item the participant had to answer on a 6-point 2
Likert-type scale from “not at all agreed” (1) to “totally agreed” (6). 3 3 4 5 6 7 8 9 10 11 12 13 14 15 16 17 18 19 20 21 22 23 24 25 26 27 28 29 30 31 32 33 34 35 36 37 38 39 40 41 42 43 44 45 46 47 48 49 50 51 52 53 54 55 56 57 58 59 60
PROOF
Table 2. Descriptive Statistics and Coefficients of Internal Consistency (Cronbach
1
alpha) for the Self-Regulation of Eating Attitudes in Sports Scale constructs (N = 160). 2
Scale M SD α
Factor 1. Food temptation 3.92 .17 .84
Factor 2. Negative affects 3.99 .06 .90
Factor 3. Social interaction 5.16 .22 .88 Factor 4. Compensatory strategies 4.77 .18 .92 Factor 5. Lack of anticipation of consequences on
performance
4.16 .46 .85
Notes. M: Means; SD: Standard deviation; α: Cronbach alpha; scores can range from 1 to 6. 3 3 4 5 6 7 8 9 10 11 12 13 14 15 16 17 18 19 20 21 22 23 24 25 26 27 28 29 30 31 32 33 34 35 36 37 38 39 40 41 42 43 44 45 46 47 48 49 50 51 52 53 54 55 56 57 58 59 60
PROOF
Table 3. Goodness-of-Fit Indices of Factorial Invariance Tests across Gender of the Self-Regulation of Eating Attitudes in Sports Scale 1
Model χ²
(SB) χ²
(ML) df p CFI TLI RMSEA
Comparison model ∆÷² (SB) ∆df ∆p ∆ χ ² (ML) ∆df ∆p ∆׀CFI׀ ∆׀RMSEA׀ Malesa 133.38 133.40 94 .005 .96 .95 .08 - - - - Femalesb 13.76 14.30 8 .000 .98 .98 .05 - - - - 1 Dimensional (no invariance) 243.51 298.49 188 .05 .98 .97 .03 - - - - 2 Metric (λ equal) 258.58 315.07 198 .04 .98 .97 .03 1 15.07 10 NS 16.58 10 NS 0 .001 3 Strong (τ equal) 273.16 333.96 212 .03 .98 .97 .03 2 14.57 14 NS 18.88 14 NS 0 0 4 Strict (δ equal) 337.12 423.47 228 .001 .95 .95 .058 3 63.96 16 S 89.51 16 S .028 .029 5 Partial strict (δ10 free ) 293.18 35.41 224 .009 .98 .98 .032 3 2.02 12 NS 16.45 12 NS .007 .003
2
Notes. χ² (ML): Mean level chi-square; χ² (BS): Bollen-Stine chi-square; df: Degrees of freedom; CFI: Comparative Fit Index;
3
TLI: Tucker-Lewis Index; RMSEA: Root Mean Square Error of Approximation; ∆χ²: Difference in χ²; ∆df: Differences in degrees
4
of freedom; ∆CFI: Difference in Comparative Fit Index; ∆RMSEA: Difference in Mean Square Error of Approximation; a n = 98; b
5
n = 83; τ: Intercepts; δ: Mean.
6
Scandinavian Journal of Medicine & Science in Sports - PROOF
3 4 5 6 7 8 9 10 11 12 13 14 15 16 17 18 19 20 21 22 23 24 25 26 27 28 29 30 31 32 33 34 35 36 37 38 39 40 41 42 43 44 45 46 47 48 49 50 51 52 53 54 55
PROOF
Table 4. Descriptive Statistics and Inter-Subscale Correlations of the Self-Regulation of
Eating Attitudes in Sports Scale and their Associations to Locus of Control and Eating
Attitudes (N = 84)
1 2 3 4 5 6 7 8 9 10 11 12
1. Internal locus of control a - 2. External locus: the coach a -.04 - 3. External locus: parents a -.06 .51* -
4. External locus: luck a -.21 .31* .11 -
5. Self-regulation in context of food temptation b .07 -.22* -.05 -.14 - 6. Self-regulation in context of negative affects b .10 -.07 .08 -.15 .57* - 7. Self-regulation in context of social interaction b .17 -.25* .23* -.02 .25* .33* - 8. Self-regulation in context of compensatory strategies b -.14 -.05 .10 .025 -.08 -.11 -.02 - 9. Self-regulation in context of lack of anticipation of consequences on performance b .14 -.35* -.10 -.02 .03 .17 .39* .07 - 10. Diet c -.02 .30* .07 -.02 -.07 -.33* -.22* .05 -.63* - 11. Control of eating c -.19 .36* .15 .29* -.15 -.13 -.17 .13 -.41* .43* - 12. Bulimia c -.09 .28* .15 .28* -.29* -.51* -.24* .20 -.40* .65* .52* - M 3.28 1.90 2.40 1.60 3.91 3.70 4.10 3.00 4.60 2.64 2.16 2.01 SD .47 .60 .70 .60 1.10 1.30 .07 1.40 1.30 .86 .69 .84 Range 1-4 1-4 1-4 1-4 1-6 1-6 1-6 1-6 1-6 1-6 1-6 1-6
Notes. (1, 2, 3, 4) Subscales of the French locus of control scale specific to athletes’ eating behaviors adapted from Wallston et al. (1978); (5, 6, 7, 8, 9) subscales of the SREASS; (10, 11, 12) subscales of the Eating Attitudes Test (EAT) of Garner et al. (1982). M: Mean, SD: Standard deviation; * p < .05. 3 4 5 6 7 8 9 10 11 12 13 14 15 16 17 18 19 20 21 22 23 24 25 26 27 28 29 30 31 32 33 34 35 36 37 38 39 40 41 42 43 44 45 46 47 48 49 50 51 52 53 54 55 56 57 58 59 60
PROOF
FIGURES
1
2
Figure 1. Coefficient of Estimation and Standard Error of Measurement of the
Self-3
Regulation of Eating Attitudes in Sports Scale 4
Notes. λ = Standardized factor loading; x = Latent factor indicator; φ = covariance 5
between latent factors; δ = Error variance of latent factor indicator.*: p < .05; Standard 6
coefficients of estimation are all significant at p < .05. 7 8 9 3 4 5 6 7 8 9 10 11 12 13 14 15 16 17 18 19 20 21 22 23 24 25 26 27 28 29 30 31 32 33 34 35 36 37 38 39 40 41 42 43 44 45 46 47 48 49 50 51 52 53 54 55 56 57 58 59 60