HAL Id: hal-01738414
https://hal.insa-toulouse.fr/hal-01738414
Submitted on 13 Jun 2019
HAL is a multi-disciplinary open access archive for the deposit and dissemination of sci-entific research documents, whether they are pub-lished or not. The documents may come from teaching and research institutions in France or abroad, or from public or private research centers.
L’archive ouverte pluridisciplinaire HAL, est destinée au dépôt et à la diffusion de documents scientifiques de niveau recherche, publiés ou non, émanant des établissements d’enseignement et de recherche français ou étrangers, des laboratoires publics ou privés.
Influence of aggregate shapes on drying and carbonation
phenomena in 3D concrete numerical samples
Thomas de Larrard, Benoit Bary, Erwan Adam, Francis Kloss
To cite this version:
Thomas de Larrard, Benoit Bary, Erwan Adam, Francis Kloss. Influence of aggregate shapes on drying and carbonation phenomena in 3D concrete numerical samples. Computational Materials Science, Elsevier, 2013, 72, pp.1–14. �10.1016/j.commatsci.2013.01.039�. �hal-01738414�
1
Influence of aggregate shapes on drying and carbonation phenomena in
3D concrete numerical samples
Thomas de Larrard(1,2), Benoit Bary(1)*, Erwan Adam(3) and Francis Kloss(3)
(1) CEA, DEN, DPC, SECR, Laboratoire d’Etude du Comportement des Bétons et des Argiles, F-91191, Gif-sur-Yvette, France.
(2) LMDC, UPS – INSA Toulouse, France.
(3) CEA, DEN, DM2S, SFME, Laboratoire de Génie Logiciel et de Simulation, F-91191, Gif-sur-Yvette, France.
Abstract
This study aims at generating numerical 3D samples of concrete so as to study the effects of the granular inclusions shape on the macroscopic kinetics of reactive transport phenomena. Two types of mesostructure configurations are considered: the first one is composed of a matrix of mortar in which are randomly distributed inclusions corresponding to the concrete coarse aggregates, and the second one also includes a steel rebar. The choice of a mesoscopic modeling for the mortar matrix is based on the need to obtain numerical structures of reasonable size. In particular, the Interfacial Transition Zones (ITZ) are ignored, as this hypothesis seems acceptable for coarse aggregates. This study is applied to the case of drying and atmospheric carbonation by using simplified models solved by the finite element code Cast3M. The purpose is to quantify the influence of the aggregate shape on the kinetics of macroscopic transfer and the isovalue lines for some physical variables representative of the reactive transport problems: saturation degree for drying, and porosity, calcite and portlandite concentrations for carbonation. Basic aggregates shapes are studied (spheres, cubes), as well as more complex ones (Voronoi particles) which are supposed to be more representative of real aggregates. The effects of ‘non-isotropic’ shapes (oblate and prolate ones) are also investigated. It is shown that the influence of the aggregate shapes appears negligibly small on macroscopic indicators, except for oblate shapes with aspect ratios of 3. This latter case also exhibits substantial local delayed effects and a more important variability, which may have some importance for a precise description and estimation of degradation processes related to steel rebar corrosion.
Keywords: numerical concrete, aggregate shape, 3D simulations, drying, carbonation.
2
1. INTRODUCTION
Concrete is a heterogeneous material constituted of a matrix of hardened cement paste in which are distributed granular particles of various size and shape. The durability of this material is known to be highly dependent on its transfer properties, which influence significantly the migration of aggressive substances (e.g., carbon dioxide, chlorides...) from the environment. In partially saturated conditions, these properties strongly depend on both the saturation degree and the material microstructure, and their variations as a function of time. As the main mechanisms of transport and chemical degradation occur in the cement paste phase, it appears of great interest to quantify the effects of the granular particles on these mechanisms. Experimentally as well as numerically, the role of the size, volume fraction and shape of aggregates on various phenomena as microcracking or macroscopic mechanical properties has been investigated by several authors (e.g. [1–6]). Their results show that the aggregate characteristics affect significantly the overall concrete behaviour, and in particular the microcracking development. As a consequence, it is expected that the effects of the shape, relative spatial arrangement and orientation of the particulate phase also influence durability features as for instance the saturation degree including its variability throughout the material and the chemical reactions.
In this paper, we investigate by means of 3D finite element (FE) simulations the effects of particles of different shapes on two phenomena related to concrete durability, namely drying and atmospheric carbonation. This work takes place in the context of studies aiming at characterizing the corrosion of reinforcement steel due to the depassivation mechanisms resulting from carbonation, and its role upon the cracking risks and durability of concrete structures. We focus here on the influence of aggregates on the first stage of this degradation phenomenon, i.e. drying and carbonation, with special regards on their kinetics and the local effects in the vicinity of steel rebars. From a general viewpoint, the numerical simulation of materials behaviour and properties by means of 3D reconstructed microstructures at micro or mesoscale is a topic of increasing interest in the material research community. Its intensive developments for about two decades follow the growing power of computers. The applications of such numerical techniques to cementitious materials cover vast domains ranging from the estimation of early age properties related usually to a hydration model (e.g., [7–10]), calculation of transfer or mechanical properties for sound and degraded materials (e.g. [11–18]) and simulation of cracking behaviour (e.g. [1,2,19,20]). It is noteworthy that in most situations the simulations aim at obtaining evaluations of effective (or more precisely ‘apparent’) properties from the generated numerical samples, and then refer to the notion of representative element volume (REV). The definition of the REV is in fact tricky as it
3
depends on the considered material and the sought physical properties (e.g. [21]). By contrast, relatively few studies are devoted to the simulation of the behaviour of heterogeneous structures or elements of structures, as for instance in [22]. From the numerical point of view, in addition to the well-known and widespread finite element method (FEM), alternative and promising methods have been employed to solve the considered problems in particular in the mechanics context, as the extended-FEM (XFEM, e.g. [23]) or fast Fourier transform (FFT, e.g. [8,16,17]). A related challenging issue lies in the geometry construction and especially in the mesh generation. Indeed, unstructured meshes may be extremely difficult to create in the case of complex microstructures, in particular when very close particle boundaries and/or particles with very different sizes are expected. Grid meshes may then represent an interesting option to circumvent the corresponding meshing difficulties; however this method suffers in general from an imprecise description of heterogeneities boundaries, which is known to impact significantly the transport properties as diffusivity (see e.g. [24]). On the other hand, the XFEM takes advantage of the level set method to avoid generating complex meshes, but should also be carefully applied in the case of microstructures exhibiting close particles [25]. Another aspect of great concern when considering 3D simulations is the numerical schemes adopted for solving the problem. While general FEM is known to be costly in terms of required memory and computation time, alternative methods, in particular the ones based on regular grid meshes, may be of interest in certain applications due to very efficient algorithms and reduced needed memory. On the other hand, classical FEM remains attractive when complex problems (for instance defined by a set of coupled nonlinear equations, or including specific elements as interface elements requiring special treatments) are considered. Moreover, the growing power of computers in terms of both memory and parallelisation, combined with the improvement of meshing algorithms, allow solving problems of increasing size with FEM.
In this study, several 3D microstructures with various particle shapes (simple ones as spheres and cubes and more complex ones based on Voronoi particles) and size distribution following a sieve curve are generated. Drying and carbonation processes are modelled by one and two coupled mass balance equations, respectively. To simplify, in this first stage the effects of interfacial transition zones (ITZ) surrounding the aggregates are not taken into account. The choice of FEM associated with classically meshed microstructures (i.e. triangle surface elements representing the boundaries of heterogeneities and tetrahedral elements their volume) is obvious and relies first on the fact that the considered geometries are quite simple so that meshing procedures can be efficiently applied. Second, the use of the versatile FE code Cast3M [26] allows to relatively easily implementing the equations by making use of the
4
oriented-object language GIBI. The numerical results are analyzed and compared in terms of time evolution of the mean value and coefficient of variation of the depth at which some characteristic quantities (saturation degree for drying, calcite concentration, portlandite dissolution and porosity for carbonation) reach some given value. In a second phase, a steel reinforcement rebar is embedded in the mesostructures, and the response obtained locally in the neighbouring of this rebar is specifically examined and discussed.
2. MICROSTRUCTURE GENERATION
We describe in this section the different configurations and geometries investigated in this study and the procedure applied to obtain the corresponding numerical models. Basically, the 3D microstructures under consideration are generated by randomly dispersing particles of given shape and size in a box. The minimal distance between two inclusions and one inclusion and one box face is prescribed by the user. The purpose being to analyze the effects of the particle shape on drying and carbonation phenomena, we propose here to limit our study to microstructures with one surface exposed to the environment. This requirement is fulfilled by imposing a non-overlapping condition between granular particles and the surfaces of the box, then by cutting all the surfaces (i.e. reducing the dimensions of the box) except for the exposed surface. This implies that the initial box dimensions are greater than the final ones. The box final dimensions are chosen to be 10×10×8 cm, corresponding to a surface in contact with the environment of 100 cm2. Such dimensions are assumed to be a good compromise between the representativeness of the material and the number of finite elements of the associated 3D mesh. The initial box dimensions are set to 12×12×9 cm, meaning that slices of thickness 1 cm are removed from the 5 cut faces of the box. To analyze the effects of the aggregates and their interactions with the steel reinforcements on drying and carbonation processes, we propose to consider two configurations of microstructures, one without and the other with the steel rebar, respectively. The first type will then serve to quantify general characteristics regarding concrete at the mesoscale, while the second will focus more particularly on the neighbouring of the rebars. A software developed in python language and making use of the geometry module of the integration platform for numerical simulations Salome [27] automatically generates the samples, provided that all dimensions and particle configurations are prescribed by the user. This module provides a list of functions for working with computer-aided design models and can correct them to be consistent with meshing algorithms. The particles are randomly placed in the box, from the bigger to the smaller ones (see [14] for further details). For the geometries with a steel reinforcement, the rebar is assumed cylindrical and is positioned first in the box. In the case of non-spherical shapes, the
5
minimum distance between the particle that is being inserted and all the other inclusions already present is exactly calculated via a specific Salome function, allowing to strictly respecting the non-overlapping distance required by the user.
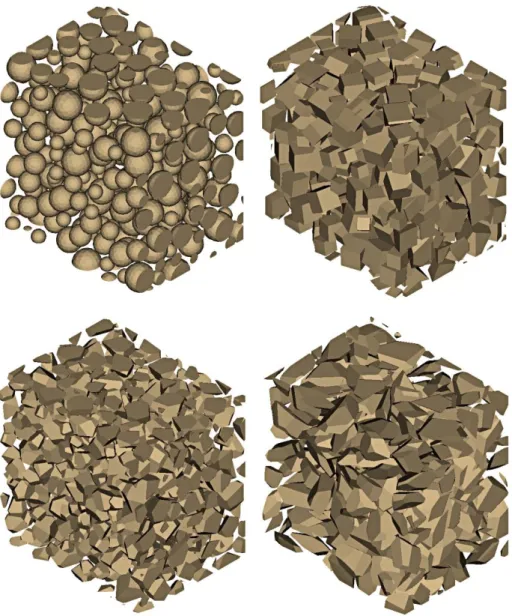
The influence of the particle shape is investigated through different samples generated with spherical and cubic inclusions, and with more complex shapes obtained by extracting particles from a classical Voronoi particle assemblage achieved with the software Qhull [28,29]. Several cases of prolate (long) and oblate (flat) shapes have also been analyzed. These shapes are simply obtained by applying a scale transformation on the Voronoi particles in one or two directions for prolate and oblate particles, respectively. Three different aspect ratios are considered: 2 and 3 for flat aggregates (meaning that the dimensions of the particles are multiplied by 2 and 3, respectively, in 2 perpendicular directions), and 1.5 and 3 for elongated aggregates. As mentioned above, the ITZ surrounding the aggregates are neglected to simplify in this study. Moreover, to limit the computational time due to an excessive quantity of degrees of freedom in the numerical models, the number of inclusions is voluntarily reduced. Only the coarser aggregates composing the concrete with size (equivalent diameter) greater than 8 mm are retained, according to the discretized sieve curve listed in Table 1, which indicates both the number and related volume fraction of particles in each size class. Note that the given dimensions are assumed to correspond to the sphere shape considered here as a reference. For the other shapes, and in particular for both prolate and oblate aggregates, we have chosen to conserve the same number of particles per size class. This means that the maximum aggregate dimensions vary as a function of the shape, since its volume is kept unchanged. In the microstructures free of steel rebars, the imposed number of particles is 470, corresponding to an initial volume fraction of 0.297 for the yet uncut box. It is noteworthy that due to the random placement of particles and of the subsequent cutting procedure, the effective final volume fraction depends slightly on the microstructure and ranges from 0.328 to 0.34 (see Table 2 for further details). The Figure 1 shows a realization of particles assemblage obtained for the spherical (up left), cubic (up right), Voronoi (down left) and prolate Voronoi (down right) shapes without steel rebar. The face exposed to drying and carbonation appears in the foreground left of the microstructures, while the other faces are cut. Regarding the microstructures incorporating a steel rebar, we have chosen to conserve the same aggregate volume fraction in the concrete phase to ease comparison between the configurations. As a consequence, the number of inclusions has to be corrected to account for the rebar volume in the samples. A diameter of 12 mm has been selected for this rebar, and it is placed at mid-height of the structure and at 20 mm from the exposed surface. In these
6
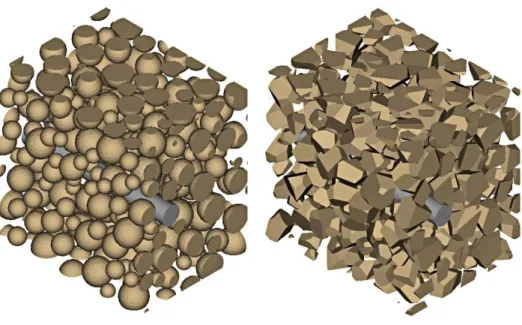
conditions, the number of aggregates is set to 404, which ensures to keep an aggregate volume fraction of 0.297 in the concrete. The Figure 2 presents a realization of microstructures with one steel reinforcement rebar in the case of spherical and Voronoi aggregate shapes.
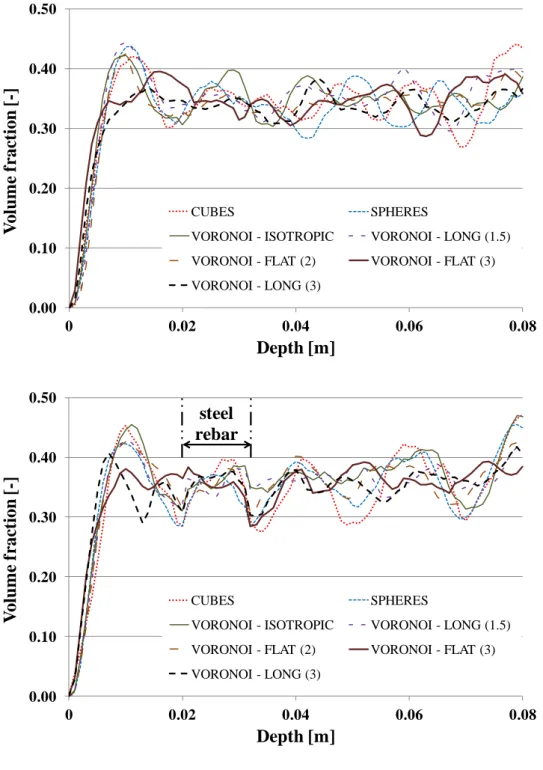
Generally, when dealing with numerically reconstructed microstructures the question of the representativeness of the generated samples arises. In the present case, this aspect concerns more particularly the spatial distribution and arrangement of the aggregates. It will be seen in the following sections that for the considered problems of drying and carbonation, the most influential particle shape is the flat one with higher aspect ratio. We then propose to carry out a specific study to evaluate the effects of the random placement process of the inclusions in this particular case of flat aggregates with aspect ratio equal to 3. For this purpose two other samples will be generated and the numerical results will be analyzed and compared. Moreover, as it may be expected that the spatial arrangement (i.e. position and orientation) of the aggregates is shape-dependant especially near the exposed surface, we also evaluate the evolution of the averaged volume fraction of the particulate phase as a function of the depth for the different microstructures. Although this provides only limited information with regard to the precise respective position of the aggregates, this general characteristic will be useful from the viewpoint of our comparative study. The average procedure is performed quite simply on planes parallel to the exposed surface. The Figure 3 presents the results of the aggregate volume fraction evolutions for the microstructures without (up) and with (down) steel rebar. Overall, we note that these evolutions are quite similar within the two configurations, with relatively large variations ranging roughly between about 0.28 and 0.42. Interestingly, we also remark that a maximum value is generally calculated at a depth near 0.009-0.01 m, except for the cases with inclusions exhibiting high aspect ratios (i.e. flat and elongated particles). It is noteworthy that the position of this peak corresponds approximately to half of the maximum size of the aggregates with aspect ratio close to 1 plus the minimal distance imposed between inclusions and the box faces (1 mm). This peak could result from the placement algorithm which may tend to slightly concentrate the aggregate phase in this region, due to the truly random and size-dependant positioning process (i.e., from larger to smaller particles). Further investigations, including a comparison with real concrete microstructures, would be necessary to clarify this aspect. On Figure 3 down is also indicated the location of the steel rebar, and we observe that its presence does not perturb significantly the aggregate volume fraction in the concrete phase. However, we remark in the vicinity of the rebar edges (i.e., near depths of 20 and 32 mm) a slight decrease of the particle concentration, consecutive to the space free of aggregates located around the rebar and due to
7
the prescribed minimal distance between the particles and the other obstacles in the box. To conclude on the microstructure geometry, we consider in the following that the main characteristics of the generated samples are sufficiently similar to allow a clear and meaningful comparison of the results regarding the drying and carbonation phenomena.
Once the geometry of the microstructures is created, the corresponding conforming mesh is generated via Salome. We used the automatic meshing softwares BLSURF and GHS3D developed by Distene [30] and plugged in Salome to compute the surface meshes and the volume elements. BLSURF is a mesh generator for surfaces composed of parametric patches, conforming to a prescribed size map. GHS3D is a meshing software component which creates automatically tetrahedral meshes out of closed triangular surface meshes. It is noteworthy that the meshing procedure is very fast as it takes only several minutes to create the meshes. In fact, the geometry construction as a whole is more time-consuming than the meshing phase, except for the case of spherical particles. This is mainly due to the numerous and relatively complex calculations of minimum distances between non-spherical particles that are required in the insertion stage. For the extreme cases of inclusions with aspect ratio far from 1 (i.e., flat or elongated shapes), the insertion becomes more and more difficult since specific orientations of the particles are rapidly necessary, in addition to specific locations of the gravity centre, to fill the available space in the box. It may take up to several hours on a classical Linux machine where only one core is used to achieve the placement of the 470 aggregates in case of prolate shapes with aspect ratio of 3, while only several minutes are required for spheres. For those ‘difficult’ cases, at the end of the process (i.e. when there remains little free space), it may take more than 5000 tries to place one aggregate. However, strictly speaking, for the problems and configurations considered in this study, the generation of the numerical samples is not a difficult task, which plainly justifies the recourse on FEM.
The number of linear tetrahedra in the different meshes in the cases with no steel rebars is listed in Table 2. Due to the curvature of the surfaces of the spherical inclusions, the number of elements needed for their discretization is greater than for the other shapes which exhibit plane surfaces. Note that the conditions imposed for creating the meshes, i.e. a maximum element size of 2 mm for the triangles composing the particle surfaces, is similar for all microstructures. The number of elements in the matrix that will be used for the computations (the particle phase is not included in the calculations) ranges then between about 280,000 and 500,000 for the cubic and spherical shape, respectively.
8
3. DRYING AND CARBONATION MODEL
We briefly present in this section the model proposed for describing the coupled drying and carbonation of concrete, which is a simplified version of the model initially proposed in [31] and modified in [32]. Basically, this model assumes that the main phenomena involved in the carbonation are the water migration through the connected porosity, and the diffusion of carbon dioxide in the gaseous phase and its subsequent interactions with the hydrated phases initially present to produce calcium carbonate (calcite). Accordingly, it is governed by 2 coupled mass conservation equations written for water (1) and carbon dioxide in gas phase (2) in the form:
2 l r l l r r H O S K k S P W t (1)
2 1 , r c c CO r c S P f D P W tS
(2)In equation (1), it is implicitly assumed that the main transport process for moisture results from gradients of water pressure 𝑃𝑙 (permeation), i.e. the migration of vapour in gas phase is neglected. This assumption was analyzed and justified in the case of high-performance concrete in [33], and has been since applied in a number of contributions, see e.g. [31]. Moreover, the pressure of the gas phase is neglected with respect to the one of the liquid, such that 𝑃𝑐 ≈ −𝑃𝑙, with 𝑃𝑐 the capillary pressure. Accordingly, equation (1) is driven by 𝑃𝑙, since it also appears via 𝑃𝑐 in the desorption isotherm curve defining classically the relation between the saturation degree 𝑆𝑟 and 𝑃𝑐. The following relation proposed by [34] is retained for modelling the isotherm curve:
𝑆𝑟 = (1 + ( 𝑃𝑐 𝑃0) 1 1−𝑚 ) −𝑚 (3)
where 𝑃0 and m are calibration parameters. The parameters involved in equation (1) are defined as follows: 𝐾(𝜙) is the intrinsic permeability coefficient, depending on the porosity 𝜙, which is ruled by the relations given in [34], as well as the relative permeability for liquid 𝑘𝑟(𝑆𝑟) , as: 𝐾(𝜙) = 𝐾0( 𝜙 𝜙0 )3(1 − 𝜙0 1 − 𝜙) 2 (4) 𝑘𝑟(𝑆𝑟) = √𝑆𝑟(1 − (1 − 𝑆𝑟1/𝑚)𝑚)2 (5)
where the constants 𝜙0 and 𝐾0 are the initial porosity and corresponding permeability; 𝜌𝑙 and 𝜂 are the density and dynamic viscosity of water, respectively.
9
Equation (2) is driven by the partial pressure of carbon dioxide (CO2) in the gaseous phase denoted as 𝑃𝑐̅. Note that this equation is derived with the hypotheses that the pressure of the whole gas phase remains constant, and that the CO2 behaves as an ideal gas. This latter assumption formally reads 𝜌𝑐̅ = 𝑀𝑐̅𝑃𝑐̅/(𝑅𝑇), with 𝜌𝑐̅ and 𝑀𝑐̅ the density and molar mass of CO2, respectively, 𝑅 the perfect gas constant and 𝑇 the temperature. 𝑓(𝜙, 𝑆𝑟) and Dc are the
reduction factor and diffusion coefficient of CO2 in gas phase, respectively, so that the product of both can be considered as the effective diffusion coefficient of carbon dioxide through the porous material. The reduction factor retained in this study is due to Millington [35] and takes the form:
𝑓(𝜙, 𝑆𝑟) = 𝜙4⁄3(1 − 𝑆𝑟)10⁄3 (6)
The coupling between equations (1) and (2) appears through the saturation degree 𝑆𝑟 and equation (3), but also in the rates of water formation WH O2 and carbon dioxide dissolution
2 CO W expressed by:
2 2 2 H O MH O Sr Npor H ONCSH W (7) 2 CO RT S Nr cal W (8)In these relations, 𝑁̇𝑐𝑎𝑙 is the molar formation rate of calcite, 𝑁̇𝑝𝑜𝑟 and 𝑁̇𝐶𝑆𝐻 denote the molar dissolution rate of portlandite and of other hydrates (mainly C-S-H), respectively, and 𝑀𝐻2𝑂 is the molar mass of water. We have indeed considered separately the dissolution - precipitation processes of portlandite and of the other hydrates, due to the higher reactivity of portlandite [31,36,37]. The coefficient 𝛼𝐻2𝑂 stands for the average number of moles of water obtained from the dissolution of one mole of ‘various’ hydrates. The expressions of these molar formation rates appear in equations (9)-(11), where kH is the Henry constant for carbon dioxide, and 𝑘𝑠𝑙(𝑆𝑟) is a function introduced in [38] and slightly modified in [31] to describe at a macroscopic scale the influence of the saturation degree on the chemical reaction processes (i.e. the reduction of water in the pores leads to decrease the reactions). The expression of 𝑘𝑠𝑙(𝑆𝑟) is given in equation (12).
CSH por cal N N N (9)
r H p
p c sl por k S k k V P N ~ (10)
r H CSH
cal c sl CSH k S k k C P N ~ (11)10 𝑘𝑠𝑙(𝑆𝑟) =
1
1 + 625(1 − 𝑆𝑟)4 (12)
The functions kp
Vp and kCSH
Ccal
appearing in equations (10)-(11) are kinetic coefficients depending on the current volume fraction of portlandite Vp and concentration of calcium in solid phase Ccal, respectively. It should be stressed that the simplified chemical reactions relative to the hydrate dissolution – calcite precipitation as expressed by these equations correspond to first order kinetic law with respect to the CO2 pressure. The kinetic coefficient for the calcite formation from portlandite kp is assumed to evolve as proposed in [36] and applied in [32], i.e. the calcite is supposed to form a growing layer surrounding the portlandite crystals during the dissolution process. The consequence is that this layer progressively reduces the corresponding chemical reactions kinetics, which are driven by the diffusive phenomena through the calcite layer. Assuming spherical portlandite crystals and calcite coating, the expression of this kinetic coefficient is obtained as [32]:𝑘̃𝑝(𝑉𝑝) = 3𝑉𝑝 𝑅𝑝0(1 − 𝜅𝑝 )2⁄3 𝐷𝐶𝑎𝐶𝑂3 𝜆 + 𝑅𝑝0((1 + 𝜅𝑝(𝑉̅𝐶𝑎𝐶𝑂3 𝑉̅𝐶𝐻 − 1)) 1 3 ⁄ − (1 − 𝜅𝑝)1⁄3) (13) with 𝜅𝑝 = 1 − 𝑉𝑝 𝑉𝑝0 (14)
In these relations appear several model parameters having the following signification: 𝑉𝑝0 defines the initial volume fractions of portlandite; 𝑅𝑝0 is the initial equivalent radius of portlandite crystals; 𝜆 is assumed to stand for the initial calcite layer depth (for 𝜅𝑝 = 0) so as to get 𝑘𝑝(𝑉𝑝0) equal to the kinetic coefficient of calcite formation in solution; 𝑉̅𝐶𝐻 and 𝑉̅𝐶𝑎𝐶𝑂3 are the molar volume of portlandite and calcite and 𝐷𝐶𝑎𝐶𝑂3 is the diffusion coefficient of the calcite layer.
The kinetic coefficient for the other hydrates is assumed to evolve linearly with the calcium concentration [32], as:
𝑘̃𝐶𝑆𝐻(𝐶𝑐𝑎𝑙) = 𝛼𝐶𝑆𝐻 𝐶𝑐𝑎𝑙
𝐶𝑐𝑎𝑙0 (15)
where 𝛼𝐶𝑆𝐻 is a calibration parameter and 𝐶𝑐𝑎𝑙0 is the initial solid calcium concentration of the ‘various’ hydrates (in mol/m3).
The main simplification of this numerical model in comparison to the previous versions [31,32] concerns the calcium concentration calculation. Indeed, in the previous versions of the
11
model, a mass balance equation describing the reactive diffusion of calcium ions in pore solution was solved, coupled with water and carbon dioxide mass balance equations similar to (1)-(2). This equation intended to account for the dissolution - precipitation phenomena related to the initial hydrated phases, and for the corresponding migration of calcium in the solution. In the present approach, no diffusion of calcium is considered and is instead replaced by a local chemical equilibrium of calcium, meaning that the calcium dissolved from portlandite and the other hydrates is locally transformed into calcite. Formally, this is equivalent to considering that the whole calcite formation process (including CO2 diffusion) is faster than calcium migration through the solution. It will be shown below through a numerical comparison between the two models that this simplification has a very weak influence on the results in the case of accelerated carbonation, i.e. when the CO2 pressure is relatively high. Further investigations, which are beyond the scope of this paper, would be necessary to analyze its effects in atmospheric carbonation conditions.
This model was implemented in the FE code Cast3M [26], and the equations solved successively and iteratively with a fully implicit numerical scheme. The model was tested on 2D and 3D numerical simulations on concrete for both accelerated and atmospheric carbonation. The material properties as well as the model parameters were chosen equivalent to those proposed in [32] for the comparison to be relevant. The material considered here is a CEM I concrete with a water/cement ratio equal to 0.42. The parameters for the drying model are 𝑃0=59.08 MPa and m=0.532. The intrinsic permeability K0 is taken equal to 2.1×10⁻²² m2. The initial porosity of the material is 8%. The diffusion coefficient Dc for CO2 is considered equal to 6.82×10⁻⁹ m2/s. The dissolution - precipitation kinetic coefficients are set to the following values: 𝛼𝐶𝑆𝐻 = 4×10⁻⁴; 𝜆 = 5×10⁻⁷ m; 𝑅
𝑝0 = 5×10⁻⁶ m; 𝐷𝐶𝑎𝐶𝑂3 = 5×10-13 m2/s; 𝛼𝐻2𝑂 = 2.04.
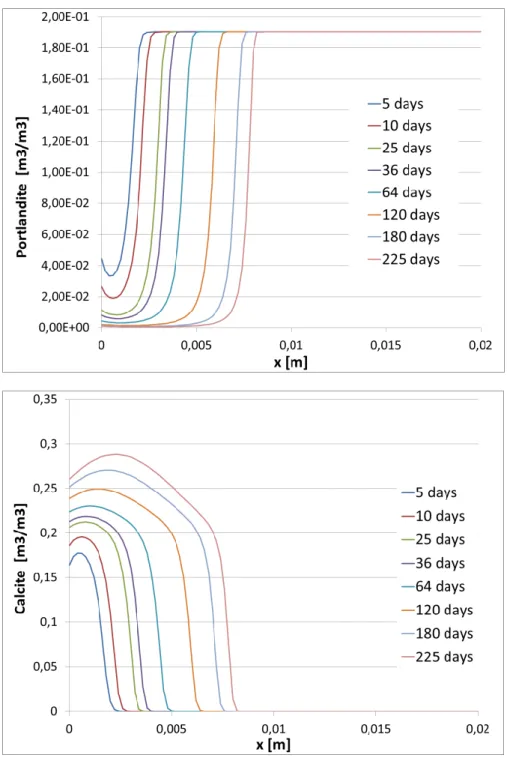
Some numerical results are now presented in the case of the simulation of an accelerated carbonation test. This simulation is performed in 2D, but the phenomena are one-dimensional in the sense that only one row of 100 identical elements is considered with one edge (the exposed face) submitted to carbonation. The dimensions of the structure are 5 cm long and 0.05 cm high, with carbonation processes directed along the largest dimension. The material is initially fully saturated, and exposed to drying at Sr=65% and carbonation at 𝑃𝐶𝑂2= 50 kPa on the exposed face. The numerical profiles of portlandite and calcite volume fractions are represented in Figure 4 for several terms. We note that they are in very good agreement with the ones obtained with the previous and more sophisticated model in [31,32]. As the pH is not directly accessible numerically, the carbonation depth as defined by the widely used
12
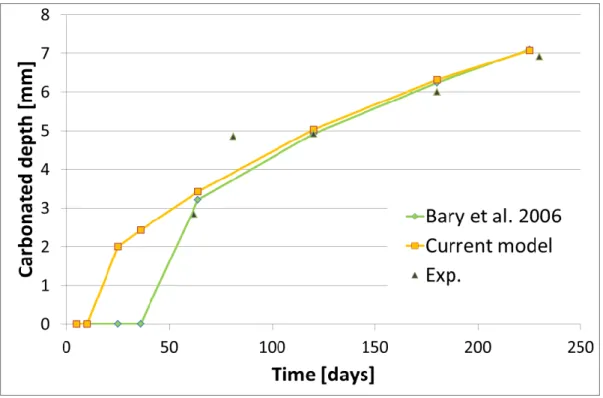
phenolphthalein test is simply estimated from the portlandite profile. In [39], the carbonation depths obtained by phenolphthalein in the case of accelerated tests are found to be located in the degraded zone at concentrations of portlandite corresponding to about 10% of its initial quantity. Following this simple method (which has already been applied in [32]), the accuracy of the model is tested by a comparison with both numerical and experimental results for the accelerated carbonation test as presented in [32]. This comparison is illustrated on Figure 5, and again a good agreement is obtained between the two models and the experimentsErreur !
Source du renvoi introuvable.. The differences observed for the first terms shall be
explained by the differences in portlandite profiles close to the exposed face: the influence of
Sr on the carbonation process is not taken into account in the same way. Indeed, in [32] the
function 𝑘𝑠𝑙(𝑆𝑟) presented in equation (12) is replaced directly by Sr. Despite these differences, the comparison remains very satisfactory.
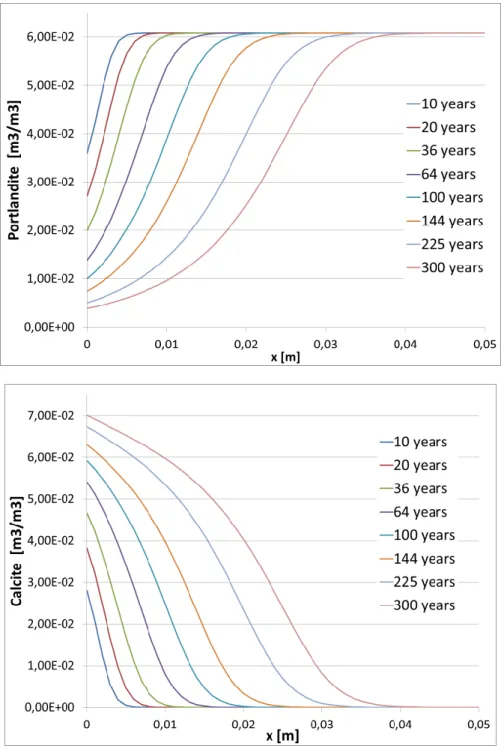
To illustrate the capacities of the model, the Figure 6Erreur ! Source du renvoi
introuvable. presents the results of a numerical simulation of atmospheric carbonation for the
same material in terms of portlandite and calcite volume fraction profiles at different times. The only difference with the case of Figure 4 is the pressure of CO2 on the exposed face which is set to 𝑃𝐶𝑂2= 35 Pa here, i.e. conform to the average partial pressure in the atmosphere. We observe that the profiles do not exhibit a steep front, and are smoother than in the case of accelerated carbonation, in agreement with both numerical [31] and experimental [40,41] results. Accordingly, the carbonation depth is more complex to define in this case with the approximate method described above since small variations of the threshold value of portlandite may impact the depth by the order of one centimetre. Therefore, in the following section, rather than presenting the carbonation results in terms of carbonation depths based on phenolphthalein test (i.e., defined on pH), we have decided to analyze the simulations in terms of arbitrary chosen threshold values of several degradation indicators, namely calcite formation, portlandite dissolution and porosity clogging. These indicators will permit to simply characterize the effects of aggregate shapes and to ease comparison between the different mesostructures defined in the former section.
To conclude, the present model turns out to provide results in terms of calcite and portlandite concentration profiles very close to the ones obtained with a previous and more complex version of the model. Further, the phenolphthalein carbonation depths calculated in the case of an accelerated test appear in very good agreement with both experimental and numerical results. We then consider that the model is relevant and suitable for numerical simulations on the large meshes considered in this study (up to 500,000 elements).
13
4. RESULTS AND DISCUSSION
We present and analyze in this section the numerical results obtained on the different mesostructures described in section 2. The drying simulations have been performed with an initially saturated material exposed to a saturation degree equal to 65% on the exposed face. The issue of drying is equivalent to a simple diffusive problem: no source term appears in equation (1) in this case, and the porosity of the material and the transport properties do not evolve during the simulation due to microstructure changes. On the contrary, the carbonation issue is more complex, as a consequence of the coupling between the reactive transport of water and of carbon dioxide through the source terms of equations (1) and (2). The simulations have been achieved with conditions of atmospheric carbonation, i.e. pressure of carbon dioxide equal to 35 Pa, and saturation degree equal to 65% on the external face. Note that as already mentioned, only the matrix phase is considered in the simulations. This matrix phase is assimilated here as mortar. Consequently, the model parameters defined in the previous section for concrete are modified as follows. The porosity is set to 𝜙0=13% (i.e. calculated by substituting the volume fraction of the aggregates); the intrinsic permeability K0 is assumed to be increased to 5×10-22 m2; the effect of the higher 𝜙
0 on the diffusion coefficient of CO2 is supposed to be accounted for through 𝑓(𝜙, 𝑆𝑟) in equation (6). The other parameters are kept unchanged, with the exception of the hydrates volume fractions which are corrected to account for the absence of aggregate phase.
We first present the results obtained on the mesostructures without steel rebar. To ease comparison and as specified above, we focus on averaged depths where the outputs of interest for the respective problems of drying and carbonation reach some given value. For the drying simulations, we choose to analyze the depths at which the averaged saturation degree reaches 80%, while for carbonation we investigate the depths where the calcite formation, portlandite dissolution and porosity decrease reach the averaged values of 0.01 m3 per m3 of porous material, 80% of the initial quantity and 10% of the initial value, respectively.
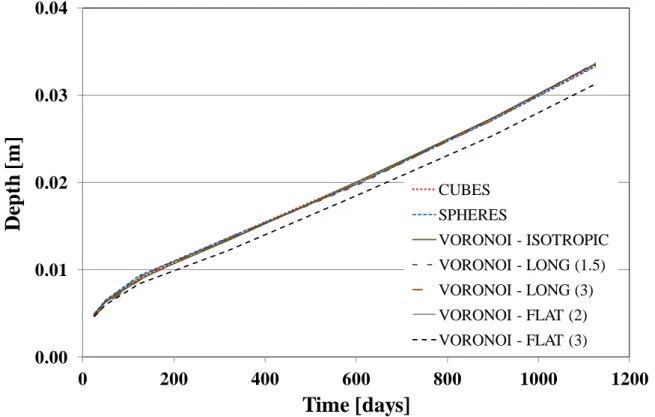
One can observe on Figure 7 and Figure 9 the mean values for the saturation degree and calcite precipitation depths, respectively. In both cases, these mean values are very close whatever the aggregate shapes, except for the oblate (flat) Voronoi aggregates with a shape factor of 3 (i.e. very anisotropic shapes). For this latter case, the mean values are slightly inferior to the values obtained for the other shapes.
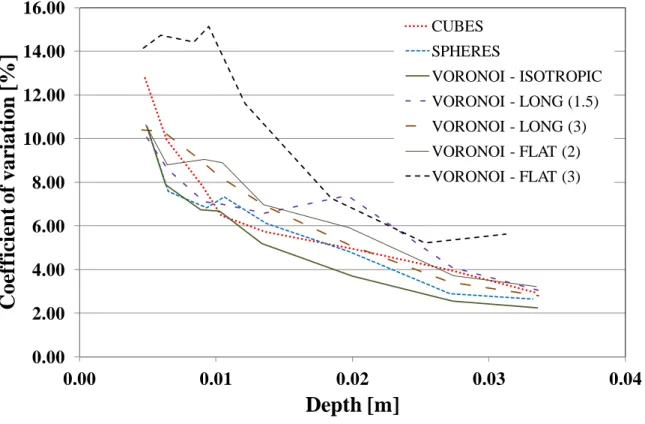
The second observation derives from Figure 8 and Figure 10, showing the coefficient of variation of the drying and carbonation depths corresponding to Figure 7 and Figure 9. The
14
coefficient of variation shall be considered as an indicator of the shape of isovalue planes in the material. A low coefficient of variation would indicate a drying/carbonation front relatively homogeneous on surfaces parallel to the exposed face and, thus, not particularly disturbed by the aggregates. On the contrary, a high coefficient of variation would point out disturbances in the transfer process due to the considered inclusions. It appears that the coefficient of variation remains very close for all isotropic shapes, and even for those that are moderately ‘anisotropic’ (i.e. cubes and Voronoi particles with shape factor less than 2). It reaches an extreme value in the region near the maximal volume fraction of coarse aggregates (see Figure 3). This phenomenon might be explained by the fact that in the first millimetres, there is essentially mortar and few aggregates. The material becomes then progressively more and more ‘heterogeneous’ as a function of the depth. Therefore, it is expected that the aggregates impact strongly the results in the transition region between the exposed surface and the microstructure core, where their volume fraction is approximately constant. We also anticipate that the more ‘anisotropic’ the aggregate shape, the more disturbed the geometry, and thus, the transport processes. We indeed observe that the coefficient of variation for the drying/carbonation depths reaches its maximal value in the same zone as the volume fraction of aggregates, and that it is more important for very anisotropic aggregate shapes. It is worth mentioning that for such anisotropic shapes, the particles seem to exhibit a preferential orientation, i.e. globally more ‘parallel’ to the exposed surface, as may be seen on Figure 1 down right in the case of flat aggregates. The corresponding spatial arrangement in the region close to the external face is then probably different from that deeper in the material. This point would deserve further investigations, but is beyond the scope of the present study. For further drying/carbonation depths, the coefficient of variation decreases towards a relatively low value that we infer to be asymptotic, meaning that the dispersion is small.
Let us specify that the conclusions are very similar whatever the indicator chosen for the carbonation depth: decrease of the porosity (see the mean value on Figure 11 and corresponding coefficient of variation on Figure 12) or dissolved portlandite (see the mean value on Figure 13 and the corresponding coefficient of variation on Figure 14).
To evaluate the influence of the mesh fineness on the results, additional simulations have been performed on a larger mesh in the case of isotropic Voronoi aggregates. The number of elements in the matrix for this finer mesh is about 700,000, compared to approximately 330,000 in the initial mesh. The results for the drying simulation can be observed on Figure 15 for both meshes. It is noteworthy that only negligible differences appear on the mean value of the drying depth as well as on the coefficient of variation. The same comparison appears on
15
Figure 16 for the carbonation simulation and for the indicators defined previously: calcite volume fraction equal to 0.01 mol/L (a), porosity decreased by 10% (c) and initial portlandite volume fraction decreased by 80% (e). Then, concerning the mean value of the carbonation depths or their coefficient of variation (Figure 16 (b), (d) and (f), respectively), the conclusions are again that negligible influences of the mesh size are observable. We consider therefore that the fineness of the initial meshes specified in Table 2 is sufficient to provide accurate numerical results.
As mentioned in section 2, further investigations have been conducted to evaluate the reproducibility of the results in the case of flat Voronoi inclusions with aspect ratio of 3. This case is chosen as its results exhibit some discrepancies with the other configurations. Two more microstructures have then been generated (only the spatial arrangement of the aggregates is different), and the corresponding results are compared with those obtained on the initial geometry. Figure 17 and Figure 18 present the results in terms of drying and carbonation simulations, respectively. From these figures, it appears that whatever the observed indicators (Sr=80% for the drying process, calcite formation, portlandite dissolution and porosity decrease for the carbonation process), the results are very close for all three microstructures (denoted as RVE1 for the initial geometry, and RVE2 and RVE3 for the two complementary ones). The discrepancies with the other configurations involving different aggregate shapes appear even slightly more marked with the new samples. These results then confirm that the microstructures generated numerically lead to reproducible simulations even with very ‘anisotropic’ inclusions when considering the averaged kinetic indicators as previously defined. It is then shown that flat aggregates affect moderately these indicators.
The next step of this study is to investigate the effects of the inclusions shape on the saturation degree and carbonation kinetics close to the steel rebar embedded in the mesostructures. As already explained, a subsequent work will focus on the corrosion process at the steel/mortar interface, and the kinetics of the growing corrosion products formation shall depend on both state variables and their respective gradients at the rebar surface (saturation degree, O2 pressure, local depassivation due to carbonation, all phenomenon being ruled by reactive diffusion processes). The simulations and corresponding initial and boundary conditions are the same as those presented for the mesostructures without steel rebar.
On Figure 19 the averaged saturation degree at 1100 days for the drying simulation is plotted for three planes parallel to the exposed face, for all kind of inclusions shapes
16
considered in this study. The three planes presented here are the plane just before and tangent to the steel rebar (so at 2 cm from the exposed face), the plane just behind and also tangent to the rebar (then 3.2 cm from the exposed face), and the plane passing by the axis of the steel rebar (at 2.6 cm from the exposed face). These 3 planes are denoted as external, internal and meddle, respectively. The x-axis of Figure 19 corresponds to distances measured along a vertical axis from the upper surface of the mesostructures to the lower one (see Figure 2). To facilitate the interpretation of the curves, the position of the rebar is also indicated. It is important to notice that the averaging procedure of this graph and the following ones is different from the preceding results: the quantities are indeed averaged over lines parallel to the rebar axis, whereas they were averaged on surfaces in the preceding Figures. Local effects are then expected to be more marked in the present case. Overall, we note that the averaged saturation degree 𝑆𝑟 is approximately 0.76, 0.78 and 0.80 for the 3 planes, respectively, the lowest value being the closest from the exposed face. A second visible effect is that a disturbance due the rebar is observed in both external and internal planes. Regarding the external plane, the excess of drying near the rebar is probably due partly to a locally higher volume fraction of mortar because of the minimal distance condition between the inclusions, and also to a lower aggregate concentration consecutive to the placement algorithm between the rebar and the exposed face. For the internal plane, the lower saturation degree close to the rebar is mainly a consequence of the rebar itself, which clearly appears as an obstacle for the water transport. For both cases, the perturbations are however relatively limited, in the range of 0.01-0.015 in saturation degree. Concerning the local effects linked to the averaging procedure, we remark indeed small variations of saturation degree of the order of 0.01 along the x-axis for each mesostructure. No significant difference in the kinetics of drying may be observed between the different cases of aggregate shapes, except for the flat and to a lesser extent the elongated ones with shape factor of 3, which exhibit more important variations of 𝑆𝑟 (up to 0.02) with respect to the other cases and also along the x-axis. The conclusions from the Figure 19 are that close to the rebar, some moderate perturbations in the kinetics of the drying process appear due to the presence of this rebar. The influence of the inclusion shapes is low, except for the highly oblate aggregates for which non-negligible variations of 𝑆𝑟 are visible. Then, if precise values of saturation degree are needed in the mesostructure, the aggregate shape should be considered whenever its shape factor significantly deviates from 1, and in particular in case of oblate shape. Further, it is worth noting that the discrepancies observed in Figure 19 between the various configurations are more marked than in the previous graphs showing mean depths as a function of time. This is probably due to the averaging procedure performed over lines in the present case instead of surfaces as in the
17
previous figures. The local variations of saturation degree are better captured in the former case since the averaging volume is much smaller.
Figure 20 and Figure 21 show the results on the same 3 planes for the carbonation simulations at 800 years corresponding to the calcite volume fraction (the highest values correspond to the external plane) and the portlandite volume fraction (the lowest values correspond to the external plane), respectively. Generally, the conclusions are nearly the same as previously: few effects of the inclusions shape are observed, except for the highly oblate aggregates. Moreover, it is interesting to notice that the perturbations on the external plane due to the rebar, i.e. between the rebar and the exposed face, are almost negligible, whereas they are much more important behind the rebar on the internal plane. This remark applies for both calcite and portlandite volume fraction. This indicates that the carbonation front ought to be inhomogeneous on the steel surface, which may affect the onset of corrosion process and subsequent cracking.
As a more general remark, we observe that at long term the effects of the drying kinetics on carbonation are negligible. Indeed, saturation degree is nearly constant after several tens of years in the mesostructure (and then in the vicinity of the rebar). This is due to the fact that transfer kinetics is much faster than water release resulting from carbonation reactions. It is in total agreement with simpler models where the only considered mechanism is calcite formation, the moisture transfer being ignored (see e.g. [42]). This remark would obviously be irrelevant in the case of variable conditions of external relative humidity, for which a precise calculation of saturation degree and a more realistic description of sorption-desorption curves would be required.
Let us finish this study by considering the coefficient of variation for the various quantities of interest at the steel/mortar interface. Recall that the higher the coefficient of variation, the more important the effects of the inclusions on these quantities at the rebar surface. For the drying process, this coefficient of variation is about 0.29% on 𝑆𝑟 for the so-called isotropic shapes (cubic, spherical, Voronoi particles), whereas it is close to 0.35% for prolate and oblate shapes with a shape factor of 2, and it reaches 0.58% for the highly oblate shape. Clearly enough, these values are very small, meaning that the variability is very low. Concerning the carbonation process, for the isotropic shapes the coefficient of variation is close to 2.2% and 7% for the calcite and the portlandite volume fractions, respectively; it reaches 2.7% and 8% for the lowly anisotropic shapes and 4.9% and 13% for the highly anisotropic ones. In the carbonation simulations, the values are then much higher, indicating a marked variability in particular in the case of the portlandite volume fraction. Again, this may have noticeable consequences regarding the corrosion processes.
18
The main conclusion of this study would be that the kinetics of the transport processes we considered, as well as their local variability, depend essentially on the volume fraction of aggregates and would hardly depend on the aggregates shapes, provided the considered shapes remain ‘rather’ isotropic. For largely anisotropic aggregate shapes (but with a still isotropic spatial distribution and orientation of the inclusions), the transfer processes appear to be moderately reduced, and the local spatial variability more important. These conclusions should however be considered with caution, as the ITZ have not been taken into account in the modelling approach and only the coarse aggregates have been investigated.
Therefore, it appears that for a macroscopic modelling approach involving transport processes (such as drying or carbonation), the influence of the aggregate shapes could be neglected, and the aggregates could be chosen of the shapes that seem more convenient for the numerical simulations. Specifically, it is in general much easier to build the geometry with spherical inclusions, while the generated meshes are smaller with cubic or polyhedral inclusions, etc. However, when a more precise knowledge of state variables is required in particular locations (for example at the steel/mortar interface), aggregate shapes with aspect ratio far from 1 should be explicitly considered in the model as they affect non-negligibly the results. Let us keep in mind also that only transport processes have been taken into consideration, and the conclusions we drew from this study cannot be directly extended to mechanical behaviour.
5. CONCLUSIONS
This study investigates the effects of the shape of coarse aggregates on the macroscopic drying and carbonation phenomena in concrete by means of 3D FE simulations. It is the first stage of a project aiming at characterizing the corrosion processes due to carbonation and corresponding initiation of cracking at the mesoscale of concrete. Two types of numerical mesostructures are generated, with and without steel rebar. The latter configuration involves 470 granular particles randomly placed and oriented, whereas the former involves 404 aggregates to conserve the same volume fraction in the concrete phase. The ITZ is ignored in this study. Different aggregate shapes are considered: ‘isotropic’ ones (spherical, cubic, Voronoi particles) and ‘anisotropic’ ones (prolate and oblate Voronoi particles with various scale coefficients).
The numerical results obtained with the different mesostructures without rebar are compared in terms of time evolution of the mean depth at which the saturation degree reaches 80% for the drying problem. For carbonation, the comparison is made for mean depths where
19
the calcite formation, portlandite dissolution and porosity decrease reach the averaged values of 0.01 m3 per m3 of porous material, 80% of the initial quantity and 10% of the initial value, respectively. It is shown that all configurations provide very similar results, except for the case with oblate (flat) Voronoi aggregates obtained with a scale transform coefficient of 3. In this case the depths are slightly lower, indicating globally smaller transport properties, and the coefficients of variation are higher in the region near the face exposed to the environment. These discrepancies may be explained by slightly different spatial arrangements and orientations of the aggregates in this zone.
The mesostructures with rebar exhibit moderate perturbations of the quantities of interest near the rebar. Between the rebar and the exposed surface, both drying and carbonation slightly accelerate, while they slow down significantly behind the rebar. This indicates that carbonation is non homogeneous on the steel rebar surface, but the consequences are difficult to quantify with regards to corrosion risks. Concerning the effects of the aggregate shape, the conclusions are the same as for the mesostructures without rebar: no important influence of the shape is noted, except for the oblate aggregates with aspect ratio of 3, for which a non negligible delayed effect is observed.
To sum up, for the drying and carbonation phenomena considered in this study, the influence of the coarse aggregate shapes appears negligible (low for flat shapes) compared to their volume fractions, when only macroscopic indicators are regarded. However, if more precise values are needed locally to analyze at a finer scale some degradation processes, then the aggregate shape should be considered whenever its aspect ratio is more than about 2, as it may affect noticeably the results. Finally, as mentioned above, the coupling of the model with mechanics is currently being processed, so as to be applied to the case of corrosion initiation induced by carbonation, with the aim of capturing the onset of cracking.
REFERENCES
[1] G. Lilliu, J.G.. van Mier, 3D lattice type fracture model for concrete, Engineering Fracture Mechanics. 70 (2003) 927-941.
[2] H.-K. Man, J.G.M. van Mier, Influence of particle density on 3D size effects in the fracture of (numerical) concrete, Mech. Mater. 40 (2008) 470-486.
[3] P. Grassl, H.S. Wong, N.R. Buenfeld, Influence of aggregate size and volume fraction on shrinkage induced micro-cracking of concrete and mortar, Cement and Concrete Research. 40 (2010) 85-93.
[4] E. Gal, R. Kryvoruk, Meso-scale analysis of FRC using a two-step homogenization approach, Computers & Structures. 89 (2011) 921-929.
[5] A. Idiart, J. Bisschop, A. Caballero, P. Lura, A numerical and experimental study of aggregate-induced shrinkage cracking in cementitious composites, Cement and Concrete Research. 42 (2012) 272-281. [6] J.-J. Zheng, X.-Z. Zhou, Y.-F. Wu, X.-Y. Jin, A numerical method for the chloride diffusivity in concrete
with aggregate shape effect, Construction and Building Materials. 31 (2012) 151-156.
[7] G. Ye, K. van Breugel, A.L.A. Fraaij, Three-dimensional microstructure analysis of numerically simulated cementitious materials, Cement and Concrete Research. 33 (2003) 215-222.
[8] V. Smilauer, Z. Bittnar, Microstructure-based micromechanical prediction of elastic properties in hydrating cement paste, Cement and Concrete Research. 36 (2006) 1708–1718.
20
[9] C.J. Haecker, E. Garboczi, J. Bullard, R. Bohn, Z. Sun, S. Shah, et al., Modeling the linear elastic properties of Portland cement paste, Cement and Concrete Research. 35 (2005) 1948–1960.
[10] L. Stefan, F. Benboudjema, J.M. Torrenti, B. Bissonnette, Prediction of elastic properties of cement pastes at early ages, Computational Materials Science. 47 (2010) 775–784.
[11] P. Wriggers, S.O. Moftah, Mesoscale models for concrete: Homogenisation and damage behaviour, Finite Elements in Analysis and Design. 42 (2006) 623–636.
[12] M. Hain, P. Wriggers, Numerical homogenization of hardened cement paste, Comput Mech. 42 (2008) 197-212.
[13] F. Bernard, S. Kamali-Bernard, W. Prince, 3D multi-scale modelling of mechanical behaviour of sound and leached mortar, Cement and Concrete Research. 38 (2008) 449–458.
[14] B. Bary, M. Ben Haha, E. Adam, P. Montarnal, Numerical and analytical effective elastic properties of degraded cement pastes, Cement and Concrete Research. 39 (2009) 902-912.
[15] F. Bernard, S. Kamali-Bernard, Performance simulation and quantitative analysis of cement-based materials subjected to leaching, Computational Materials Science. (2010).
[16] V. Smilauer, Z.P. Bazant, Identification of viscoelastic C-S-H behavior in mature cement paste by FFT-based homogenization method, Cement and Concrete Research. 40 (2010) 197-207.
[17] J. Escoda, F. Willot, D. Jeulin, J. Sanahuja, C. Toulemonde, Estimation of local stresses and elastic properties of a mortar sample by FFT computation of fields on a 3D image, Cem. Concr. Res. 41 (2011) 542-556.
[18] M. Zhang, Y. He, G. Ye, D.A. Lange, K. van Breugel, Computational investigation on mass diffusivity in Portland cement paste based on X-ray computed microtomography (μCT) image, Construction and Building Materials. 27 (2012) 472-481.
[19] A. Caballero, C.M. López, I. Carol, 3D meso-structural analysis of concrete specimens under uniaxial tension, Computer Methods in Applied Mechanics and Engineering. 195 (2006) 7182-7195.
[20] L.S. Hu, S.F. Chen, 3-D numerical modelling of mesoscopic configuration and cracking of concrete, Advanced Materials Research. 194 (2011) 972–976.
[21] T. Kanit, S. Forest, I. Galliet, V. Mounoury, D. Jeulin, Determination of the size of the representative volume element for random composites: statistical and numerical approach, Int. J. Solids Struct. 40 (2003) 3647-3679.
[22] I. Comby-Peyrot, F. Bernard, P.O. Bouchard, F. Bay, E. Garcia-Diaz, Development and validation of a 3D computational tool to describe concrete behaviour at mesoscale. Application to the alkali-silica reaction, Computational Materials Science. 46 (2009) 1163–1177.
[23] A.B. Tran, J. Yvonnet, Q.-C. He, C. Toulemonde, J. Sanahuja, A simple computational homogenization method for structures made of linear heterogeneous viscoelastic materials, Computer Methods in Applied Mechanics and Engineering. 200 (2011) 2956-2970.
[24] E.J. Garboczi, D.P. Bentz, The effect of statistical fluctuation, finite size error, and digital resolution on the phase percolation and transport properties of the NIST cement hydration model, Cement and Concrete Research. 31 (2001) 1501-1514.
[25] A.B. Tran, J. Yvonnet, Q.-C. He, C. Toulemonde, J. Sanahuja, A multiple level set approach to prevent numerical artefacts in complex microstructures with nearby inclusions within XFEM, International Journal for Numerical Methods in Engineering. 85 (2011) 1436-1459.
[26] Cast3M, www-cast3m.cea.fr, . [27] Salome, www.salome-platform.org, . [28] Qhull, www.qhull.org, .
[29] C.B. Barber, D.P. Dobkin, H. Huhdanpaa, The quickhull algorithm for convex hulls, ACM Trans. Math. Softw. 22 (1996) 469–483.
[30] Distene, www.distene.com, .
[31] B. Bary, A. Sellier, Coupled moisture–carbon dioxide-calcium transfer model for carbonation of concrete, Cement and Concrete Research. 34 (2004) 1859–1872.
[32] B. Bary, C. Mügler, Simplified modelling and numerical simulations of concrete carbonation in unsaturated conditions, Revue européenne de génie civil. 10 (2006) 1049–1072.
[33] M. Mainguy, O. Coussy, V. Baroghel-Bouny, Role of air pressure in drying of weakly permeable materials, J. Eng. Mech.-ASCE. 127 (2001) 582-592.
[34] M.T. van Genuchten, A closed-form equation for predicting the hydraulic conductivity of unsaturated soils, Soil Sci. Soc. Am. J. 44 (1980) 892–898.
[35] R.J. Millington, Gas Diffusion in Porous Media, Science. 130 (1959) 100 -102.
[36] M. Thiery, Modélisation de la carbonatation atmosphérique des matériaux cimentaires. Prise en compte des effets cinétiques et des modifications microstructurales et hydriques, Thèse de doctorat, LCPC, 2005. [37] M. Thiery, G. Villain, P. Dangla, G. Platret, Investigation of the carbonation front shape on cementitious
materials: effects of the chemical kinetics, Cement and Concrete Research. 37 (2007) 1047–1058.
[38] Z.P. Bažant, L.J. Najjar, Nonlinear water diffusion in nonsaturated concrete, Matériaux et Constructions. 5 (1972) 3-20.
21
[39] C.F. Chang, J.W. Chen, The experimental investigation of concrete carbonation depth, Cement and Concrete Research. 36 (2006) 1760–1767.
[40] L.J. Parrott, D.C. Killoh, Carbonation in a 36 year old, in-situ concrete, Cement and Concrete Research. 19 (1989) 649–656.
[41] Y.F. Houst, F.H. Wittmann, Depth profiles of carbonates formed during natural carbonation, Cement and Concrete Research. 32 (2002) 1923-1930.
[42] V.G. Papadakis, C.G. Vayenas, M.N. Fardis, Fundamental modeling and experimental investigation of concrete carbonation, ACI Materials Journal. 88 (1991).
22
Tables
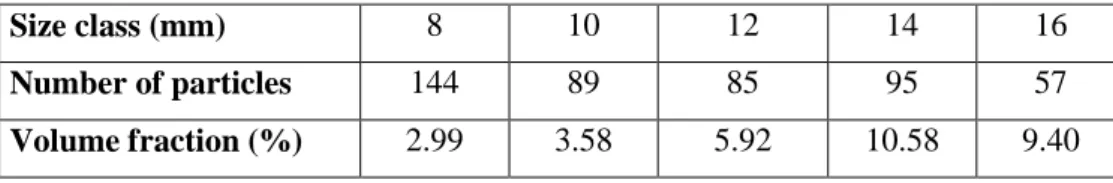
Table 1: Discretized sieve curve for spherical aggregates
Size class (mm) 8 10 12 14 16
Number of particles 144 89 85 95 57
23
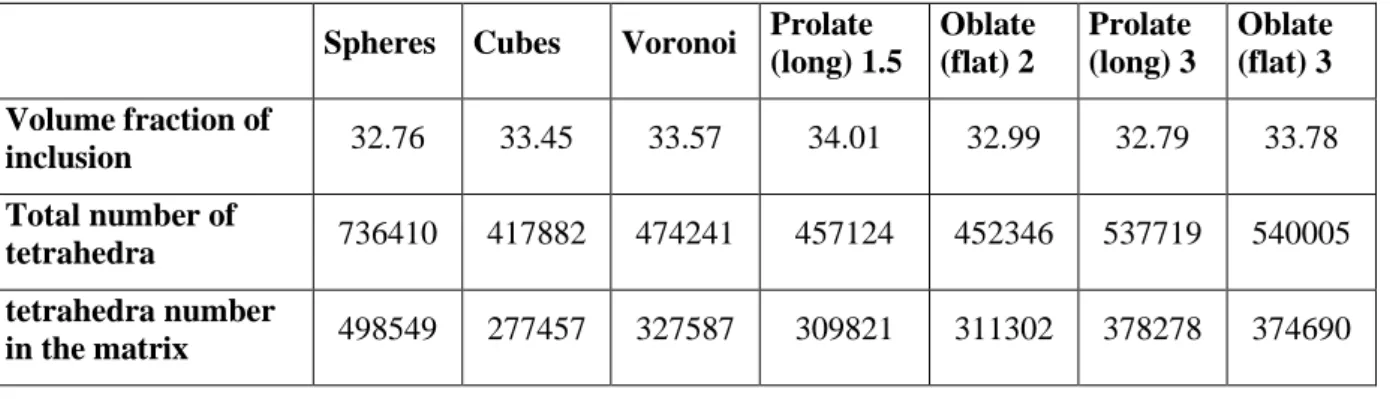
Table 2: Characteristics of the different 3D microstructures and their corresponding meshes (the scale transform coefficient is indicated for prolate and oblate Voronoi particles)
Spheres Cubes Voronoi Prolate (long) 1.5 Oblate (flat) 2 Prolate (long) 3 Oblate (flat) 3 Volume fraction of inclusion 32.76 33.45 33.57 34.01 32.99 32.79 33.78 Total number of tetrahedra 736410 417882 474241 457124 452346 537719 540005 tetrahedra number in the matrix 498549 277457 327587 309821 311302 378278 374690
24 Figures
Figure 1: Microstructures generated with spheres (up left), cubes (up right), Voronoi particles (down left) and prolate Voronoi particles with aspect ratio of 3 (down right).
25
Figure 2: Microstructures generated with spheres (left) and Voronoi particles (right) and incorporating a steel rebar.
26
Figure 3: Variation of the volume fraction of aggregates as a function of depth for the different microstructures without (up) and with (down) steel rebar.
0.00 0.10 0.20 0.30 0.40 0.50 0 0.02 0.04 0.06 0.08 V ol u m e fr ac ti on [ -] Depth [m] CUBES SPHERES
VORONOI - ISOTROPIC VORONOI - LONG (1.5) VORONOI - FLAT (2) VORONOI - FLAT (3) VORONOI - LONG (3) 0.00 0.10 0.20 0.30 0.40 0.50 0 0.02 0.04 0.06 0.08 V ol u m e fr ac ti on [ -] Depth [m] CUBES SPHERES
VORONOI - ISOTROPIC VORONOI - LONG (1.5) VORONOI - FLAT (2) VORONOI - FLAT (3) VORONOI - LONG (3)
steel rebar
27
28
Figure 5: Comparison between numerical simulations results and experimental results from Bary et al. 2006 [32].
29
30
Figure 7: Mean value for the drying depth at Sr = 80%.
0.00 0.01 0.02 0.03 0.04 0 200 400 600 800 1000 1200
De
p
th
[
m
]
Time [days]
CUBES SPHERES VORONOI - ISOTROPIC VORONOI - LONG (1.5) VORONOI - LONG (3) VORONOI - FLAT (2) VORONOI - FLAT (3)31
Figure 8: Evolution of the coefficient of variation for the drying depth at Sr = 80%.
0.00 2.00 4.00 6.00 8.00 10.00 12.00 14.00 16.00 0.00 0.01 0.02 0.03 0.04
Co
ef
fic
ie
n
t
of
var
iat
ion
[
%
]
Depth [m]
CUBES SPHERES VORONOI - ISOTROPIC VORONOI - LONG (1.5) VORONOI - LONG (3) VORONOI - FLAT (2) VORONOI - FLAT (3)32
Figure 9: Mean value for the carbonation depth (corresponding to a calcite concentration equal to 0.01).
0.00 0.01 0.02 0.03 0.04 0.05 0.06 0 100 200 300 400 500 600 700 800
De
p
th
[
m
]
Time [years]
CUBES SPHERES VORONOI - ISOTROPIC VORONOI - LONG (1.5) VORONOI - LONG (3) VORONOI - FLAT (2) VORONOI - FLAT (3)33
Figure 10: Evolution of the coefficient of variation for the carbonation depth (corresponding to a calcite concentration of 0.01). 0.00 1.00 2.00 3.00 4.00 5.00 6.00 7.00 8.00 9.00 0.00 0.01 0.02 0.03 0.04 0.05 0.06
Co
ef
fic
ie
n
t
of
var
iat
ion
[
%
]
Depth [m]
CUBES SPHERES VORONOI - ISOTROPIC VORONOI - LONG (1.5) VORONOI - LONG (3) VORONOI - FLAT (2) VORONOI - FLAT (3)34
Figure 11: Mean value for the carbonation depth (corresponding to porosity decreased by 10%).
0.00 0.01 0.02 0.03 0.04 0 100 200 300 400 500 600 700 800