Review of Molikpaq Geotechnical Material
March 2009
Prepared for:
National Research Council Canada Canadian Hydraulic Centre
National Research Council Canada 1200 Montreal Road M-32
Ottawa, ON K1A 0R6
Prepared by:
K.Tim Law, Ph.D., P.Eng, FHKIE, FEIC, FCAE Carleton University
Department of Civil and Environmental Engineering 1125 Colonel By Drive
Ottawa
1 INTRODUCTION
The Molikpaq is a large steel caisson to provide a year round drilling platform for exploration in Beaufort Sea. It is designed for use in water depth of 15m to 50m and to resist ice forces during the majority of the year. The core of the caisson was filled with sand to provide the major component for resisting the ice loading. Core filling was carried out hydraulically through a pipeline discharging the fill at about the sea level. There was no densification of the core sand after deposition.
About 7-1/2 months after the completion of core filling, an ice event occurred on April 12, 1986. Some notable settlements occurred over about 1/3 of the core area with a maximum value of 1.5m at the fill surface. Since then a lot of studies have been conducted to examine the performance of the caisson during that ice event and the behaviour of the core sand.
At the request of Dr. R. Frederking, Canadian Hydraulics Centre, National Research Council of Canada, Dr. Law of Carleton University to conduct a review of the Molikpaq geotechnical material as described in the 2008 report by Kevin Hewitt “Estimates of Ice Loads on the Molikpaq Based on Geotechnical Analysis”, along with other related documents.
2. SUMMARY OF THE 2008 HEWITT REPORT: “ESTIMATES OF ICE LOADS ON THE MOLIKPAQ BASED ON GEOTECHNICAL ANALYSIS”
The report first examines the evidence related to the performance of the core sand. The evidence included the placement method for the core sand, cone penetrometer profiles, pressuremeter test results and observed settlements during the ice event. Conclusions are drawn that the core sand was at a very loose to loose state and was potentially liquefiable. The second part of the report deals with analytical models for analyzing the caisson performance during the ice event. The author noted that two out of the three models assume a dense core sand and would have over predicted the ice load magnitude. The third assumes a loose core sand and analyses two conditions, one under drained state and the other liquefied state. Based on the author’s estimate, the maximum ice load during the ice event was less than 200MN, much lower than the estimated value based on load measuring devices.
3. CORE SAND BEHAVIOUR
The in situ behaviour of the core sand is an important issue in the design of the Molikpaq. There is an interdependence between the performance of the core sand and the magnitude of the ice load that can develop. The stability of the core sand is controlled jointly by its in situ density and the ice load, and the magnitude of the ice load is affected by the stability of the core sand.
As early as 1935, Casagrande (Cassagrande 1976) already recognized that when loose sand is sheared, it decreases in volume (or contracts) to reach a steady state volume (or density). On the other hand, the same sand sheared in a dense state will increase in volume (or dilate) to reach the same steady state condition as that of the loose sand. He called this steady state the critical state which is dependent on the effective confining stress. The steady state can be represented by a critical state line as shown in Figure 1 in which the critical void ratio is plotted against the mean effective confining stress, p’. Further work shows that soils represented by void ratios (e) located below or to the left of the critical state line on a e-p’ plot will dilate upon shear and are safe against liquefaction. Conversely, soils represented by void ratios located above or to the right of the critical state line will contract upon shear and may lead to unstable condition or liquefaction. How safe or unstable the soil is depends on the distance of the void ratio and effective stress from the critical state line. Been and Jefferies (1985) aptly define the term ‘state parameter’, ψ, to describe this distance. As shown in Figure 1, ψ is defined as the difference between the void ratio of the soil as it exists and the void ratio at the critical state at the same mean effective stress. If ψ is negative, the soil is dilative and if ψ is positive, the soil is contractive.
While there are standard laboratory procedures to determine the critical state line and void ratio, there are uncertainties to accurately determine the in situ void ratio of granular soils. Hence application of the above principles is faced with some difficulties. Indirect methods of determining the in situ void ratio have to be made, commonly involving in situ testing such as the standard penetration test (SPT), the cone penetration test (CPT) and the pressuremeter test. One of the most common methods now is to measure the in situ void ratio by correlation with the CPT tip resistance, qc, and the mean effective
confiningstress, p’. This is in general what has been done by Hewitt (2008) and Jefferies et al. (1985) in assessing the core sand behaviour of the Molikpaq. However, the two investigators arrive at opposite conclusions on the nature of the core sand. In order to understand why the discrepancy exists, a brief discussion of their methods is given in the following.
There are ample evidences in the literature that for a given sand there is a reasonably unique relationship between void ratio, e, mean effective stress, p’, and CPT tip resistance, qc (Schmertmann 1977, Villet and Mitchell 1981, Baldi et al. 1986, among
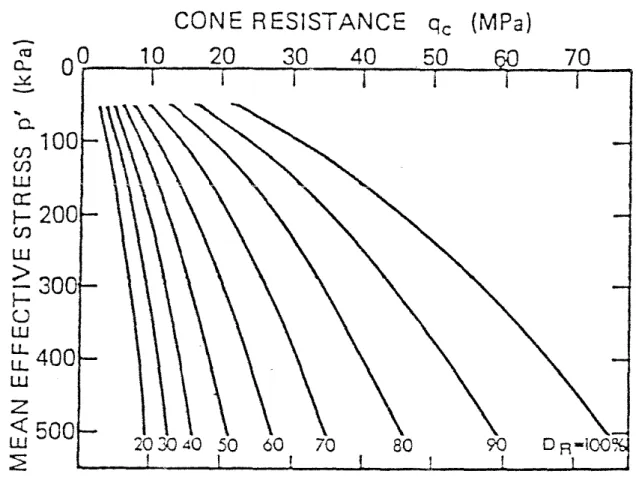
others). The void ratio, e, can be expressed in different forms. Hewitt (2008) expresss it in terms of relative density, Dr, following the work of Baldi et al. (1986) as shown in
Figure 2. This figure shows the relationship between p′, Dr, and qc as determined from
pressure chamber tests in the laboratory. Based on this relationship, and from the cone penetration resistance, qc, measured in the field, Sladen and Hewitt (1989) are able to
determine the Dr (or void ratio) of 4 hydraulic fills in the Canadian Beaufort Sea. As
postulated in this approach that Dr and qc are uniquely related for a given sand at a given
p’, the measured qc profile measured in the field can be replaced by Dr as shown in Figure
(Figure 4). This line of demarcation, however, has not been used in Hewitt’s report (2008). His conclusion of a loose (contractive) core sand in this case, however, is based on the following:
“ • The method of placement with no attempt to densify, • CPT profiles,
• self-bored pressuremeter tests,
• the amount of settlement and the drastic increase in density achieved during subsequent blasting at Amauligak F-24 in 1987 (but still a lesser density than was achieved by bottom dumping!).”
Jefferies and his group of researchers (Jefferies et al. 1985, Been et al. 1986 and Been et al. 1987) use a different approach in determining the in situ void ratio based on CPT test and mean effective confining pressure. Instead of determining the in situ void ratio, they go one step further to determine the state parameter, ψ, as defined above. They propose that for a given sand, the normalized tip resistance is uniquely related to the state parameter. The normalized tip resistance is defined as (qc-p)/p’ where p is the total mean
confining stress. Hence, they suggest: (qc-p)/p’ = k exp (-mψ)
where k and m are constants to be evaluated from pressure chamber tests.
As this approach determines the value of ψ, the liquefaction potential of the soil being investigated can be directly assessed.
.
According to this approach, the Molikpaq core sand is dilative, which is in contrast to the conclusion of Hewitt (2008).
3.1 Reasons for the discrepancy
There are two sets of reasons contributing to the divergent opinions between the two groups of investigators. The first set of reasons are common to both but exerting different influence on the final results, while the second set are unique to each approach. 3.1.1 Reasons common to both approaches
This set of reasons is inherent in using the cone penetrometer conducted in a pressure chamber for assessing the in situ void ratio (relative density or state parameter). As both approaches are based on this indirect method to determine the in situ void ratio, the weakness of this method will be reflected in both approaches as follows:
(1) For most applications, it is not practical to conduct pressure chamber tests on the sand specific to the site. Hence, some existing calibration curves for other sands have to be used to infer the void ratio in the field. As pointed out by Leonard et al. (1991) that the q-p’-e relationship is influenced by the effects of fines content, grain shape,
aging, and grain size distribution, different sands will have different relationships and will yield different void ratios for the same qc and confining pressure. Hewitt’s
approach is based on the pressure chamber test results by Baldi et al. (1986) on Ticino sand which is different from the Molikpaq core sand. It is not clear what sand was tested by Jefferies et al. (1985) in the pressure chamber.
(2) According to Sladen and Hewitt (1989), there is a lack of direct evidence to verify what is determined in the pressure chamber test in the laboratory will truly reflect behaviour in the field even if the sand from the field is used for the laboratory test. At present, it is not certain to what degree these factors will influence the final results in each approach.
3.2 Reasons unique to each approach
3.2.1 Hewitt’s approach
In Hewitt’s approach, three quantities are required to determine if the nature of the core sand is dilative or contractive: CPT tip resistance, qc, mean confining stress, p’, and the
location of the critical state line on a void ratio-confining pressure plot. In assessing the core sand state using the CPT tip resistance, Hewitt (2008) has only two quantities clearly defined, i.e., qc and p’. Therefore he can only infer the relative density (void ratio) based
on the pressure chamber test results on Ticino sand. With the inferred Dr, Hewitt
estimates that the core sand is loose with reference to textbook definition based on the compactness of granular soils expressed in terms of relative density. However, he cannot definitively say that the core sand is contractive or potentially liquefiable. As discussed earlier, relative density and confining pressure together are insufficient to distinguish if a sand is contractive or not. At the same relative density, the same sand under shear may contract or dilate depending on the mean effective pressure confining it and the location of the critical state line.
3.2.2 Jefferies approach
This approach assumes a unique relationship between the normalized CPT tip resistance and the state parameter, ψ. However, Sladen (1989) has demonstrated that such a relationship does not exist for all stresses. Instead, the relationship varies with stress level. Ignoring this stress level dependency may lead to an error in assessing the in situ void ratio of 0.2 or greater, i.e., more than 50% in terms of relative density.
Because of the uncertainties involved in each of these approaches, it is not surprising that they yield different conclusions on the state of the core sand.
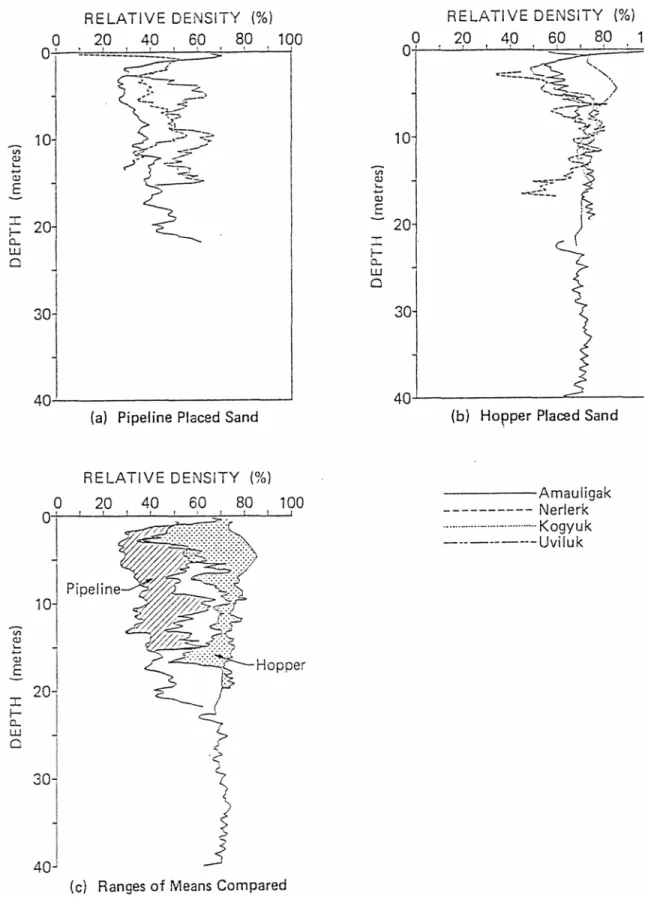
The core fill was placed hydraulically using a pipeline with discharge just below the sea surface. As the fill falls to the bottom, there is a lot of opportunity for it to entrain water between the grains. Consequently, the fill is characterized by low relative density and weak strength. Based on the Beaufort Sea experience on building artificial islands, Sladen and Hewitt (1989) point out that the bottom dumping method, the other common method for forming hydraulic fills, produces a fill about 20-30 percentage points in relative density higher than the pipeline placed material.
It is possible, however, that the pipeline placed fill was in a loose state by textbook definition but it might not necessarily be contractive or liquefiable. Other factors have to be considered before the liquefaction potential of the fill can be assessed.
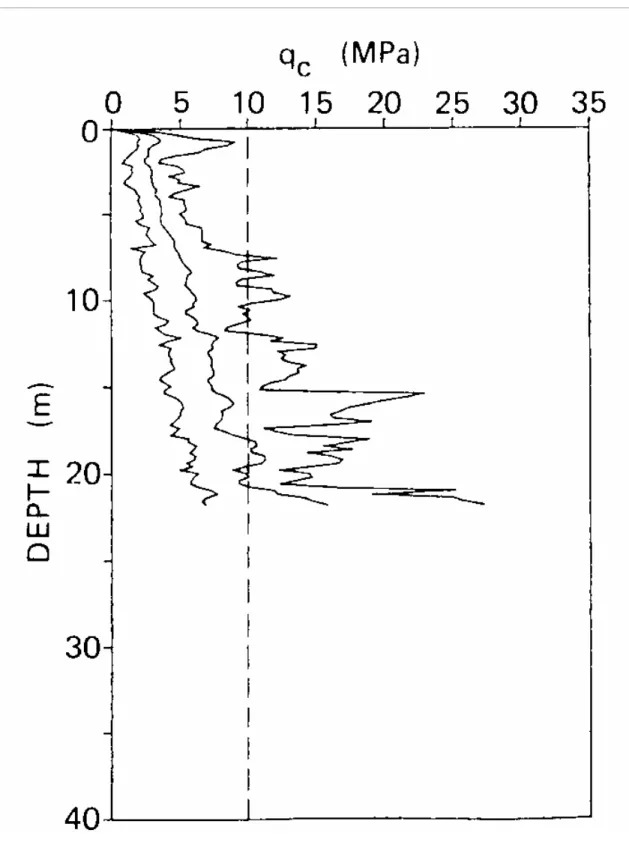
3.3.2 Variability of the core sand
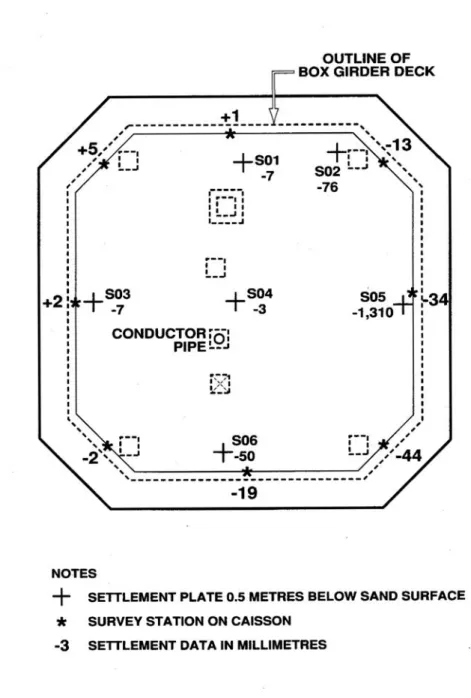
Based on the CPT results given by Sladen and Hewitt (1989), the pipeline placed core sand at Amauligak I-65 is quite variable. At a given depth, the maximum tip resistance is two to five times the minimum value (Figure 5). This is not surprising for a hydraulic fill placed with pipeline discharge under water. With such a large variability, it is likely that the core sand as placed would have strong and weak zones. Even under uniform load intensity, these strong and weak zones will respond differently. During the 1986 April 12 event, the loading intensity varies significantly with location. The east caisson face experienced large accelerations up to 8%g while the other faces experienced only 1-2%g. Soil variability and varying load intensity caused some parts of the core sand to liquefy and other parts to remain intact. This is consistent with the observed variation of surface settlement after the event (Figure 6). The settlement plates at about 0.5m below the sand surface showed a maximum settlement of 1.31m on one side (east side) of the fill but hardly any settlement at the centre, the west and the north sides.
3.3.3 Measured pore pressure
The generation of excess pore water pressure is a complex process resulting from the long cyclic ice loading, permeability of the core sand and its state during loading, and the dewatering system installed in the core. According to Rogers et al. (1991), pore pressure transducer E1, located at around the mid height of the core sand near the east wall, shows a significant pore water pressure rise during the April 12, 1986 ice event to the point that the fill there liquefied. 9.5 m below E1 is another pore pressure transducer near the base of the Molikpag. This transducer shows a steady accumulation of excess pore pressure but not to the point to cause soil liquefaction.
4 ICE LOADS
The magnitude of the ice loads on the Molikpaq is another controversial issue in this project. This stems partly from the special design and performance of the load measuring devices and partly due the complexity of the ice loading interacting with the caisson and the core sand that leads to room for interpretation.
Two primary methods were used to measure the ice loads: 1) Medof panels mounted on the exposed surface of the structure and 2) strain gauges mounted on the steel bulkheads supporting the ice resistant face of the structure. The strain gauges were calibrated during other ice events based on the readings of Medof panels. The description and problems of Medof panels are given by Rogers et al. (1986). Briefly the readings of the panels are time dependent and the polyurethane buttons built into the panels creep upon loading, leading to errors in the results. Furthermore, both systems failed during critical moments in the major ice event on April 12, 1986.
The ice loads are the results of ice/structure interaction caused by multi-year ice. The load has both a normal and a shear component and the load transducers only measured the normal component. In spite of all the difficulties, Rogers et al. (1986), manage to consider many factors to conclude that the peak global load for the April 12, 1986 event is estimated at between 500 and 700. They also argue that this number is consistent with the crushing strength of the ice. This number, however, is strongly questioned by Hewitt (2008).
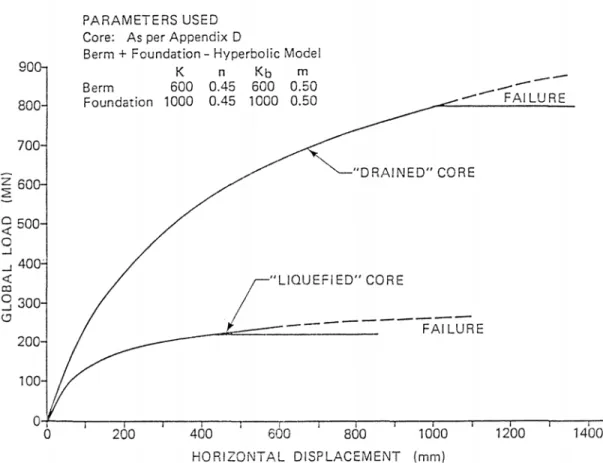
Hewitt’s argument is based largely on the core sand being loose (or low in stiffness) and liquefied during critical moments in the ice event. He points out that the high ice load given by Rogers et al. (1986) cannot co-exist with the loose core sand by citing the model study that includes physical modelling (centrifuge tests), and numerical modelling by EBA and by GCRI. The results are shown in Figure 7, where the ice loads on the Molikpaq versus the induced horizontal displacements are plotted for the various models. Figure 8 further shows the result for the two EBA models, one on the core sand being drained and the other being liquefied during the ice event. Based on these models, one could use the measured horizontal movement to predict the ice load on the Molikpaq. According to Rogers et al. (1986), the Molikpaq moved horizontally by only about 20 mm during the ice event. Even though Hewitt (2008) argues that the inclinometer casing buckled, rendering the readings for horizontal movement unreliable, he still uses the measured movements for supporting his notion that the ice load was much lower than the value given by Rogers et al. (1986).
There is another modelling based on the Sandwell model that Hewitt uses in his argument. It is not discussed here because even the author of the Sandwell model admits that the model produces questionable results in assessing the observed performance of the Molikpaq.
Hewitt (2008) further assumes that during the critical moments in the ice event, the core or a small annular zone adjacent to the caisson wall had liquefied. He then considers the core had near zero strength at the berm-core interface and behind the caisson wall. This implies that the liquefied annular zone extended from the top to the bottom of the core. Based on this, Hewitt (2008) concludes that that largest load experienced by the Molikpaq during the April 12, 1986 ice event is likely less than 200MN.
The assumption of a “liquefied core” or an annular zone extending from the top to the bottom of the core, however, is not consistent with the observed settlement distribution, measured excess pore pressure at different locations during the event, the top of the core being above water and the high variability of the core sand. If one takes these factors into account, one will likely obtain a higher estimated ice load.
5 CONCLUSIONS
(a) There are uncertainties in assessing the liquefaction potential of the pipeline hydraulically placed fill based on existing information.
(b) The core sand, placed through a pipeline with discharge just below the sea surface, is loose by text book definition, but whether or not it is contractive requires more consideration.
(c) The core sand is highly variable in nature.
(d) During the major ice event on April 12, 1986, high soil variability and different induced loading intensities lead to some parts of the core sand being liquefied while other parts remaining intact.
(e) It is difficult to accurately evaluate the ice load by means of modelling if the possibility of local liquefaction is not recognized.
REFERENCES
Baldi, G., Bellotti, R.,Gjionna, V., Jamiolkowski, M. and Pasqualini, E. (1986). Interpretation of CPT’s and CPTU’s: Part 2, Drained penetration of sands. 4th International Geotechnical Seminar, Field Instrumentation and In Situ Measurements, Singapore, pp143-156.
Been, K., Crooks, J.H.A., Becker, D.E. and Jefferies, M.G. (1986). The cone penetration test in sands: part I, state parameter interpretation. Geotechniques, Vol. 36, pp239-249.
Been, K., Jefferies, M.G. Crooks, J.H.A. Rothenburg, L. (1987). The cone penetration test in sands: part II, general influence of state. Geotechniques, Vol 37, pp285-299. Hewitt, K. (2008) Draft report, ‘Estimates of ice loads on the Molikpaq based on
geotechnical analysis and responses and Draft Comments on C-CORE report preliminary geotechnical overview of 1986 Molikpaq responses.’ K.J. Hewitt & Associates Ltd. Calgary.
Jefferies, MG., Stewart, HR., Thomson, RAA., and Roger, BT. (1985). ‘Molikpaq deployment at Tarsiut P-45’. Proc. Conference Artic 85, ASCE, San Francisco, pp1-27.
Leonard, GA., Franz, RJ., Sullivan, TM., and Levergood, JC. (1991). Discussion on ‘Influence of placement method on the in situ density of hydraulic sand fills’. Canadian Geotechnical Journal, Vol. 28, pp316-318.
Rogers B.T., Graham, C.A., Been, K., and Jefferies, M.G. (1986) Join Industry Project, Dynamic Ice/Structure Interaction with the Molikpaq at Amuligak I-65, Phase 2 Volume 1. Characterization of sand core behaviour on April 12, 1986, and development of analysis methodology.
Sladen, JA. (1989) ‘Problems with interpretation of sand state from cone penetration test.’ Geotechnique, 39, Vol 2, pp323-332.
Sladen JA., and Hewitt, KJ. (1989).‘Influence of placement method on the in situ density of hydraulic sand fills.’ Canadian Geotechnical Journal, Vol 26, No. 3, pp453-466. Schmertmann, J.H. (1977). Guideline for CPT performance and design. U.S. Department
of Transportation, Federal Highways Administration Report, FHWA-78-209. Villet, W.C.B. and Mitchell, J.K. (1981). Cone resistance, relative density and friction
Figure 2: The relationship Between Cone Resistance and Relative Density (From Baldi et al. 1986)
Figure 3: Comparative Profiles of Mean Relative Density for Hopper and Pipeline Placed Sands (After Sladen and Hewitt, 1989)
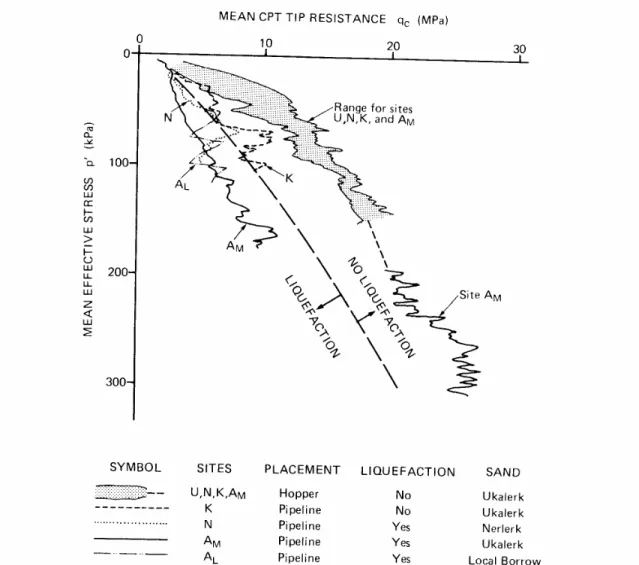
Figure 4 Mean tip resistance versus mean effective stress for the cases studied. A line separating sands that have exhibited liquefaction from those that have not is indicated. Note that although liquefaction has been reported for these sites, loading conditions were different. Key to site names: U, Uvluk P-66; Nerlerk B-67; K, Kogyuk N-67; AM,
Figure 7: Predicted Horizontal Displacement at Point of Load Application (Hewitt 2008)
Note: Physical model (1) = centrifuge test on medium dense sand Physical mode (2) = centrifuge test on loose sand
EBA analysis is based on loose sand GCRI analysis is based on dense sand
Figure 8 Load Displacement Relationships for Static Loading (“Drained Core”) and for a Completely Liquefied Core by EBA analysis (Hewitt 2008)
Review of Molikpaq Geotechnical Material
Second Report
(Draft)
September 2009
Prepared for:
Canadian Hydraulic Centre
National Research Council Canada 1200 Montreal Road M-32
Ottawa, ON K1A 0R6
Prepared by:
K.Tim Law, Ph.D., P.Eng, FHKIE, FEIC, FCAE Carleton University
Department of Civil and Environmental Engineering 1125 Colonel By Drive
Ottawa
1 INTRODUCTION
At the request of Dr. R. Frederking, Canadian Hydraulics Centre, National Research Council of Canada, Dr. Law of Carleton University is to conduct a geotechnical review of the Molikpaq geotechnical material in two stages. The first stage relates to the 2008 report by Kevin Hewitt “Estimates of Ice Loads on the Molikpaq Based on Geotechnical Analysis”, along with other materials. The second stage relates to the May 2009 report by Klohn Crippen Berger entitled “Molikpaq Ice Loading 1986 JIP Canadian Beaufort Sea Summary Document-Draft”. The 2009 Hewitt’ report entitled “Final Draft Report Estimates of I-65 based on Geotechnical Analyses and Responses” becomes available during the second stage of review. It is used as a reference in this second stage.
The two reports to be reviewed are known in the following as the KCB report and the Hewitt report.
The aim of this stage of review is to examine the opinions express in the KCB report and the Hewitt report regarding the state of the core sand, liquefaction, and the ice load from a geotechnical perspective.
2. CORE SAND BEHAVIOUR
The methods for assessing the in situ density or state in terms of relative density (Dr) or
state parameter (ψ) have been discussed in the previous report (Law 2009). Here the discussion will focus on new materials that are presented in the KCB report and the Hewitt report.
2.1 State of the core sand
The core sand was placed hydraulically with a pipeline discharge near the sea surface. Experience shows that such a method of placement will produce a loose fill. Therefore Hewitt has maintained all along that the core sand is loose and contractive. The KCB report, however, argues that the characteristic state, taken as the lowest value of 80 percentile of the state parameter, ψ, from the Cone Penetrometer Test (CPT) results, is estimated at -0.03, implying a dilative sand. This characteristic value is similar to the original value suggested by Jefferies et al. (1986). The reasons for the divergence of these two opinions have been discussed in the earlier report.
There appears some closing of the gap between these two opinions in the KCB report and the Hewitt report, Both now agree that the core sand as placed has a relative density of about 35%. However the similarity stops there.
The KCB report insists that the core sand is dilative and Hewitt maintains that the core sand is contractive. The basis of their arguments can be illustrated using the information each provides in their reports.
The KCB report provides a graph relating Dr and ψ (Figure 1). Although the KCB report
admits that there is no one-to-one correspondence between Dr and ψ, the data do show
the possibility that at Dr = 35%, the core sand may be dilative. The report goes on to
present new information on laboratory tests, theoretical study and statistical analysis. It also states that new studies have shown that the stress level shift in the interpretation of state parameter from cone penetration resistance noted by Sladen (1989) has been dealt with by using a shape factor. All these arguments lead to the conclusion that the core sand has a characteristic state of -0.03. Hence the core sand is in a mildly dilative state.
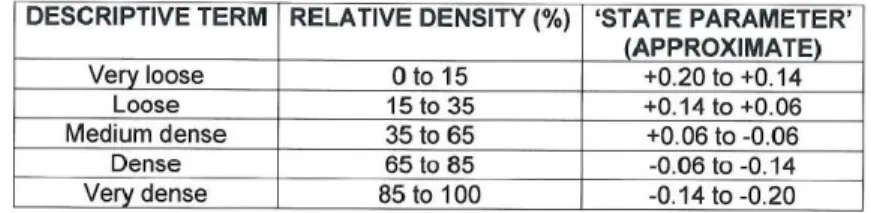
Figure 1 State parameter versus relative density in triaxial tests (KCB report) On the other hand, Hewitt shows a table (Table 1) that relates compactness of sand to relative density and state parameter. According to this table sand at Dr = 35% is
considered loose and contractive (or potentially liquefiable with ψ > 0). Hewitt further supports his position with pressuremeter test results and the successful densification of the core sand at Amauligak F-24. For the pressuremeter tests, Hewitt quoted the following statement from the contractor for GCRI: “The results… indicate that the sand as placed is ‘loose’ or at least, in a state that when sheared the sand structure would reduce in volume.” One should, however, recognize that pressuremeter tests are normally conducted at vertical intervals much larger than those of the CPT. Therefore it cannot provide a soil profile as continuous as the CPT can. The densification by blasting at Amauligak F-24 yielded a surface settlement of 0.6m and drastic increase in relative density, indicating the core sand at Amauligak I-65, which is similar to that at Amauligak
Table 1 Approximate correlation between relative density and state parameter (Hewitt 2009)
The closing of the gap is not insurmountable. With the high variability of the pipeline placed core sand and the close proximity of the characteristic state from the critical state line, it is likely that part of the core sand will be dilative and the other part contractive. Given the right applied shear stress during an ice event, the contractive part may liquefy and the dilative part remain intact. This appears to be a most plausible explanation for the observed local liquefaction and spatial variation of settlement during the April 12, 1986 ice event.
3. LIQUEFACTION
There is some general agreement on the issue of liquefaction related to the Molikpaq Amauligak I-65. As early as 1986 shortly after the ice event, Rogers et al. (1986) admitted that the pore pressure transducer E1, located at around the mid height of the core sand near the east wall, showed a significant pore water pressure rise during the April 12, 1986 ice event to the point that the fill there liquefied. Jefferies (1994) pointed out that there were two out of eighteen piezometers showing liquefaction. Hewitt (2008 2009) has been suggesting that an annulus zone of core adjacent to the caisson had liquefied during the ice event.
The KCB report introduces a small deviation on liquefaction of the Molikpaq. On p.35, the report states: “The soil behaviour during the 12 Apr 86 event was cyclic mobility, not liquefaction.” Since the time “cyclic mobility” or “cyclic liquefaction” was mentioned by Casagarade (1975), this term has gone through a long road of many meanings, due partly to semantics and partly to different researchers giving it different meanings. Casagrande defined cyclic mobility as “the response of a test specimen of dilative sand to cyclic loading in a triaxial test when the peak pore pressure rises momentarily in each cycle to the confining pressure.” He further stated that cyclic mobility normally cannot develop in dense (dilative) sand in the field. Since then there are many other definitions. For example, Kramer (1996) states that cyclic mobility can occur in the field during earthquake shaking when the static shear stress is less than the shear strength of the liquefied soil, implying cyclic mobility is a phenomenon of liquefaction. While “cyclic
the applied cyclic loads yield a shear stress reversal that leads to zero effective stress. Both terms are used to describe a mechanism for liquefaction.
In recent years, much of the difference in liquefaction terminology have been reconciled to consider cyclic mobility being a liquefaction phenomenon triggered by cyclic loading in soil deposits with the initial static shear stress lower than the soil strength. The resulting deformation is generally small unless the soil is contractive.
Based on this understanding and in view of the high excess pore pressures and large settlements, some parts of the core sand of the Molikpaq must have liquefied as supported by Rogers et al. (1986) and Jefferies (1994). Calling it “cyclic mobility, not liquefaction” is a matter of semantics.
4. ICE LOAD
This is another contentious issue in the Molikpaq project. Rogers et al. (1986) reported shortly after the April 12, 1986 ice event that the maximum ice load is in the range of 500 to 700MN, while Hewitt since the 1990’s has maintained that the ice load is much lower and would not be more than 200MN. The KCB report and the Hewitt report provide some new insights on this issue. Their estimated ice loads now are marginally closer to each other but previously unsettled issues remain.
In the KCB report, the estimated maximum global ice load is now reduced to “at least 400MN” based on numerical simulation and measured deformation, or 475 MN based on simulation of ice-structure interaction. Taking some uncertainties into account, the Hewitt report now raises the estimated ice load to 220MN. The major reason for the disagreement still lies in the fact that the two reports are basing their arguments on different aspects of the Molikpaq project and on different understanding of the core sand behaviour.
4.1 Geotechnical ice load assessment in KCB report
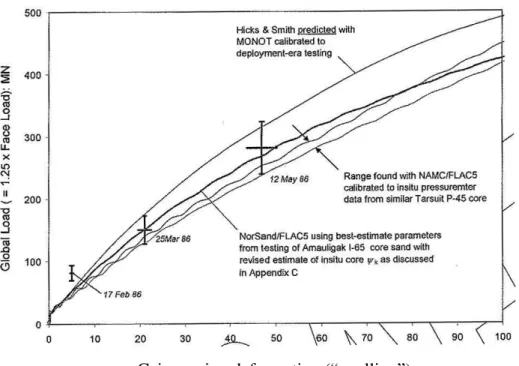
One new work included in the KCB report is the use of the “ovalling” of the caisson ring in numerical analysis to aid the estimation of the ice load under static condition. “Ovalling” refers to the measured closure between the ice loaded side and the opposite unloaded side. The results of their analysis are summarized in Figure 2. This figure shows the theoretical peak ice load versus caisson “ovalling” based on the MONOT analysis of Hicks and Smith (1988) and on FLAC-2D with the Non Associated Mohr Coulomb (NAMC) soil model and the NorSand model. The figure also shows the peak load estimated based on the readings of Medof panels and strain gauges mounted on the Molikpaq recorded during some ice events. The data in the figure shows there is some general agreement between the computed and measured trends and that there is consistency between the different soil models and numerical analyses. Based on this, the KCB reportasserts that “the Medof panels are as accurate as reported in the 1986 JIP”.
Caisson ring deformation (“ovalling”) mm
Figure 2 Comparison of load-ovalling response of Molikpaq
The results of Hicks and Smith (1988) in Figure 4 are new in the KCB report and not in their original work. Presumably the soil models chosen correspond to ψ = 0.025 and -0.075 for the core sand and the berm material, respectively. These values are closely similar to those chosen in the KCB report in their new numerical analysis to evaluate the ice load-“ovalling” relationship.
The choice of the ψ value goes back to the question of the state of the core sand. While this value is consistent with the accepted value of GCRI, it has been persistently rejected by Hewitt.
The KCB report also cites the work of Altaee and Fellenius (1994) who use a sustained cyclic load with a peak of 400MN to support their estimated ice load value.
4.2 Geotechnical ice load assessment in Hewitt report
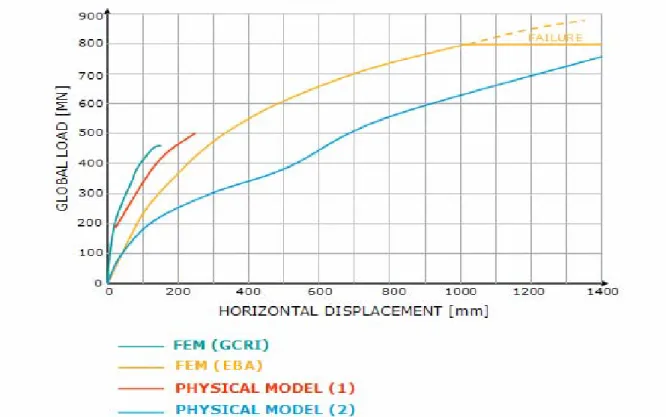
Hewitt’s argument is based mainly on considering the loose nature of the core sand and the small measured horizontal movements of the Molikpaq. These two quantities together can only lead to an ice load significantly lower than that deduced from Medof panels or strain gauges. He summarizes the results of numerical modelling (FEM GCRI and FEM EBA) and physical modelling (centrifuge tests) in Figure 3. This figure shows that a loose core sand will displace a lot more than a medium dense or dense core sand.
after the ice event, and frictional resistance between the berm and the caisson base, Hewitt obtains an estimated ice load of 220MN. He also supports his estimate of low ice load with three case records in Beaufort Sea.
Figure 3: Predicted Horizontal Displacement at Point of Load Application (Hewitt 2009)
Note: Physical model (1) = centrifuge test on medium dense sand Physical mode (2) = centrifuge test on loose sand
EBA analysis is based on loose sand GCRI analysis is based on dense sand
5 DISCUSSION
5.1 Ice load versus horizontal displacement
There is a general agreement that the horizontal movements measured during the April 12 1986 event are small, in spite of some malfunction in some inclinometer casings. The KCB report (p. 39) states that “Overall, there is about a 20mm permanent movement of the down-ice side of the caisson in the direction of the ice load.”
Different locations of horizontal movement have been considered in the different modelling of the Molikpaq performance during ice loading. Jefferies et al. (1985) discuss the horizontal movement at the top of the caisson on the ice loaded face. Hicks and Smith (1988), Altaee and Fellenius (1994) and Hewitt (2008) refer to the point of load
application on the loaded side. While all numerical modelling should be able to yield the horizontal movements at any location within the core sand, only Hicks and Smith (1988) give the horizontal displacements both at the point of load application and at the core surface where the inclinometer casings are located. Their results on the horizontal movements are compared at these two different locations as follows.
Figure 4 shows the horizontal movements at the point of load application for different soil states and different drainage conditions. The three soil states A/B, C and D correspond to mildly dilative core and stronger dilative berm, looses core and berm and very loose core and berm, respectively. At applied loads producing small horizontal displacements at the measured value of about 20mm, the load-displacement relationship remains unchanged for the three cases. That means at such low horizontal displacement, the ice load is independent of the state of the core sand. At this displacement, the ice loads are estimated at 2.7 and 1.8 MN/m for the undrainded and the drained cases, respectively. Based on the KCB method of calculation (74m wide normally loaded face and a factor of 1.25 to give the global load), these ice loads per unit width correspond to global ice loads of 247MN and 167MN, respectively. On the other hand, at a horizontal movement of 20mm at the core surface at inclinometer I2, the corresponding ice load is estimated at 5.0MN/m for the A/B case under drained loading followed by drained unloading (463MN using the KCB calculation). This significant difference in the estimated ice load for the same magnitude of horizontal movement at two different locations has not been mentioned or explained by Hicks and Smith (1988).
Interestingly, the first set of values of 247 and 167 MN agrees more with Hewitt’s estimate of ice load while the second value agrees more with the KCB estimate. In the KCB report, the estimated ice loads at the inclinometer location have been discussed in details taking the out of plane displacement and other factors into account. The reported ice load based on “ovalling” (not horizontal movement of the core sand) is estimated at 425MN. This estimated ice load based on “ovalling” is not in the original work of Hicks and Smith (1988) and yet the KCB report still considers the work is of Class A prediction category.
If one considers the estimated static ice load by Altaee and Fellenius (1994) (Figure 5), one obtains a similar observation, i.e., the estimated ice load is independent of the compactness of the core sand at low displacement values. At 20mm horizontal displacement at the point of load application, the estimated global ice load is 231MN. Similarly, the ranges of the estimated ice load based on the information provided by Jefferies et al. (1985) and Hewitt (2008): are 183 to 262MN, and 57 to 200MN, respectively.
It is clear that one can obtain a large range of estimated ice load depending on the location of the induced horizontal movement, the numerical scheme, soil model, drainage condition, and the magnitude of the actual loading. Therefore there is a lot of room for interpretation.
It is of interest to note that the KCB report has downplayed the issue of small horizontal movements in the core measured using the inclinometer. Instead of relying on the horizontal movement in the core sand, the KCB report turns to the “ovalling” of the caisson ring for estimating the ice load and validating the measurements of Medof panels and strain gauges. While the report seems to have good results with other ice events, it admits failure to capture useful readings during the critical ice event of April 12, 1986. The downplaying of the measured horizontal displacement implies the ignoring of the problem posed by the low measured horizontal movement leading to an ice load significantly lower than what GCRI estimated. The reason why this is the case has not been adequately explained in the report.
Horizontal displacement at point of ice load application
Figure 4 Summary of caisson load-displacement behaviour – Categories A/B, C, D (Hicks and Smith 1988)
Figure 5 Horizontal force versus horizontal displacement at different compactness core/berm (+ve and –ve upsilons correspond to contractive and dilative state, respectively)
5.2 Shear modulus of core sand
In its new numerical analysis, the KCB report uses a shear modulus Gmax based on
seismic tests conducted at Tarsiut P-45, presumably of the same core sand as the Amauligak I-65. As Gma is considered the initial shear modulus, a factor of 1/3 has been
applied both to the core sand and the berm material for the elastic analysis. However, the same shear modulus formula and the same density are assumed for both the core sand and the berm (Page IV.3). In other words, the core sand is considered as dense as the berm. This is in contrast to the views held by all parties in this investigation.
5.3 Best estimate of ice load
In Hewitt report, a best estimate of the geotechnical model is used to estimate the ice load. This model consider the drained condition, loose core sand, low horizontal displacement in the core sand, friction between the base of the steel caisson, finite element analysis by EBA and drained static loading. He then estimates the ice load at 240MN for a horizontal displacement in the order of 50mm.
The new study of KCB actually provides more insight to the estimated ice load. Besides considering ice-structure interaction, the KCB report does substantiate its position with more data including laboratory triaxial tests, and numerical analysis using the “ovalling” data. It also provides better understanding of the CPT data for assessing the state parameter of the core sand. On the other hand, the major problem in this estimated ice load is the downplaying of the low measured horizontal movement. This measured low
parameter of the core sand so close to the critical state line or close to being loose (contractive).
6 CONCULIONS
1. The core sand is considered loose based on textbook definition. Existing data based on an enhance understanding seems to support that the core sand is mildly dilative and its state parameter is close to the critical state line.
2. Because of high variability of the core sand and its state parameter lying closely to the critical state line, it is likely that some part of it liquefied while other part remained intact during the April 12, 1986 ice event.
3. There is general agreement on the issue of liquefaction. The entire core of the Molikpaq did not liquefy. However, some local zones did suffer liquefaction or cyclic mobility. This is consistent with the spatial settlements measured after the event, some being quite substantial.
4. There is still a significant gap between the ice load estimated in the KCB report and that in the Hewitt report. The reason lies partly in each party making reference to different aspects of the project and partly due to the different understanding of the core sand behaviour.
REFERENCES
Altaee A. and Fellenius B.H. (1994). Modeling the performance of the Molikpaq. Canadian Geotechnical Journal, Vol. 13, pp. 639-660.
Hewitt, K. (2008). Draft Report, Estimates of Ice Loads on the Molikpaq Based on Geotechnical Analysis and reponses. K.J. Hewitt & Associates Ltd. Calgary.
Casagrande, A. (1975). Liquefaction and cyclic deformation of sands - acritical review. 5th Panamerican Conference on soil Mechanics and Foundation Engineering, Buenos Aires, Argentina.
Hewitt, K. (2009). Fianl Draft Rpeort, Estimates of Ice Loads on the Molikpaq Based on Geotechnical Analysis and reponses. K.J. Hewitt & Associates Ltd. Calgary.
Hicks, M.A. and Smith, I.M. (1988). Class A prediction of artic caisson performance. Geotechnique, Vol. 38, pp. 589-612.
Klohn Crippen Berger (2009). Molikpaq Ice Loading 1986 JIP Canadian Beaufort Sea Summary Document - Draft.
Kramer, S.L. (1996). Geotechnical Earthquake Engineering. Prentice Hall, NewYork. Jefferies, M. (1994). Discussion on Modeling the performance of the Molikpaq. Canadian
Geotechnical Journal, Vol. 31, pp 922-923
Jefferies, MG., Stewart, HR., Thomson, RAA., and Roger, BT. (1985). ‘Molikpaq deployment at Tarsiut P-45’. Proc. Conference Artic 85, ASCE, San Francisco, pp1-27.
Law, K.T. (2009). Review of Molikpaq Geotechnical Material. Prepared for Canadian Hydraulic Centre, National Research Council Canada.
Robertson, P.K. (1994). Suggested terminology for liquefaction. Proceedings47th Canadian Geotechnical Conference, Halifax, Nova Scotia, pp 277-286.
Rogers B.T., Graham, C.A., Been, K., and Jefferies, M.G. (1986) Join Industry Project, Dynamic Ice/Structure Interaction with the Molikpaq at Amuligak I-65, Phase 2 Volume 1. Characterization of sand core behaviour on April 12, 1986, and development of analysis methodology.
Sladen, JA. (1989) ‘Problems with interpretation of sand state from cone penetration test.’ Geotechnique, 39, Vol. 2, pp. 323-332.