HAL Id: hal-02946950
https://hal.archives-ouvertes.fr/hal-02946950
Submitted on 23 Sep 2020
HAL is a multi-disciplinary open access
archive for the deposit and dissemination of
sci-entific research documents, whether they are
pub-lished or not. The documents may come from
teaching and research institutions in France or
abroad, or from public or private research centers.
L’archive ouverte pluridisciplinaire HAL, est
destinée au dépôt et à la diffusion de documents
scientifiques de niveau recherche, publiés ou non,
émanant des établissements d’enseignement et de
recherche français ou étrangers, des laboratoires
publics ou privés.
Post-prognostics decision making for a two-stacks fuel
cell system based on a load-dependent deterioration
model
Jian Zuo, Catherine Cadet, Z Li, Christophe Bérenguer, R Outbib
To cite this version:
Jian Zuo, Catherine Cadet, Z Li, Christophe Bérenguer, R Outbib. Post-prognostics decision making
for a twostacks fuel cell system based on a loaddependent deterioration model. PHME 2020
-European Conference of the Prognostics and Health management (PHM) Society, Jul 2020, Turin,
Italy. pp.9. �hal-02946950�
based on a load-dependent deterioration model
J.Zuoa,b, C.Cadeta, Z.Lib, C.B´erengueraand R.Outbibb
aUniv. Grenoble Alpes, CNRS, GrenobleIN P1, GIPSA-lab, 38000 Grenoble, France
1Institute of Engineering Univ. Grenoble Alpes
[email protected] [email protected] [email protected]
bLIS Laboratory, Aix-Marseille University, 13397 Marseille, France
[email protected] [email protected]
ABSTRACT
Multi-stacks proton exchange membrane fuel cell (PEMFC) system has been applied to combined heat and power system (CHP), and serves as an alternative energy device due to its high efficiency and zero emission. Owing to the limited dura-bility and larger power supply demand, the management of multi-stacks PEMFC system to obtain a longer service time has received recently growing attention. From the prognos-tics and health management (PHM) point of view, a post-prognostics decision making for multi-stacks PEMFC system is addressed in this work. Firstly, a load-dependent stochas-tic deterioration model is proposed for PEMFC. The overall ohmic resistance is chosen as the health indicator of PEMFC. Then the resistance is modeled using a Gamma process whose shape parameter is taken as a function of the current load ap-plied to the stack. Finally, for the post-prognostics decision making phase, a decision probability based load repartition criterion is built to identify the optimal load split between the two stacks. The decision probability is calculated based on the system lifetime results (EoL) in each decision step. The EoL results of the decision phase are further compared with the system EoL that calculated without decision making strat-egy. The comparison result shows that extended service time can be achieved using the proposed post-prognostics decision making method.
Jian Zuo et al. This is an open-access article distributed under the terms of the Creative Commons Attribution 3.0 United States License, which permits unrestricted use, distribution, and reproduction in any medium, provided the original author and source are credited.
1. INTRODUCTION
Facing with a growing challenge of environmental pollution and the threat of a fossil energy shortage, fuel cell technol-ogy emerged as an alternative energy device that is able to apply renewable and clean hydrogen to produce electricity, which has received intense attention for the last two decades (Pandey, 2019) (Dekel, 2018). Among all different types of fuel cells, one of the most widely used fuel cell technolo-gies is proton exchange membrane fuel cell (PEMFC). Re-cently, with the rapid progress in fuel cell technology, multi-stacks PEMFC system has drawn an increasing attention of researchers due to the high power demands in the application fields like combined heat and power system (CHP) (Marx, Boulon, Gustin, Hissel, & Agbossou, 2014). However, de-spite the promising research interest, challenges like reliabil-ity and durabilreliabil-ity of PEMFC technology remains to hinder its larger-scale commercialization.
Among the proposed approaches in the published literature, research works on PHM appears to be of great interest to-wards the health state assessment and lifetime prediction of PEMFC. PHM approaches mainly focus on the early detec-tion of system deterioradetec-tion to avoid early failure and decide for mitigation actions, and therefore increase the reliability and durability of PEMFC (Jouin, Gouriveau, Hissel, P´era, & Zerhouni, 2016) (Jouin, Gouriveau, Hissel, P´era, & Zerhouni, 2013). Generally, the implementation of a PHM approach consists of seven layers: data acquisition, data processing, condition assessment, diagnostic, prognostics, decision sup-port and human-machine interface. Several research works have been addressed explicitly and specifically the issue of resorting to a PHM framework to solve the reliability and
EUROPEANCONFERENCE OF THEPROGNOSTICS ANDHEALTHMANAGEMENTSOCIETY2020
durability challenges of PEMFC (Herr et al., 2017) (Rama, Chen, & Andrews, 2008) (Jouin et al., 2013).
An increasing number of works are being focused on RUL prognostics considered as a key component of PHM chain. Zhang et al. (D. Zhang, Cadet, Yousfi-Steiner, & B´erenguer, 2018) developed a particle filtering based prognostics ap-proach which considering degradation recovery phenomena. Zhou et al. (Zhou, Al-Durra, Zhang, Ravey, & Gao, 2018) proposed a novel robust prognostic approach that contains three phases for PEMFC degradation prediction and RUL es-timation. An adaptive data-driven prognostic strategy is pro-posed for PEMFC by Li et al. (Li, Zheng, & Outbib, 2019). As can be seen in these works, various approaches have been developed to achieve a high RUL prediction accuracy. How-ever, the RUL prediction remains of limited interest if it is not used to make a decision, and its performance can be sensibly assessed only at the level of the whole processing chain, i.e. from prediction to decision-making.
In order to forge a more comprehensive implementation of PHM framework for PEMFC to extend its useful lifetime, this work proposes a post-prognostics decision making strategy for a multi-stacks fuel cell system. Whenever a prognostics method has been developed to predict the RUL of PEMFC, decisions have to be made for the system to achieve a useful lifetime extension. Firstly, the problem formulation, includ-ing fuel cell deterioration model and decision makinclud-ing prob-lem are presented. The methodology is then detailed, given the RUL determination and the decision strategy. Finally, simulations are carried out and the results are compared with deterioration calculated without decision making procedure.
2. PROBLEM FORMULATION
2.1. Fuel cell deterioration model
Until now, the deterioration mechanisms of PEMFC are not fully known yet, because of the complex electrochemical mechanical, and thermal degradations are involved in dif-ferent components of a PEMFC stack (Jouin et al., 2016) (Rama et al., 2008) (Ous & Arcoumanis, 2013) (X. Yu & Ye, 2007). These degradations tend to be highly dependent on the PEMFC operating conditions. For example, when a PEMFC is operated through an automotive cycle, it may suffer from more serious degradation. Thus, in this work, the degradation of fuel cells is modeled as a function of the load.
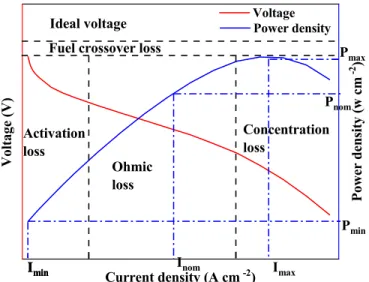
A usual tool used to characterize fuel cells is the polarisation curve, which illustrates the cell voltage with respect to the current density. As depicted in Fig.1, there are mainly four types of voltage losses in PEMFC, fuel crossover loss, acti-vation loss, ohmic loss and concentration loss. In this work, the output voltage of PEMFC is calculated using an empirical model (Kim, Lee, Srinivasan, & Chamberlin, 1995) as:
Vst= n(E0− RJ − A ln(J ) − m1exp(m2J )) (1)
where n is the number of cells in one PEMFC stack, J represents the current density, R is the overall resistance of PEMFC, A is the Tafel parameter for oxygen reduction,
m1, m2 represent the constant related to the mass transport
overpotential. E0is the voltage term related to reversible
po-tential of PEMFC.
Eq.(1) involves the parameter set Q= {E0, R, A, m1, m2}.
The parameter values vary with the degradation of the fuel
cell. As indicated by recently published investigations,
(D. Zhang et al., 2018) (D. Zhang, Cadet, Yousfi-Steiner, Druart, & B´erenguer, 2017) (Jouin et al., 2016), the resis-tance R is representative of the global state of health of the fuel cell. It is therefore chosen as the degradation indicator of the fuel cell in this work. The deterioration model of R will be explained in next section.
Voltage V o l t a g e ( V ) Current density (A cm -2 ) Power density P o w e r d e n s i t y ( w c m -2 ) Ideal voltage Fuel crossover loss
Activation loss Ohmic loss Concentration loss I min I min I nom I min I max P min P nom P max
Figure 1. Polarization curve and corresponding power curve of PEMFC.
2.2. Decision making problem
The objective of the decision making phase is to decide the optimal load repartition for two-stacks system at each deci-sion step in order to obtain the maximum system service time. The idea of the management of the system lifetime through the post-prognostics decision making process is due to the deterioration of the PEMFC is directly affected by its opera-tion load level (Herr et al., 2017) (X. Zhang, Yang, Luo, & Dong, 2017).
The following assumptions are made on the proposed two-stacks fuel cell system:
• Constant load demand is defined for the two-stacks
PEMFC system, denoted as Iload.
• The two PEMFC stacks in the system are identical. The
Figure 2. Schematic of the post-prognostics decision making strategy.
minimal output power Pminto maximum output power
Pmax, as shown in Fig. 1.
• This work only focused on the management of fuel cell,
the management of the auxiliary systems is not con-cerned here.
• The two PEMFC stacks in the system are connected in
parallel.
• The value of the fuel cell resistance is considered to be
measured in this work. The resistance value can be fur-ther estimated thanks to an observer.
The block function scheme of the problem studied in this work is shown in Fig.2. The variables (current density, volt-age, lifetime and so on) are represented by arrows, and the block in the figure represents the fuel cell or the calculation to be done in the work. The problem is to estimate the PEMFC degradation, then to estimate the EoLs and at last to define a way to decide the load repartition to satisfy the global load demand.
3. POST-PROGNOSTICS DECISION MAKING
3.1. Gamma process deterioration modeling
In order to simulate the deterioration path of R, a Gamma process was adapted to calculate the deterioration value which increases with time. In the previous section 2.1, the basic knowledge about fuel cell deterioration and the influ-ence of the operating load have already been introduced. Fur-thermore, the global resistance R has been chosen as a dete-rioration indicator that is supposed to be measured. In this subsection, the deterioration level is modeled as a stochastic Gamma process, and the dependency on time and load de-mand is explicitly expressed.
A Gamma process is a stochastic process with independent, positive increments that obey a Gamma distribution Γ(α, β) characterized by two key parameters: its shape parameter
α and scale parameter β. Gamma processes are suitable
for continuous and monotonous deterioration modelling, (van
D e t e r i o r a t i o n l e v e l c m 2 Time (h) Deterioration level t 1 t 2 x(t 2 ) x(t 1 ) x(t 1 ) ~ G (a(t 2 ) - a(t 1 ),b ) EOL Failure Threshold
Figure 3. Deterioration path of a Gamma process.
Noortwijk, 2009). By definition, for a Gamma process x(t) with shape parameter α(t) and β, we have the following prop-erties, see Fig.3:
• x(0) = 0, with probability equal to 1 ;
• the deterioration increment ∆x(t1, t2) = x(t2) − x(t1)
between t1 and t2is characterized by
∆x(t1, t2) ∼ Γ (α(t2) − α(t1), β) (2)
On a unit time interval ∆t = 1, the mean and variance of the degradation increment ∆x are given by:
Mean(∆x) = α · β · ∆t = α · β (3)
Var(∆x) = α · β2· ∆t = α · β2 (4)
Using Gamma processes, various deterioration behaviors can be simulated by resorting to different α and β values. In this work, one of the key process is to properly choose the pa-rameters for the Gamma process so that a deterioration path with sufficient variance can be achieved. This specific setting obeys the intrinsic aspect of PEMFC deterioration, for it is a stochastic process with uncertainty involved in it. More-over, for a Gamma process given with a known parameters, when a failure threshold (FT) of the deterioration is defined, the average end of life (EoL) can be calculated by:
EoL = F T
α · β (5)
Finally, in order to introduce the dependence of the deteri-oration process to the load applied to the system, the shape parameter of the Gamma law is assumed to be a function of the current load I, i.e. α(I).The form of this function is detailed in the next section. The parameter β is taken as a constant. The proposed Gamma process-based deterioration
EUROPEANCONFERENCE OF THEPROGNOSTICS ANDHEALTHMANAGEMENTSOCIETY2020
model is stochastic and not deterministic, this makes the mod-eling work and following decision making approach more challenging and suitable for real fuel cell lifetime manage-ment.
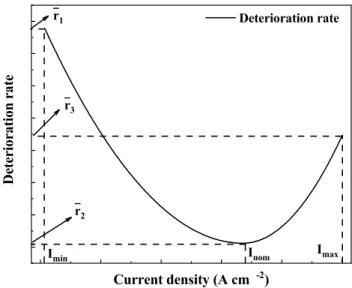
3.2. PEMFC load dependent deterioration modeling As already mentioned, we have to consider that the deteriora-tion rate changes with the current load. The shape parameter α in Gamma process Eq.(2) is set by referring to a real fuel cell deterioration rate, whereas the scaling parameter β is de-fined as a constant value. An asymmetric quadratic function is defined to describe the relationship between the deterio-ration rate and the current density (load level), as shown in Fig.4. The current density represents the operating load de-mand level of a PEMFC.
The deterioration rates are defined based on the deterioration mechanism of PEMFC. When PEMFC is operated at lower current density load, the output voltage of the fuel cell is rel-atively high, this will causing great damage to the PEMFC membrane (Endoh, Terazono, Widjaja, & Takimoto, 2004). Besides, high voltage may also cause deterioration to other key components of PEMFC, like catalyst layer (CL), gas dif-fusion layer (GDL), further causing a performance decreasing (Chung, Kim, Sung, Lee, & Chung, 2009) (Y. Yu et al., 2012). As the deterioration of PEMFC is dependent on its operating load level, different deterioration rate can be set with respect to the current load level.
In this work, it is assumed that the average EoL of PEMFC
operating at the minimal current density Iminis EoL1.
Sim-ilarly, for the nominal current density Inom and maximum
current density Imax, the average EoL are EoL2and EoL3
respectively, with EoL1 < EoL3 < EoL2. The average
deterioration rate ¯rican then be calculated for these three
dif-ferent cases as: ¯
ri= αi· β =
F T − R0
EoLi
(6) where i = 1, 2 and 3 corresponding to the minimal, nominal and maximum current density respectively. R0 represents the initial deterioration level. The calculated deterioration rate is further used to define the parabola function as shown in Fig.4. The deterioration path can be simulated with an identified model. For a given realization of the deterioration path, the failure time of the PEMFC is defined as the first time when the deterioration level exceeds the failure threshold F T . The specific application and simulation results will be further de-scribed in the results and discussion section.
D e t e r i o r a t i o n r a t e Current density (A cm -2 ) Deterioration rate I max I nom I min r 1 r 3 r 2
Figure 4. Deterioration rate vs current density.
3.3. Decision making for the load repartition for a two-stackssystem
The developed model is then used for the post-prognostics de-cision making phase to decide the optimal load split between two PEMFC stacks so that the maximum system service life can be achieved. This decision making procedure is made periodically, at fixed decision time interval ν.
For each decision period, the decision probability is noted as
Pd and the decision threshold F Td. As shown in Fig.5, A
system with two PEMFCs has been running for t0. FC1 and
FC2 are two PEMFC stacks in the system. For these two PEMFCs, the failure occurs due to an excess of deterioration threshold, and the distribution law of the failure time T can be calculated analytically as (Wenjia Xu & Wenbin Wang, 2012):
F (t) = P (T ≤ t) = Γ(αt, F Td· β)
Γ(αt) (7)
where T is the first hitting time of the level F Td by the
stochastic process x(t).
According to the previous discussion, the threshold used for the decision making at each decision step can be set as:
F Td= α · β · ν + Dinit (8)
where the parameter ν plays a role similar to EoL in Eq.(5).
Dinitrepresents the initial deterioration level at the beginning
of each decision interval ; for decision step 1, its value equals to R0.
Eq.(7) defined an analytical approach to calculate the decision
probability Pd. Considering the decision time interval ν, Pd
is decided by:
This approach is sketched in Fig.5: the red and black solid curves above the decision threshold represent the predicted lifetime distribution for FC1 and FC2 that are calculated at
time t0. P1is the probability that the deterioration level of
F C1 exceeds the decision threshold before (t0+ ν) hours ;
similarly, the decision probability of F C2 is P2. In this work,
the decision criterion is then defined as (1 − P1) · (1 − P2),
and we seek to maximize the criterion to obtain the longest system lifetime. This is realized by searching the optimal
load split between the two stacks. The solid line below F Td
is the corresponding deterioration trajectories simulated for FC1 and FC2 after the decision.
A Gamma process based simulation was performed. Two types of deterioration trajectories are simulated :
• Trajectories developed with decision making, for FC1
and FC2, denoted as R1 and R2 respectively
• Trajectories developed without decision making, used as
comparison group, the corresponding trajectories are de-noted as R1c and R2c for FC1 and FC2 respectively. In order to justify the efficiency of the proposed decision making strategy, the lifetime of two stacks system are cal-culated based on the simulated trajectories. For system life-time calculated based one single deterioration trajectory, the simulation was denoted as one time running simulation; for system lifetime calculated based on N deterioration trajecto-ries (average system lifetime), the simulation was denoted as N times running simulation. The lifetime for one time
simu-lation (EoL1) was calculated by:
EoL1= min{EoLR1, EoLR2} (10)
where EoLR1represents the lifetime of FC1, EoLR2
repre-sents the lifetime of FC2.
The lifetime of the system can then be estimated by averaging
the results over the N simulations ( dEoLN):
d EoLN = 1 N N X i=1
(min {EoLR1i, EoLR2i}) (11)
where EoLR1i represents the lifetime results of FC1
calcu-lated by the ith deterioration trajectory, EoLR2i represents
the lifetime results of FC2 calculated by the ith deterioration trajectory.
In this work, the EoL calculated from R1 and R2 (with the decision making algorithm implemented) are denoted as
EoL1d and EoL2d, the results that are calculated from R1c
and R2c are denoted as EoL1cand EoL2c. Similarly, at the
system level, for EoLN, we have EoLN dand EoLN c.
𝐓𝐡𝐫𝐞𝐬𝐡𝐨𝐥𝐝 Deterior ation level ( cm 2) Time (h)
Figure 5. Principle of decision making strategy
4. RESULTS AND DISCUSSION
4.1. load-dependent deterioration simulation
As described in Section 2, R0is identified by fitting the
polar-ization curve model to the measured data of an actual PEMFC stack. The fitting results were summarized in Table 1. The load-dependent modeling results were presented in Fig.6. For the Gamma process, the scaling parameter β is defined as
constant value 0.32. R0 represents the initial overall
resis-tance of the PEMFC stack, and is further used in the deterio-ration simulation part.
The shape parameter was modeled as a function of the current load, and was calculated based on Eq.(6) and Fig.4, as intro-duced in section 3.2. In this work, the F T for one PEMFC stack is defined as 1.9. The desired average EoL and the corresponding values for the average deterioration rates un-der the different possible load conditions based on Eq.(6) are
summarised in Table 2 . The values for Imin, Inomand Imax
are calculated as 0.214, 0.7 and 1.6 Acm−2 respectively,
based on the knowledge of the concerned PEMFC. In Fig.6, Table 1. Parameters fitting results for Polarization equation
E0 R0 A m1 m2
0.8034 0.1797 0.0236 2.692e−5 0.0092
it is clearly seen that the resistance deterioration path is di-rectly influenced by the current load. At the beginning, from
0 to 200h, the current density J equals to Inom, according
to the function defined in Fig.4, the deterioration rate is the
lowest; then J increase to Imax, deterioration rate increased
accordingly; next J decrease to the nominal value, deterio-ration rate decreased; and next period, the deteriodeterio-ration rate reaches the maximum level for the current density decreased
EUROPEANCONFERENCE OF THEPROGNOSTICS ANDHEALTHMANAGEMENTSOCIETY2020
to Imin; and finally when the current density level recovers to
Inom, then deterioration rate decreases. These results prove
that the PEMFC deterioration is dependent on the operating current load and the proposed load-dependent deterioration model works. 0 200 400 600 800 1000 0.2 0.4 0.6 0.8 1 1.2 1.4 1.6 Time (h) Current density C u r r e n t d e n s i t y ( A c m -2 ) 0.2 0.25 0.3 Stack resistance S t a c k r e s i s t a n c e ( W c m 2 )
Figure 6. Load-dependent deterioration model results for one stack.
Table 2. Parameter calculation results for Gamma process simulation
Imin Inom Imax
EoL (h) 200 2800 300 r (e−4) 128 9.15 85
4.2. Results for post-prognostics decision making This subsection presents the main results of the proposed post-prognostics decision making strategies for the two-stacks system. As introduced in Section 3.3, a load repartition decision is performed every ν (decision time interval), formu-lating a multi-step decision making strategy. In this work, the decision time interval ν is defined as 150 h. The first step is based on the PEMFC deterioration model combine with the Gamma process to simulate the deterioration path for each PEMFC. The current load demand in this work is defined as
a constant value, Iload= 1.8 Acm−2.
Based on Eq.(8), the F Td corresponding to the maximum
deterioration rate r1which used in this work is calculated for
each decision step. The scheduled simulation horizon in this work is 3900 h, Therefore, the decision steps equals to 26.
The F Tdfor the first decision step was calculated by Eq.(8),
its value is 0.5899. Due to the limits in Eq.(7), the F Td in
each step should no less than the initial deterioration level, therefore, an adaptive decision threshold were calculated for the follow step, with 35% increment of the initial deteriora-tion level. Then based on the analytical method proposed in
section 3.3, the decision probability for current density
rang-ing from Iminto 1.5 A cm−2with 1287 groups was
investi-gated. The load repartition results were summarized in Fig.7, 8, 9, 10, and Table 3.
Fig.7 shows the post-prognostics decision making results of one time running the simulated deterioration trajectories were compared with the curves obtained without decision making strategy. Besides, for the comparison group, the current
den-sity of both stack was set as 0.9 A cm−2. From Fig.7(a), it
is clear seen that for the deterioration trajectories with deci-sion making strategy, its deterioration is much smaller. Be-sides, the deterioration level of R1 and R2 changes during the operating time, this is due to the mitigating effects of the proposed decision making strategy. Combining with the load repartition results in Fig.7(b), FC1 and FC2 both begins at
0.9 A cm−2, but in the following periods, their current load
changes at each decision step, this helps to investigate the health state of each fuel cell stack and thus extend the system lifetime. Finally, the system lifetime results were calculated based on Fig.7, summarized in Table 3. For one time running
simulation, EoL1d is 2916 h, much high than EoL1c(1049
h).
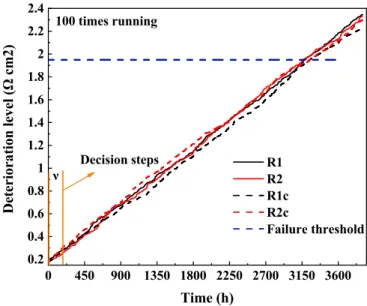
However, because of the stochastic nature of the system evo-lution, the EoL results on a single simulation run are not enough to prove the efficiency of the proposed decision strat-egy. Therefore, the average deterioration trajectories and me-dian EoLs are further discussed, see Fig.8. Fig.8 shows that the trajectories of R1, R2 and R1c, R2c are very close and the load repartition strategy does not show obvious effects on the mean deterioration path compared with Fig.7(a). However, the active load repartition reduces the variance between the deterioration trajectories of both stacks within the same fuel cell stack : they are synchronized which increases the sys-tem lifetime and a fast deterioration behavior of one stack is compensated and balanced with the deterioration of the other stack. Without the decision making strategy, the deterioration paths remain desynchronized and there is high risk that one of the two FC stacks fails early, hence reducing the lifetime of the system.
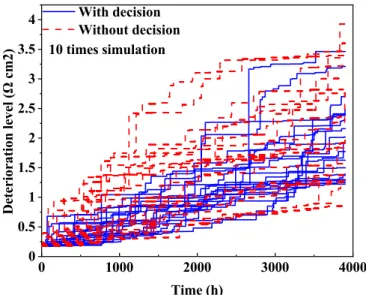
Moreover, for a set of 100 simulations, histograms of the system lifetimes with and without decision are shown in Fig.9. By comparing Fig.9(a) and Fig.9(b), the system life-time results with decision are mostly distributed in the range (2500, 4000) h, with a median lifetime of 3018.5 h. The life-times without decision are mainly distributed in (1500, 3000) h with a median lifetime value equal to only 2662 h. The specific deterioration trajectories from a set of 10 simulations are presented in Fig.10. The overall results in Fig.10 show that the trajectories that developed with decision are more grouped together with a low variance and that the deterio-ration tends to be lower than that without decision, which proves that the proposed decision making strategy can help
to mitigate the system deterioration, improving its lifetime. 0 450 900 1350 1800 2250 2700 3150 3600 0.4 0.8 1.2 1.6 2 2.4 2.8 3.2 D e t e r i o r a t i o n l e v e l ( c m 2 ) Time (h) R1 R2 R1c R2c Failure threshold Decision steps
(a) One time running simulation
2 4 6 8 10 12 14 16 18 20 22 24 26 0 0.1 0.2 0.3 0.4 0.5 0.6 0.7 0.8 0.9 1 1.1 Current density (A cm -2 ) D e c i s i o n s t e p s
Current load for FC2 Current load for FC1
(b) Load repartition for two-stacks system
Figure 7. PEMFC Deterioration trajectories build for two-stacks (R1 and R2 with load repartition, R1c and R2c without decision)
5. CONCLUSION
A post-prognostics decision making strategy was proposed to decide the optimal load split between the two stacks in order to maximize the system lifetime. In this work, two PEMFC stacks need working simultaneously to provide the desired system load demand, the decision criterion is then constructed to further calculate the optimal load repartition for two stacks. To well demonstrate the efficiency of the proposed decision making strategy, results based on one time running simu-lation and multi-times running simusimu-lation (100 times) were both discussed in this work. For one time running simulation,
0 450 900 1350 1800 2250 2700 3150 3600 0.2 0.4 0.6 0.8 1 1.2 1.4 1.6 1.8 2 2.2 2.4 D e t e r i o r a t i o n l e v e l ( c m 2 ) Time (h) R1 R2 R1c R2c Failure threshold Decision steps 100 times running
Figure 8. Average deterioration results (100 times running) Table 3. Examples of EoL results for a single simulation and for 100 simulations (median and average values).
EoL1(h) EoL100(h) EoL100(h)
EoL1(h) Median Mean
with decision 2916 3018.5 2908.8 without decision 1049 2662 2615.1
the system lifetime results after decision making strategy is 2234 h, much higher than the results calculated without a
de-cision (1029 h). For average simulation results EoL100d is
2908.8 h, higher than EOL100c(2615.1 h), besides, the
tra-jectories and system lifetime statistic results prove that the proposed post-prognostics decision making strategy can help to mitigate the deterioration and to improve the system life-time. Based on the proposed post-prognostic decision making framework, future work will be focused on the combination with real fuel cell test data to further study its application on multi-stacks fuel cell system.
REFERENCES
Chung, C. G., Kim, L., Sung, Y. W., Lee, J., & Chung, J. S. (2009). Degradation mechanism of electrocatalyst during long-term operation of PEMFC. International Journal of Hydrogen Energy, 34(21), 8974–8981. Dekel, D. R. (2018). Review of cell performance in anion
ex-change membrane fuel cells. Journal of Power Sources, 375, 158–169.
Endoh, E., Terazono, S., Widjaja, H., & Takimoto, Y. (2004). Degradation study of MEA for PEMFCs under low humidity conditions. Electrochemical and Solid-State Letters, 7(7), A209–A211.
EUROPEANCONFERENCE OF THEPROGNOSTICS ANDHEALTHMANAGEMENTSOCIETY2020 500 1000 1500 2000 2500 3000 3500 4000 0 5 10 15 20 25 30 35 F r e q u e n c y c o u n t s System lifetime (h) System lifetime with decision
(a) System lifetimes histogram (with decision)
500 1000 1500 2000 2500 3000 3500 4000 0 5 10 15 20 25 30 35 F r e q u e n c y c o u n t s System lifetime (h) System lifetime without decision
(b) System lifetimes histogram (without decision)
Figure 9. Histograms of the observed system lifetimes for 100 simulations
Hissel, D., & P´era, M.-C. (2017). Decision process to manage useful life of multi-stacks fuel cell systems under service constraint. Renewable energy, 105, 590– 600.
Jouin, M., Gouriveau, R., Hissel, D., P´era, M.-C., & Zer-houni, N. (2013). Prognostics and health manage-ment of PEMFC–State of the art and remaining
chal-lenges. International Journal of Hydrogen Energy,
38(35), 15307–15317.
Jouin, M., Gouriveau, R., Hissel, D., P´era, M.-C., &
Zer-houni, N. (2016). Degradations analysis and
ag-ing modelag-ing for health assessment and prognostics of PEMFC. Reliability Engineering & System Safety, 148, 78–95. 0 1000 2000 3000 4000 0 0.5 1 1.5 2 2.5 3 3.5 4 With decision Without decision D e t e r i o r a t i o n l e v e l ( c m 2 ) Time (h) 10 times simulation
Figure 10. 10 times simulation deterioration trajectories re-sults
Kim, J., Lee, S.-M., Srinivasan, S., & Chamberlin, C. E. (1995). Modeling of proton exchange membrane fuel cell performance with an empirical equation. Journal of the electrochemical society, 142(8), 2670.
Li, Z., Zheng, Z., & Outbib, R. (2019). Adaptive prognostic of fuel cells by implementing ensemble echo state net-works in time-varying model space. IEEE Transactions on Industrial Electronics, 67(1), 379–389.
Marx, N., Boulon, L., Gustin, F., Hissel, D., & Agbossou, K. (2014). A review of multi-stack and modular fuel cell systems: interests, application areas and on-going research activities. International Journal of Hydrogen Energy, 39(23), 12101–12111.
Ous, T., & Arcoumanis, C. (2013). Degradation aspects of water formation and transport in proton exchange
membrane fuel cell: A review. Journal of Power
Sources, 240, 558–582.
Pandey, J. (2019). Recent progresses in membranes for pro-ton exchange membrane fuel cell (PEMFC) for clean
and environmentally friendly applications. In
Nan-otechnology applications in environmental engineering (pp. 308–343). IGI Global.
Rama, P., Chen, R., & Andrews, J. (2008). A review of per-formance degradation and failure modes for hydrogen-fuelled polymer electrolyte fuel cells. Proceedings of the Institution of Mechanical Engineers, Part A: Jour-nal of Power and Energy, 222(5), 421–441.
van Noortwijk, J. M. (2009). A survey of the application of gamma processes in maintenance. Reliability Engi-neering & System Safety, 94(1), 2–21.
Wenjia Xu, & Wenbin Wang. (2012). An adaptive gamma process based model for residual useful life prediction. In Proceedings of the ieee 2012 prognostics and sys-tem health management conference (phm-2012 beijing)
(p. 1-4).
Yu, X., & Ye, S. (2007). Recent advances in activity and durability enhancement of Pt/C catalytic cathode in PEMFC: Part ii: Degradation mechanism and durabil-ity enhancement of carbon supported platinum catalyst. Journal of power sources, 172(1), 145–154.
Yu, Y., Li, H., Wang, H., Yuan, X.-Z., Wang, G., & Pan, M. (2012). A review on performance degradation of proton exchange membrane fuel cells during startup and shut-down processes: Causes, consequences, and mitigation strategies. Journal of Power Sources, 205, 10–23. Zhang, D., Cadet, C., Yousfi-Steiner, N., & B´erenguer, C.
(2018). Proton exchange membrane fuel cell remain-ing useful life prognostics considerremain-ing degradation re-covery phenomena. Proceedings of the Institution of
Mechanical Engineers, Part O: Journal of Risk and Re-liability, 232(4), 415–424.
Zhang, D., Cadet, C., Yousfi-Steiner, N., Druart, F., & B´erenguer, C. (2017). Phm-oriented degradation in-dicators for batteries and fuel cells. Fuel Cells, 17(2), 268–276.
Zhang, X., Yang, D., Luo, M., & Dong, Z. (2017). Load pro-file based empirical model for the lifetime prediction of an automotive pem fuel cell. International Journal of Hydrogen Energy, 42(16), 11868–11878.
Zhou, D., Al-Durra, A., Zhang, K., Ravey, A., & Gao, F.
(2018). Online remaining useful lifetime prediction
of proton exchange membrane fuel cells using a novel robust methodology. Journal of Power Sources, 399, 314–328.