HAL Id: halshs-00280671
https://halshs.archives-ouvertes.fr/halshs-00280671
Submitted on 19 May 2008HAL is a multi-disciplinary open access
archive for the deposit and dissemination of sci-entific research documents, whether they are pub-lished or not. The documents may come from teaching and research institutions in France or abroad, or from public or private research centers.
L’archive ouverte pluridisciplinaire HAL, est destinée au dépôt et à la diffusion de documents scientifiques de niveau recherche, publiés ou non, émanant des établissements d’enseignement et de recherche français ou étrangers, des laboratoires publics ou privés.
Data Management, Visualization and Documentation
Elise Meyer, Pierre Grussenmeyer, Jean-Pierre Perrin, Anne Durand, Pierre
Drap
To cite this version:
Elise Meyer, Pierre Grussenmeyer, Jean-Pierre Perrin, Anne Durand, Pierre Drap. A Virtual Research Environment for Archaeological Data Management, Visualization and Documentation. 35e conférence du CAA ”Layers of perception. Advanced technological means to illuminate our past”, Apr 2007, Germany. pp.1-6. �halshs-00280671�
A Virtual Research Environment for Archaeological Data Management,
Visualization and Documentation
Elise Meyer
1, Pierre Grussenmeyer
2, Jean-Pierre Perrin
1, Anne Durand
3, Pierre Drap
31
CRAI UMR 694 MAP CNRS-MCC, Nancy School of Architecture, Nancy, France
2
PAGE UMR 694 MAP CNRS-MCC, INSA Strasbourg, Strasbourg, France
3
LSIS UMR 6168 CNRS,
ESIL Luminy Graduate School, Marseille, France
Abstract: Developing data management systems to store and make use of the heterogeneous archaeological datasets is very
significant nowadays. This allows to preserve the information and offers new management possibilities, like the immediate connection of different kinds of data for analyses, or the digital documentation of the site for its improvement. In this scope, this paper aims to present a Virtual Research Environment for archaeological sites. It is based on open source software modules dedicated to the Internet, to avoid users to be software driven and to permit them to work from different computers. Our VRE has diverse objectives: digital archiving of archaeological datasets, data inquiry through different interfaces notably clickable maps and 3D models, attractive visualization and communication of the information. The tool proposed is compliant to every kind of archaeological site. Some experimentation has been done on sites managed by the Service of the National Sites and Monuments of Luxembourg.
Key words: Information System, Data management, Internet, Archaeology.
1 Introduction
Cultural heritage documentation induces the use of computerized techniques to handle and preserve the information produced. In archaeology, numerous documents have been produced for years without computerized means and it is now necessary to conserve them numerically, to be able to combine them with the new representations of the monuments that can be done currently (3D models for instance). In the archaeological domain particularly, data computerization gives solutions to specific problems in allowing inventory actions to save, represent or understand the features. Archaeology is an erudition discipline where the knowledge grows up in necessarily referencing the precious documents already gathered. The quantity of data produced during the working of a site can thus be quickly huge. Moreover, archaeological datasets are made of primary information, concerning the archaeological realities themselves (objects or configurations), and of secondary information including documents that permit to know these realities, publications with artefacts descriptions and comments, or images collections. It is then required to develop systems allowing to create relationships between these numerous and heterogeneous data, for instance to retrieve immediately for a primary data like a ceramic, the diverse secondary data making its study easier.
2 Proposition
To produce such systems it is necessary, first of all, to create a database permitting to record these data. The majority of the databases currently used in archaeology is relational, because the structure and the relationships of excavation data can be successfully modelled in this type of databases (Richards 1998). These databases have to contain the totality of the characteristics generally used by the archaeologist in his interpretative reasoning, with in addition the characteristics which does not serve directly but allow to have a more precise view of the document, or for which we can think that they could be valuable one day. Therefore, the description of the feature that is recorded in the database is at least as rich as the report from traditional publications (Ginouvès and Guimier-Sorbets 1978). Then, to record the context or metadata of the data is as important as to record the data itself. The database that we propose for archaeological documentation allows then to record data and metadata in the XML (eXtensible Markup Language) format and to insert them automatically into a MySQL database. XML has been chosen because it is a standard of the W3C (WWW Consortium) for data description, and because it induces the registration of metadata about the data to preserve (to have secondary information about the
primaries). The system is very flexible as it allows the user to choose the metadata he wants to attach (according to an archaeological standard e.g. CIDOC-CRM (Doerr 2003)).
Afterwards, an Information System has to be conceived to provide an enrichment of the information recorded in the database, in permitting the immediate confrontation of the data. An Information System is a combination of the diverse types of data accessible through various interactive consultation systems. We propose an Information System based on open source software modules dedicated to the Internet, which aims notably:
to process graphically several information derived from very different kinds of surveys, because a selective superimposing could be a precious help for the interpretation;
to combine elements selected in diverse graphs or models for the generation of visualizations in synthesis maps or 3D models, for example to be able to see in a new way the historical changes of the archaeological site;
to present images and their connections with the concerned texts from the database, to lead to a complex system in which the process of texts and images would be possible simultaneously;
to search in the dataset thanks to views of the data, or thanks to diverse search engines by data types, keywords or images.
Thematic and interactive treatments are then achievable, principally on spatial and temporal criteria.
These treatments provided by the Information System are necessarily combined with visualization systems that permit to see the results of the data extractions. The means of visualization of Cultural Heritage information are numerous to allow visual interpretation of data through representation, modelling or animation, what is rarely possible in traditional paper publication. Visualization techniques are constantly evolving, but the most frequently they are based on 3D modelling used notably for museum presentations. The principal drawback of the types of 3D models used in archaeology nowadays is that these models are "empty". The idea in then to produce 3D models that can serve as research interfaces to access different kinds of information, notably in coupling them with web procedures (scripts). Our system has been carried out this way: we have produced interactive maps and 3D models that work like web interfaces to obtain views of the database records. It is linked to research work of P. Drap (Drap et al. 2005), who has notably developed a system integrating photogrammetric data and archaeological knowledge. The clickable representations are 2D images or vectors created in SVG (Scalable Vector Graphics) from scanned or vectorial drawings, and 3D models produced in VRML (Virtual Reality Modelling Language) or X3D (eXtensible 3D), for a full compliance with the W3C recommendations, from topographic, photogrammetric or laser scanning surveys.
Finally, the creation of a system working on the Web provides a tremendous opportunity to link distributed resources and to make unpublished material widely available (Ryan 1995) (remarkably uncommon material like detailed fieldwork data, quantities of photos and archive drawings, vectorial graphs or 3D models). The division between publication and archive could thus be removed, even if there is still a big challenge to control the way in which the Internet is used (for the discoveries, quality controls or copyrights). The use of the World Wide Web network permits to communicate the archaeological data managed in a very complete way, more complete that traditional publication. Aims of the Web Information System are to assist the digital archiving of the documents, their inquiry and their processing by everyone, both the professionals (archaeologists, surveyors or architects) and the general public. Different types of access to the data are available depending on the user of the system. Representations adapted to museum displays (public attractive) have been done as well as interfaces permitting to update the data directly from the 3D models, for the needs of the site managers. Moreover, the development thanks to open source software modules allows accessibility and simplicity for all the users, and above all permits us to propose a system independent from any commercial software.
Then, we propose a Virtual Research Environment1, which has the following objectives: complete digital archiving of archaeological datasets,
innovative data inquiry notably through clickable maps and 3D models,
attractive visualization and communication of the site information thanks to thematic and interactive interfaces.
The tool notably combines survey, modelling and imagery data, and our purpose is to highlight how such a system can offer new possibilities for the management and the dissemination of these data, especially those coming from archaeological sites.
1
Term introduced by the Joint Information Systems Committee (JISC), which manages research and development programs in the use of ICT in teaching, learning and research to build knowledge. Particularly, it supports a project called virtual research environments program. A VRE is an online environment dedicated to support collaboration whether in the management of a research activity; the discovery, analysis and curation of data or information; or in the communication and dissemination of research outputs.
3 Modelling of the VRE
To understand how the Web Information System that we propose has been implemented, it is interesting to present its conceptual model. The conceptualization of a system allows to understand and to structure the needs of the users, what is necessary because these needs define the outlines of the system to be modelled (to make clear the objectives to reach) and because they allow to identify the main functionalities that the system must have. In the next sections, we describe the essential steps of the modelling: the identification of the needs of the users and of the processes of the system, followed by the definition of the entities and interfaces of the VRE.
3.1 Needs of the users and processes
The modelling of an Information System is then guided by the needs of the different actors of the system. The actors are the external entities (users, files) that interact with the system. An actor can consult or modify the state of the system, and in answer to the action of the actor, the system supplies a service that corresponds to his need. For our VRE, we have identified the following actors:
files and software: system administration, application software, data, archaeological site physical users: administrator, member (user who has rights to act on the data), visitor
The physical actors are the users of the VRE, of whom we can identify and structure the needs. These needs are finally what the archaeologists can expect from a system dedicated to the online and easy management and dissemination of datasets coming from the working of archaeological sites. They make the detailed counterpart of the objectives of the VRE quoted before.
From a simple visitor (data consumer) point of view, the expectations are:
to visualize the data in different ways: in catalogs, by reaching directly the data connected, in views aggregating different attributes, from the metadata corpus, in thematic and interactive interfaces (clickable maps and models);
to do flexible search across the diverse data: by data types, by keywords or by images;
to combine elements selected in diverse graphs or models to generate visualizations in synthesis maps or 3D models, in order to see historical changes of the site;
to configure the use of the system (language...), to have access to help files, simple schemes of the VRE functioning or answers to frequently asked questions, to contact the support.
From the point of view of a site manager (data provider), the needs are:
to access the system in a secure way (login and password to be able to do modifications on the data); to administer his archaeological site: to add a site (from existing files or not), to generate standard
exchange files of the data (to collaborate with other teams for instance), to make global saving of all data files, to delete the site;
to store his data on a server (upload of images, maps, models, videos...);
to generate new interactive data from his initial 3D models or maps (process of automatic anchoring); to manage his data: addition of a data, addition of existing types of data or of new types (originals or
imported), modification of the structure of the metadata, definition of default values for the metadata, suppression of data types;
to access the data in different ways (in catalogs, by reaching directly the data connected, in views aggregating different attributes, from the metadata corpus, in thematic and interactive interfaces (clickable maps and models)), in order to edit them for update or to rename, duplicate, delete them; to do flexible search across the diverse data: by data types, by keywords or by images;
to combine elements selected in diverse graphs or models for the generation of visualizations in synthesis maps or 3D models, in order to see historical changes of the site;
to configure the use of the system (language, configuration of the pages...), to have access to help files, simple schemes of the VRE functioning or answers to frequently asked questions, to contact the support;
And finally the administrator needs to:
administer the Information System and his applications (thematic and interactive interfaces, search engines, views, etc.);
administer the server parameters and the databases; administer the rights and roles of the users.
The formulation of these needs is essential to conceive a system really dedicated to the users, in our case the archaeologists or site conservators. Indeed, they have particular expectations regarding a system for the management and the dissemination of their very specific data, and they are not necessarily experts in computing (the simplicity of use is thus very important). Moreover, from these needs ensue the processes of the VRE, i.e.
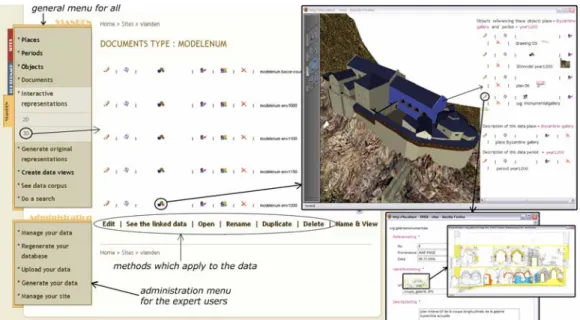
all the internal activities of the system aiming to answer the actors' needs. For instance, the process corresponding to the need "to combine elements selected in diverse graphs or models for the generation of visualizations in synthesis maps or 3D models" can be formulated as "generate representations". This process concerns the visitor as well as the member, and is put at disposal of these actors through a menu in the main interface of the VRE (see Fig. 3). The same principle has been used to offer menus (corresponding to each type of user) aiming to answer their needs. These menus (see left on the Fig. 3) have been done after having identified the entities and the interfaces that the system had to include.
3.2 Entities and interfaces
The entities of an Information System are the objects that the workers treat. The workers are those who interact, communicate and work together to execute the system processes. The entities are then considered as the diverse study classes of the VRE that permit the execution of the processes of the Information System. A class is an abstract type characterized by properties (attributes and methods) common to a set of objects. It also permits to create objects having these properties through a process named instantiation. The classes of our system have been divided in three categories:
the entities (data): place, period, document, object the internal workers: site, database
the external workers or "interface workers": user, support (administrator)
To sum up, a class is the addition of attributes, methods and instantiation. The attributes can be considered as the columns of the tables of a database or as the nodes of an XML file, they are for instance the metadata about the entities. The methods ensue from the processes of the VRE that we have identified previously; they are what the worker can do and what can be done on the entities. The example of the class "Document" with one of its sub-class "3D Model" is given in Fig. 1. A sub-sub-class extends the properties of a sub-class; it is more specific and inherits of the attributes and of the method of the class.
Figure 1. Class "Document" with one of its sub-class "3D Model".
Afterwards, the interfaces necessary to access the information managed by the VRE have been defined. They are of different types:
list (catalog of the data)
thematic (on places and periods) interactive (in 2D and 3D)
views (creation of tables views, display of data corpus) search (by data types, keywords, images)
generation (combination of elements selected in diverse graphs or models for visualizations in synthesis 2D maps or 3D models)
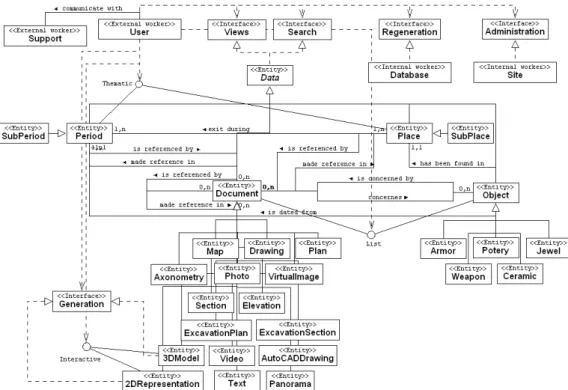
This allows representing the global diagram of the classes of the VRE, showing also these diverse interfaces (Fig. 2). This schema represents the structure of the VRE for archaeological data management that we have developed. It is flexible and allows modifications to add new functionalities in the system or to insert new classes or sub-classes of the already existing entities (for instance). As shown in this diagram, the system permits to manage very different kinds of documents and archaeological objects. The types given here are examples; we can imagine managing documents or objects of any nature. Likewise, the proposed interfaces answers the needs of the archaeologists quoted before, but they can be completed by others to offer new possibilities of visualization or communication of the data managed. These interfaces are to be seen in Fig. 3 (menus on the left).
Before ending, we will give an example of the functioning of the system in explaining the use of 3D models and 2D maps as interfaces to access the data recorded in the VRE.
Figure 2. Global structure of the Information System developed.
4 3D models as privileged interfaces to reach the data
There are several types of formats to provide 3D models on the Internet. The most used are VRML (Virtual Reality Modelling Language, the oldest), X3D (eXtensible 3D) and COLLADA (COLLAborative Design Activity). X3D is the successor to VRML, ISO standard for real-time 3D computer graphics that offers the ability to encode the 3D scenes using an XML syntax (according to the W3C recommendations). COLLADA aims to establish an interchange file format for interactive 3D applications, and defines an open standard XML schema for exchanging digital assets among various graphics software applications. For the simplicity of visualization we have created and we display our models in VRML, because the plug-in Cortona VRML Client (ParallelGraphics) is the most flexible to use (in HTML frames for instance) in comparison with those for X3D for instance. However, to obtain models compliant to the standard of the W3C, the VRML code has just to be rewritten with XML conventions and descriptive elements to convert it to X3D format (converters are available). The 3D models included in the VRE have been produced from historical documents (for the models of the past phases of the site) or from surveys (notably laser scanning). The modelling can be done in any software permitting to export in VRML or X3D (for instance Maya or SketchUp). Afterwards, processes to make these models interactive have been programmed in PHP, in order to put anchors in the models that allow to click on diverse elements to access data through an URL link. The clicked elements are highlighted thanks to scripts in JavaScript and VRMLScript with "routes", which permit for instance to change the colour of the chosen part of the model. Thus, the user can navigate freely in the model, zoom in, choose viewpoints, and so on, to see the parts in which he is interested, and in addition, he can click on a place of the modelled site, to access all the documents and objects that have been recorded in the database and that concern the place he has chosen. The queries that are achievable through the clicks on a 3D model are then spatial queries, but if we navigate in a historical model (model of the site during a given period), we will access only the data making reference both to the place chosen and to the period of the model. Spatio-temporal queries are then also available, to find specific information recorded in the VRE through the navigation in the 3D models.
Fig. 3 gives the example of a 3D model corresponding to the historical reconstruction of the Vianden castle during the 1200s. It has been done by the MAP-CRAI laboratory of Nancy (France). This model is mainly accessible through the "Open" button available on the interface. On this model, a place called "Byzantine gallery" can be seen and clicked. This example shows the possibility of a query on a combination of period and place: here, the click on the place "Byzantine gallery" on the model of the year 1200 gives only the documents referencing this place and this period simultaneously. Afterwards, these documents can be edited or manipulated. This leads to work in the direction of updating or modifying the data directly from their 3D representations.
Figure 3. Access to a 3D interactive interface allowing access to the data linked with the chosen place.
The same principle is available to access the information recorded in the VRE through 2D representations. The system allows the user to examine deeply and to interact with 2D maps generated in the format SVG, which is the XML formulation of 2D vector graphics. The possibility to create 2D interfaces is useful to complete the 3D interfaces, because often archaeologists are more used to work on 2D representations than on 3D models. Therefore the proposed VRE gives the possibility to create and to exploit both 2D interactive graphics and 3D interactive models, to permit diverse visualizations and multiple types of navigation in the information.
5 Conclusion
After having set our propositions for a system dedicated to the online management and dissemination of datasets coming from the working of archaeological sites, we have carried out the conceptual modelling of the Virtual Research Environment that we have created. This modelling allows to see in a generic way how the VRE works and how it is possible to implement it on different platforms. The essential point in this state is the listing of the needs of the different users to whom the VRE is dedicated, and the processes that we have carried out in the system to answer them. Thus, the Web Information System described in this paper allows recording, making use and representing data of any Cultural Heritage site. This VRE has been made to offer solutions to the sites managers, to avoid them to be software-driven for their conservation and communication work. The full XML choice for textual and graphical representations permits relevant interactions. The use of 2D graphics and 3D models as user-interfaces to the data permits to link purely documentary data and metadata to geometric representations. We connect very different types of data to emphasize new research possibilities and new information exchanges between diverse sites, to be able to draw conclusions by crosschecking for instance. Moreover, the data are available through the Internet what allows to work in the direction of visualizing and communicating them in an innovative and interactive way. Our final aim is to create a simple and everywhere accessible tool for all the sites managers, who wish to be able both to manage efficiently the quantity of data produced, and to represent them in order to make use of this VRE as a virtual storefront for the communication and the e-publication of their findings.
References
Doerr, M., 2003. The CIDOC CRM - An ontological approach to semantic interoperability of metadata. AI Magazine 24(3). Drap, P., Durand, A., Seinturier, J., Vannini, G. and Nucciotti,M., 2005. Full XML documentation from photogrammetric survey to 3D visualization. The case study of shawbak castle in Jordan. The ISPRS International Archives of Photogrammetry, Remote Sensing and Spatial Information Sciences XXXVI-5/C34, pp. 771–777. ISSN 1682-1750.
Ginouves, R. and Guimier-Sorbets, A.-M., 1978. La constitution des données en archéologie classique. CNRS Ed, Paris. Richards, J. D., 1998. Recent trends in computer applications in archaeology. Journal of Archaeological Research 6, pp. 331– 382. DOI 10.1023/A:1022879819064, http://dx.doi.org/10.1023/A:1022879819064.
Ryan, N. S., 1995. The excavation archive as hypertext document? Computer Applications and Quantitative Methods in Archaeology 1994, Huggett J. and Ryan N., eds., Oxford: BAR International Series 600, pp. 211–219.