HAL Id: hal-00708093
https://hal.archives-ouvertes.fr/hal-00708093
Submitted on 14 Jun 2012HAL is a multi-disciplinary open access archive for the deposit and dissemination of sci-entific research documents, whether they are pub-lished or not. The documents may come from teaching and research institutions in France or abroad, or from public or private research centers.
L’archive ouverte pluridisciplinaire HAL, est destinée au dépôt et à la diffusion de documents scientifiques de niveau recherche, publiés ou non, émanant des établissements d’enseignement et de recherche français ou étrangers, des laboratoires publics ou privés.
active natural fractures: application to the tiltmeters
installed in Sainte-Croix-aux-Mines observatory (France)
Laurent Longuevergne, Nicolas Florsch, Frédéric Boudin, Ludovic Oudin,
Christian Camerlynck
To cite this version:
Laurent Longuevergne, Nicolas Florsch, Frédéric Boudin, Ludovic Oudin, Christian Camerlynck. Tilt and strain deformation induced by hydrologically active natural fractures: application to the tiltmeters installed in Sainte-Croix-aux-Mines observatory (France). Geophysical Journal International, Oxford University Press (OUP), 2009, 178, pp.667-677. �10.1111/J.1365-246X.2009.04197.X�. �hal-00708093�
Laurent Longuevergne1 2 3, Nicolas Florsch2 4 5, Fr´ed´eric Boudin6, Ludovic Oudin2, Christian Camerlynck2
Review III, submitted to Geophysical Journal International
Abstract
We investigate the deformation induced by water pressure variations in hydrologically-active natural fractures, and recorded by tiltmeters and strainmeters. The deformation as-sociated with a single fracture is derived using finite-element modeling (FEM). A range in fracture geometries is explored, first to highlight the sensitivity of each geometrical param-eter to the deformation, and secondly to allow transfer to observation sites. Water level variations in the fracture are then derived from a hydrological model, driven by observed rainfall, and calibrated on fracture water flow measurements. The modeling results are explicitly applied to constrain the local hydrological contribution to observations with the 100-m long hydrostatic tiltmeter installed at Sainte-Croix-aux-Mines (France). Our study shows that well-founded physical modeling of local hydrological effect allows a substantial correction of records in observatories.
Keywords : Geodynamics, Geodesy, Hydrology, Fracture deformation, Finite element modeling, physical modeling
1Corresponding author, E-mail: laurent.longuevergne@upmc.fr 2UMR Sisyphe, Universit´e Pierre et Marie Curie, Paris VI, France
3Now at BEG, Jackson School of Geosciences, The University of Texas at Austin, Austin, USA 4UPMC/IRD UMMISCO UMI No. 209, Bondy, France
5Dpt. of Mathematics and Applied Mathematics, University of Cape Town , South Africa 6G´eosciences Montpellier, Universit´e de Montpellier, Montpellier, France
1
INTRODUCTION
Strainmeters and tiltmeters are instruments of special interest for various applications (e.g. see Z¨urn, 1994): measuring earth tides, monitoring active volcanic areas, looking for pre-, co- and post- seis-mic crustal deformations, checking for mine stability. One important feature is that they are also sensitive to environmental influences, especially hydrological influences that may have amplitudes ten times larger than atmospheric effects (Edge et al., 1981). Some authors (e.g. Dal Moro & Zadro, 1998) concluded that hydrological effects should be removed from the recorded deformation signals for the above geodynamic applications (see Zadro & Braitenberg, 1999, for a review on this issue). Several methods have been developed in order to model hydrological influences, using linear or non-linear models adjusted on deformation data (e.g. Wolfe et al., 1981; Yamauchi, 1987; Latynina et al., 1993; Westerhaus & Welle, 2002). Given the twofold nature of poro-elastic strain (instantaneous and time-delayed contributions) and the potential deformation induced by other hydrological units, any empirical fitting could lead to inaccurate estimation of corrections for gravity variations (Tervo et al., 2006; Longuevergne et al., 2009).
Deterministic approaches consider physical modeling of the hydrological contribution considering either individual fractures (Sun, 1969; Evans & Wyatt, 1984) or treating the subsurface as a homoge-neous porous medium (K¨umpel et al., 1999; Wang & K¨umpel, 1999). Such modeling allows to use de-formation measurements as a tool to monitor variations in water stored in hydrological units (Rerolle et al., 2006; Longuevergne et al., 2007), and provides complementary information on hydrological processes (Fabian & K¨umpel, 2003). Tiltmeters have also been used during active hydro-fracturing in order to estimate the extension of the fractured media (e.g. Jahr et al., 2006).
In this work, we focus on deformation induced by changing fluid pressure in fractures, since observatory instruments are rarely installed in porous media. Moreover, it has been concluded from the directional dependence of hydrologically-induced deformation that fractures play a dominant role for the hydrological contributions (Edge et al., 1981; Peters & Beaumont, 1981; Wolfe et al., 1981; Yamauchi, 1987). Weise et al. (1999) identified hydrological effects induced by an aquifer above the instrument installed in granite. While poroelasticity explained the amplitude of the deformation, the orientation, however, was keeping orthogonal to a system of clefts.
The present work has two complementary objectives:
1. to physically model the deformation induced by water pressure variations in hydraulically active fractures. A finite element code allows to study a range in fracture geometries. The modeling results are explicitly applied to constrain the local hydrological contribution to observations with a tiltmeter installed at Sainte-Croix-aux-Mines observatory (France).
2. to assess the potential of tiltmeters and strainmeters as tools to study fracture characteristics and water flow in naturally fractured media.
To reach these goals, a mechanical fracture model and a hydrological model for Sainte-Croix-aux-Mines are derived separately before coupling both using water height variations in the fracture as the link between both models.
2
Site description
2.1
Geological context
The mines at Sainte-Croix-aux-Mines (located in the Vosges Mountains, Eastern France, 48.27o
N, 7.24o E) form the eastern part of the most important mining works of the Vosgian massif. A
kilometric-length hydrothermal vein constitutes the target of the mining in the pre-cambrien gneiss (Fluck, 1996). It has been exploited both at the surface and on the depth since the XV Ith century
(Fluck, 1996). WilhelmStollen mine, where the tiltmeters have been installed, was dug in the early 1900s in order to reach the lead vein. The crosscut is straight and encounters orthogonally the vein 500 m after the entrance, just a few meters above the XV IIth-century galeries (see figure 1). The
superposition of galeries at different depths, and the surface position of the Pingen, indicate a mean dip of N70oE of the eastern part of the vein. However, the electrical tomography profile (see figure 3)
shows that the western part of the fracture dips vertically.
2.2
Installed tiltmeters
We set up two orthogonal 100-m base hydrostatic tiltmeters, recently developed by Boudin (2004); Bernard et al. (2004). The resolution and long term stability of these instruments are estimated to be better than 10−10 rad and 10−8 rad.year−1 respectively (see Boudin et al., 2008, for a complete
description of the tiltmeter). The instruments were installed in two orthogonal branches of the Wil-helmStollen mine. The 160-m high rock cover ensures a stable environment. Temperature variations are around10−1 oC over the year. The N37oE instrument is set up orthogonally to the exploited vein
and the N120o E instrument is along the vein (see figure 1). The silica vessels are directly lying on
surfaced gneissic rock without any intermediary in order to improve the coupling between rock and instrument.
During the first two and a half year of recording (figure 2), several lightning and associated elec-trical problems occurred causing gaps in the time series, especially on the instrument located along the vein.
A 10-minute sampling meteorological station measures rainfall, as well as air temperature, relative humidity, incident solar radiation and wind speed 50m South West from the WilhelmStollen mine entrance. From these data, potential evapotranspiration is computed using the Penmann-Montheith formulation (Penman, 1948; Montheith, 1965). Water flow out of the mine is measured daily at the outlet of WilhelmStollen mine and is representative for the integrative amount of water dropping from the fracture ceiling.
2.3
Hydrological context
Rainfall supplies the water in the subsurface fractures. Water precipitation is distributed by a soil layer on top of the hill between surface runoff, evapotranspiration and subsurface infiltration. Both surface and former underground exploitation are preferential pathways for surface water to infiltrate down to the fracture. There is no major infiltration in the crosscut.
Figure 1: Above-view of site superposed on IGN (French National Geographic Institute) map. Black lines indicate mining galeries, their entrance is indicated with arrow signs in circles (WilhelmStollen, Musloch, Saint Jean and Stimbach). Pingen stands for former surface exploitation of the vein, Heap for surface indications of unknown mining works. Long base tiltmeters are symbolized with blue lines. The red line is the electrical profile. Water flow measurements are performed at the entrance of the WilhlemStollen mine. The meteorological station is situated50 m South West from this entrance.
Jan05 Jan06 Jan07
-300 -200 -100 0 100 200 300 400 Tilt [ nrad ]
Hourly N37 tiltmeter data Daily N37 tiltmeter data Hourly N120 tiltmeter data Daily N120 tiltmeter data
N37˚E N120˚E
200 nrad.month -1
Figure 2: Two and a half years raw data. Red and blue represent decimated hourly and daily data from the N37o E instrument, orthogonal to the vein. Green and black curves represent decimated hourly
Figure 3: Calculated electrical resistivity of a384 m long pole-dipole profile and associated relative sensitivity. The geological and hydrological interpretation are superimposed.
An electrical resistivity profile (see figure 3) revealed that the top10 to 20 meter deep first layer is arena (i.e. nearly sand) covering a fractured medium. Under the assumption that the base of the arena is saturated, a lower bound of 20% is estimated for its porosity using Archies law (Archie, 1942). As a consequence, this layer behaves as a capacitive layer and may store a full water layer of a 200 mm full layer of water per meter of soil. Soil layers play the role of a low-pass filter with regard to water infiltration (see e.g. Calder et al., 1983; Wu et al., 2002; Oudin et al., 2004). Consequently, we assume a relatively long-term contribution from this local hydrological unit.
Below the capacitive aquifer lies the fractured layer (or transmissive aquifer). Wyns et al. (2004) consider metamorphic rocks unweathered about60 m below the surface. Below this depth, only main tectonic fractures remain. The electrical profile shows a twenty-meter wide altered media above the main fracture. It constitutes the main infiltration pathway to the fracture.
2.4
Temporal signature of fracture deformation
The strong positive correlation between water flow out of the mine and tilt measurements (figure 4) suggests that nearby conductive fractures are responsible for the major part of the 400 nrad recorded deformation. Indeed, the main conductive fracture is situated 13.7 m from the northern vessel (fig-ure 1).
Fractures may drain a large area and gather a substantial amount of water in a limited thickness unit. As a consequence, an influx of water at the surface could induce a quick variation in water height, and thus a quick variation in pressure. The fracture filling signature is the200 nrad.month−1apparent
-300
-200
-100
0
100
200
300
Tilt [ nrad ]
Jan05 Apr05 Jul05 Oct05 Jan06 Apr06 Jul06 Oct06 Jan07 Apr07
50
100
150
Water flow out of the mine [ m
3d -1 ]
N37˚E
Figure 4: Superposition between N37o E instrument data in red and grey with water flow out of the
mine in black on the logarithmic scale on the right.
on the N120oE instrument, quasi-parallel to the fracture. The fracture discharge occurs at longer time
scales and induces a slow exponential-like decrease towards equilibrium. While recharge is controlled by the hydraulic properties above the fracture, discharge is controlled by the hydraulic properties next to and below the fracture.
Only connected water induces pressure variations in fractures, and water has to infiltrate down to the top of the saturated part of the fracture, the base level, before generating a deformation. This base level is likely to correspond to the regional hydrostatic equilibrium level, i.e. the level of the river in the valley and its associated aquifer (−25 m with respect to the tiltmeter, i.e. −185 m with respect to the summit of the hill).
3
Deformation induced by pressure variations in hydraulically
active fractures
3.1
General considerations
The water level variations in a fracture with time cause a time-dependent modulation of the deforma-tion associated with the regional stress field (see figure 5). From a static point of view, a connected water column of heightH above a considered position is associated with an increase in normal stress on the fracture planes of σ(H) = ρwgH. Here, H, ρw, g denote respectively water height above a
considered position, density of water and mean gravity value. Thus, a variation ∆H of the height of the water column induces a supplementary stress∆σ = ρwg∆H.
Four geometrical parameters are relevant to model the deformation: 1. the water height variation in the fractures,
Static stress field
+ H
Associated deformation
Static deformation Time variable
deformation Reference state Root Base ez + g H
Figure 5: Description of superposed time-variable stress field induced by an additional water height ∆H on a connected water column. Root depth corresponds to the vertical depth of the opened fracture with respect to the instrument and base is the vertical distance between the hydrostatic equilibrium level of water and the instrument. The arrow illustrates the associated deformation of an eventual tiltmeter close to the fracture. The static parameters ”root depth” and ”base” are defined with respect to the instrument. The time-variable parameter∆H is defined with respect to ”base” level.
3. the root depth of the fracture
4. the base level of water in the fracture.
Strainmeters and tiltmeters will be differently sensitive to these four parameters. Indeed, the equivalent momentum of this additional pressure field is the most important parameter for tiltmeters, whereas the equivalent force is decisive for strainmeters.
According to the principle of Saint Venant (see Berger & Beaumont, 1976), the additional stress field of a heterogeneity modifies the initial stress field over a distance that is equivalent to the hetero-geneity characteristic length, i.e., in this case the total height of the water column of the fracture. Long base instruments act as spatial filters, so fractures that are too far away, or have a root depth shorter than the base of the instrument, do not contribute to the deformation. Only major hydraulically ac-tive fractures have a measurable effect. On the contrary, short-base instruments are more likely to be sensitive to small fractures.
Natural fractures can remain locked open, highly conductive and possess apertures of several millimeters to considerable depth (Dyke, 1995). Gentier (1986); Sausse (2002, figure 10) showed that the contact area of natural fractures could be smaller than 40% to 60% for normal stress smaller than35 MPa (i.e. approximatively at a 1500 m depth). For our modeling, we assume that the pressure is applied on the whole area of the fracture, i.e. both planes of the entire fracture are separated by a water layer that transmits the pressure. This water layer may be very thin, as in the example of Pascal’s burst barrel. Consequently, the calculated deformation is a maximum effect. Furthermore, we consider only elastic behavior.
3.2
Mechanical modeling - FEM
No analytical solution referring to the identified deformation process (both applied stress and limit conditions) has been found, so the problem will be treated by means of finite element modeling (FEM). FEM has previously provided interesting results concerning the investigation of site effects (e.g. Berger & Beaumont, 1976; Sato & Harrison, 1990), or pressure loading effects (e.g. Kroner et al., 2005; Steffen et al., 2005). However, the method encounters difficulties in practice, as mentioned by authors, due to difficulties in choosing both relevant boundary conditions and detailed local physical parameters.
FEM was performed with the Comsol Multiphysics software (Comsol, 2006, seewww.comsol.com). The modeling of the fracture deformation will be reduced to a single fracture for three reasons:
1. On the one hand, the surface deformation field is insensitive to details in the plane of the fracture (Evans, 1983),
2. On the other hand, we would like to investigate the dependence of the fracture deformation on potential instruments as a function of their relative position to the fracture.
3. Our instrument is located at a depth of160 m, below weathered rock, where only major tectonic fractures remain (Wyns et al., 2004).
3.2.1 Model set-up
The problem was reduced to 2D under the plane strain hypothesis. The domain is a rectangular trapezium with a minimum extent of30 km, in order to avoid border effects (figure 6). The diameter of the triangular mesh is3 km at the non-loaded boundaries, and the finest resolution is 1 m around the instrumented area. The size of the domain and the associated mesh were determined as the best compromise between stability and accuracy of the deformed domain and the calculation time.
Two more points were defined according to the conditions at Sainte-Croix-aux-Mines. They rep-resent the extension of a100-m long instrument (tilt or strain). They are situated 160m below ground, 13.7 m and 113.7 m away from the fracture. When the dip varies, the distance of the instruments to the fracture is kept constant. Tilts and strains are obtained by calculating the difference between the vertical and the horizontal displacements between these two points and by normalizing this difference to the length.
For simplicity reasons, the30-km thick modeled domain is considered as elastic, homogeneous and isotropic gneiss. The elastic parameters were chosen to be those of PREM, i.e. a densityρ = 2600 kg.m−3, a Young modulus equal toE = 68 109Pa and a Poisson ratioυ = 0.28, which are very close
to Gneiss values. Boundary conditions are defined as :
1. the nodes at the model bottom must not move in a vertical direction,
2. the nodes at the vertical model boundaries must not move in a horizontal direction perpendicular to the model sides,
Dip
100-m long instrument
30 km
30 km
160m
Crosscut
Figure 6: Sketch describing modeled domain and boundary conditions. The arrows correspond to the additional pressure generated by the water height variation as described in figure 5.
Table 1: Parameter space explored with finite-element modeling. Parameter Minimum value Maximum value
Root depth −3000 m −100 m
Base −30 m +10 m
Water height 0.1 m 30 m
Dip 30o 90o
3. the pressure induced by the∆H water height variation in the fracture is applied orthogonally to the fracture,ρwg∆H on the root + base part, and triangular on the ∆H part (see figure 5).
4. the other boundaries are not constrained.
Two kinds of results were obtained. General results corresponding to a profile of an eventual 1-m long instrument in the mine crosscut, and a systematic investigation of the parameter space (∆H, dip, base and root depth) for a100-m long instrument located at the site of the tiltmeter. A total number of 10000 evaluations were carried out, so a mean of 10 values were chosen within a realistic range for each variable, as described in table 1.
3.2.2 Results
The deformation induced by water height variation ∆H = 1 m in the fracture and recorded by an eventual 1-m long instrument located inside the crosscut is shown on figure 7. Tiltmeters and strain-meters provide complementary information. In the case of tiltstrain-meters, the direction of the induced tilt is generally oriented towards the fracture (positive deformation), but may also be oriented towards the other side. The zero deformation in the crosscut gives information about the dip of the fracture. In the case of strainmeters, the maximum deformation is located at a distance that is equivalent to the total height of the water column. This example shows how deformation instruments may be used as tools to better constraint the characteristics of hydraulically active fractures. Several instruments located along a profil categorize the different fracture geometries quite well.
10 0 1 2 3 4 Tilt [ nrad ] -100 0 100 200 300 400 500 600 Distance to fracture [ m ] 0 10 20 30 40 50 60 70 80 90 100 Distance to fracture [ m ] 10 10 10 10 100 10 1 102 103 104
Root -100, base -20, dip 90 Root -100, base -20, dip 70 Root -100, base 0, dip 90 Root -100, base 0, dip 70 Root -1000, base -20, dip 90 Root -1000, base -20, dip 70 Root -1000, base 0, dip 90 Root -1000, base 0, dip 70
Strain [ nstrain ]
Fracture
Figure 7: Calculated tilt and strain deformation with∆H = 1 m, and various fracture geometries for a 1-m long instrument located on the crosscut.
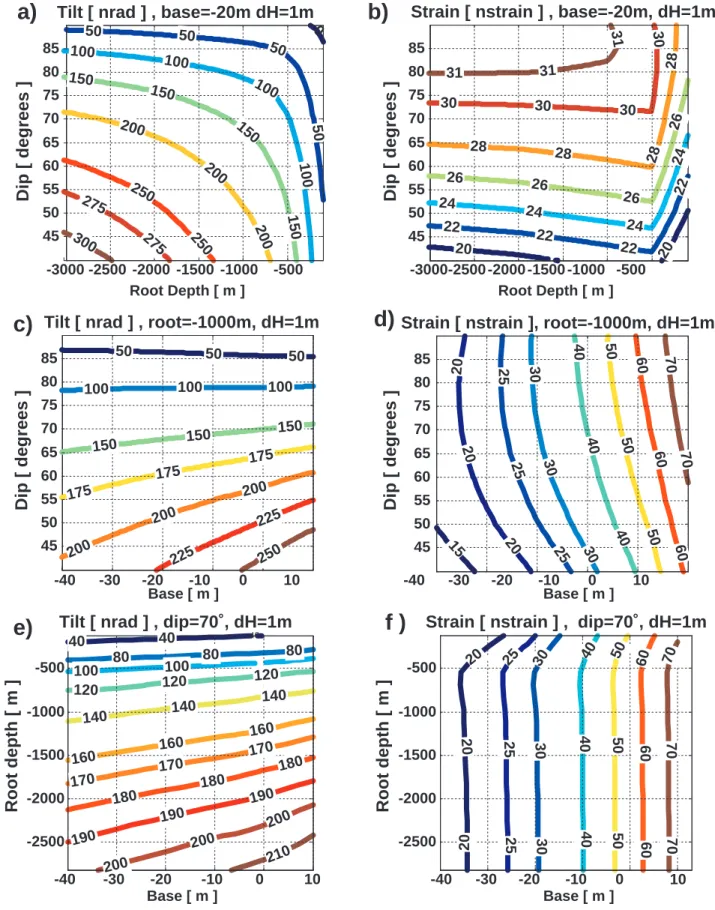
100-m long instrument located at the place of the tiltmeter is shown on figure 8. The systematic investigation of the parameter space enable to draw the following conclusions:
1. As noted previously, tilt deformation gives little information concerning the relative position of the hydrostatic level in the fracture. Tilt deformation is especially generated by the relative depth of the saturated part of the fracture with respect to the instrument. Note that dip plays an important role as well.
2. Conversely the depth of the saturated part of the fracture does not contribute to the amplitude of the strain. As expected, strain deformation is due to the proximity of the water layer, and so increases quickly as the base water level becomes more and more positive. The dip of the fracture has a minor effect on strains.
3. The induced deformation decreases when the length of the instrument becomes equivalent to the size of the additional pressure field (see figure 8, a and b cases).
4. Due to numerous equivalences between the different geometries (especially dip/root depth cou-ple for tilts, and base/∆H coucou-ple for strains, see next section), the determination of the fracture geometry using a single instrument is not possible. On the other hand, it could give realistic minimum and maximum parameter values.
5. Tiltmeters and strainmeters are complementary instruments, i.e. the use of both instruments as tools to investigate hydraulically active fractures could dispel the equivalences.
3.2.3 Linearity of deformation
The previous results were calculated for a 1-m water height variations in the fracture. The introduction of the∆H parameter is shown on figure 9. The deformation may be considered as linear towards the ∆H parameter as long as ∆H << rootdepth + base. In this case, both the application point of
Tilt [ nrad ] , root=-1000m, dH=1m
Base [ m ]
Strain [ nstrain ] , base=-20m, dH=1m
Strain [ nstrain ] , dip=70˚, dH=1m Strain [ nstrain ], root=-1000m, dH=1m Tilt [ nrad ] , base=-20m dH=1m
-3000 -2500 -2000 -1500 -1000 -500 Root Depth [ m ]
40 Tilt [ nrad ] , dip=70˚, dH=1m
Root depth [ m ] -40 -20 -10 0 10
a)
b)
c)
d)
e)
f )
Dip [ degrees ] 45 50 55 60 65 70 75 80 85 45 50 55 60 65 70 75 80 85 45 50 55 60 65 70 75 80 85 45 50 55 60 65 70 75 80 85 -2500 -2000 -1500 -1000 -500 -2500 -2000 -1500 -1000 -500 -40 -30 -20 -10 0 10 -40 -30 -20 -10 0 10 -40 -30 -20 -10 0 10 -3000-2500 -2000 -1500 -1000 -500 0 50 50 50 50 100 100 100 100 150 150 150 150 200 200 200 250 250 275 275 300 50 50 50 100 100 100 150 150 150 175 175 175 200 200 200 225 225 250 40 40 80 80 80 100 100 120 120 120 140 140 140 160 160 160 170 170 170 180 180 180 190 190 190 200 200 200 210 20 20 22 22 22 22 24 24 24 24 26 26 26 26 28 28 28 28 30 30 30 30 31 31 31 15 20 20 20 25 25 25 30 30 30 40 40 40 50 50 50 60 60 60 70 70 20 20 20 25 25 25 30 30 30 40 40 40 50 50 50 60 60 60 70 70 70 -30 Root Depth [ m ] Base [ m ] Base [ m ] Base [ m ] Dip [ degrees ] Dip [ degrees ] Dip [ degrees ] Root depth [ m ]Figure 8: Exploration of parameter space for ∆H = 1 m and a 100-m long instrument. Calculated tilt deformation with base = −20 m (a), root = −1000 m (c), dip = 70o (e). Calculated strain
0 5 10 15 20 25 30 H [ m ] Multiplicative factor Tilt 40˚ dip 90˚ dip 0 5 10 15 20 25 30 Strain Multiplicative factor 0 5 10 15 20 25 30 H [ m ] 0 5 10 15 20 25 30 - 100 m - 500 m - 1000 m - 2000 m - 3000 m - 40 m - 30 m - 20 m - 10 m 0 m a) b)
Figure 9: a) Envelop curves (classified by root depth) illustrating the linearity of tilts towards varying water height variations ∆H for a 100-m long instrument and fixed base = −20 m. b) Mean curve illustrating the linearity of strain deformation of strains towards water height variations ∆H for a 100-m long instrument and fixedroot depth = −1000 m.
the equivalent force and the application point of the equivalent momentum may be considered as unchanged. When ∆H increases, the potential non-linearity mainly depends on the depth of the saturated part of the fracture with respect to the instrument. Note that tilts keep highly sensitive to the dip of the fracture and that strains increase dramatically with∆H.
3.2.4 Effect of the instrument base-length
Several authors (e.g. D’Oreye de Lantremange & Z¨urn, 2006) consider that the amplitude of local effects is lowered when using long-base instruments. As predicted by Saint Venant’s principle, this assumption is verified when the characteristic length of the heterogeneity is smaller than the instru-ment base-length. However, this assumption may not be verified when the instruinstru-ment base-length is smaller than the heterogeneity. Figure 10 shows that, for definite fracture geometries, strains may increase when the instrument base-length is increasing. The amplitude of tilts is also increasing with the base length of the instrument when root depth is positive (not shown).
When the instrument base-length is decreasing, strains and tilts become very sensitive to the geo-metrical parameters. Thus, any local variation of these parameters may have a substantial impact on the amplitude of the recorded deformation. An accurate modeling of the deformation becomes more difficult.
4
Hydrological modeling
4.1
Determination of drained area
Hydrologists are used to work on data reduced to unit area. For the fracture, runoff measurements out of the mine Qmes in [ m3.day−1 ] are divided by the area drained by the fractureSdrained, so that
Figure 10: Modeled deformation for ∆H = 1 m and a 70o-dip fracture illustrating the effect of the
instrument base-length; a) on tilts with respect to the fracture root depth for a fixedbase = −20 m; b) on strains with respect to the hydrostatic base level forroot depth = −1000 m.
Q = Qmes/Sdrained. In this way, reduced runoffQ is a flux, comparable with rainfall measurements
and potential evapotranspiration evaluations, in [ mm.day−1].
Surface geometrical investigations allow to estimate the area drained by the fracture at 30 000 m2. This is the most likely value, but it can also be included in the [ 20 000 − 60 000 ] m2 interval depending on the fractured layer on top of the hill.
This reduced runoff will be used to calibrate the hydrological model. As a consequence, the model calculates ”reduced” hydrological water height variations in the fracture∆Hhydro. The water volume
conservation in the fracture then allows to estimate the ”mechanical” water height variation∆H that will force the FEM model :Sdrained∆Hhydro =
lengthf rac.widthf rac
sin(dip) ∆H, where dip stands for the dip of
the saturated part of the fracture,lengthf rac andwidthf rac stand respectively for the fracture length
involved in the hydrological unit, and the fracture width. widthf rac parameter corresponds to the
equivalent aperture of the fracture where the water level is varying. Note that for a definite amount of water, thinner fractures could possibly generate greater water height variations in the fractures. However, hydrologically speaking, thinner fractures are probably less conductive as well.
When calculating water height variations, drained area influences both the calculation of the total runoff Q and the calculation of the final ”mechanical” water height variation ∆H. However, as the measured total amount of water Sdrained∆Hhydro is fixed and determined, the uncertainty associated
Table 2: Observed and estimated annual amplitude of hydrological processes for a median drained surface (30 000 m2).
Process Observed annual value Estimated annual value
RainfallP 1220 mm
-Mine runoffQ 430 mm
-Deep drainageQdeep - 280 mm i.e. 0.63 Q
Potential evapotranspirationP E 680 mm
-Actual evapotranspirationAET - 510 mm
4.2
Annual mass balance and deep drainage
A main difficulty when coupling hydrology and geodesy is the need to calculate the amount of stored water, whereas hydrological tools are build up to manage fluxes (rainfall, evapotranspiration and runoff). This implies to model carefully all hydrological processes, and feed hydrological models with a data-set as realistic as possible in order to avoid compensations or cumulative errors when calculating the amount of water. Annual mass balance may help to check the realism of fluxes.
The amount of water flowing out of the fracture under study is not limited to the measured quantity Q at the outlet of the mine. Indeed, a supplementary amount of water Qdeepis drained by Musloch
mine, below WilhelmStollen mine. An estimation of the annual total runoff out of the fracture can be deduced from the Turc-Pike relationship (Turc, 1954; Pike, 1964) linking annual runoff out of a hydrological unit to annual potential evapotranspiration and annual precipitation. The annual total runoff is estimated to710 mm, so deeper drainage is calculated as Qdeep= 0.63 Q.
The annual mass balanceP = AET + Q + Qdeepalso allows to estimate actual evapotranspiration
AET = 510 mm. Note that nearly half of annual rainfall is used for evapotranspiration. Annual mass balance considerations are summarized in table 2.
4.3
Hydrological model set up
We chose to use a simple conceptual hydrological model in order to evaluate water height variations in the fracture for several reasons:
1. From a conceptual point of view, as stated by Z¨urn et al. (2007), simple models give good orders of magnitude, and contain only essential processes that allow to provide insights into hydrological processes, before using more complicated models with more parameters.
2. From a hydrological point of view, hydrological models are also subject to numerous equiv-alences between parameter sets when they are calibrated using only water flow data (what is called equifinality, see Beven & Freer, 2001). Therefore, several descriptions of internal pro-cesses are similarly efficient with respect to runoff simulations. The use of parsimonious models makes it possible to cope with over-parametrization.
Conceptual hydrological models are based on a rough simplification of the various physical pro-cesses that take place in hydrological systems (e.g. evapotranspiration, generation of water flow, ...). As a consequence, they are not built to simulate explicitly internal processes. However, they may give
substantial information: previous research showed for instance that the moisture rate of the modeled soil layer may be informative to represent the hydric state of a basin (Oudin et al., 2006). As each model is built on different assumptions, the choice of the model is decisive concerning its ability to describe an internal process.
Several models were tested in order to estimate infiltration inside the fracture, most of them taken from Chapman & Malone (2002). The concept of the IHACRES conceptual lumped model (Jakeman et al., 1990; Littlewood & Jakeman, 1994) was chosen because it represents the soil-atmosphere interface for this hydrological system better than the others. This model is available as a free software (Littlewood et al., 1997) on the internet web page of the Centre for Ecology and Hydrology (UK) http://www.ceh.ac.uk/products/software/CEHSoftware-PC-IHACRES.htm.
We use a modified version of IHACRES, called IHAC, in order to feed the model with potentiel evapotranspiration as an input variable instead of temperature data. This modified model is shown on figure 11 and has been described and used several times, e.g. by Oudin et al. (2005). This model is built with three stores modeling soil behavior (S store i.e. humidity index), quick behavior of the hydrological system (T store) and slow behavior (R store). Seven parameters are associated with these stores: X1, X6 and X7 drive the antecedent-humidity index, X2 separate the amount of water between the quick and slow stores, X3 and X4 are drainage constants for these two stores. The level variations in the slow store (R store) are used to estimate water height variations in the vein∆Hhydro.
At daily time steps, deep drainage is calculated asQdeep = 0.63 Q. The model is fitted on daily
total water flow out of the fractureQ + Qdeep. The Nash-Sutcliffe efficiency (Nash & Sutcliffe, 1970)
is 0.89 (1 indicating a perfect description of the water flow out of the mine) with an rmse error of 0.1 mm.day−1, the total amount of water being respected by less than 0.1%. The model confirms the
expected low-pass filtering behavior of soils towards infiltration: the soil layer can absorb half of the annual precipitation amount, and the calculated time delay between rainfall and runoff generation is 5 days.
The model calculates an annual water height variation ∆Hhydro = 200 mm in the slow store,
which corresponds to an equivalent∆H = 8.7 m, considering a 1-m fracture width.
5
Coupling of models and discussion
5.1
Choice of fracture parameters using annual variation
The first part of our research was devoted to gathering a-priori information to constrain the parameter values, as shown in table 3. Considering a mean dip of 70o
and a base level of −25 m, several models could explain the 400 nrad annual deformation with a medium water height variation. For example, a fracture with a root depth of 500 m and a 4 m water height variation within the year is plausible, as well as a100 m root depth and a water height variation of 16 m. In both cases, the width of the fracture must be of the order of one meter to satisfy the hydrological considerations. This is an important result since the observed deformation could be completely explained by water height variations in the Musloch gallery below the instruments.
Previous humidity index (X1, X6, X7) PE P S R T Ps Pr Qt Qr Delay X5 AET (1-X2).Pr X2.Pr X3 X3 X4 0 0,5 1 1,5 2 2,5 0 10 20 30 40 50 60 Rainfall [ mm.day -1 ]
Measured water flow Simulated water flow
Water flow [ mm.d
-1]
Oct04 Jan05 Apr05 Jul05 Oct05 Jan06 Apr06 Jul06 Oct06 Jan07Apr07 Q + Qdeep
Figure 11: Diagram of the modified IHAC lumped model based on 7 parameters (X1-X7). In red, forcing data, P E, P , Q and Qdeep stand for potential evapotranspiration, precipitation, runoff out of
the mine and deep runoff respectively. In blue, S, T, R correspond to modeled water-height in the 3 stores, respectively soil, quick and slow stores. R store level variations are used to estimate water height variations in the fracture∆Hhydro
.
Table 3: Table summing-up a-priori informative elements and main informative tools Fracture parameter A-priorielements Main informative elements
Base level geometry, regional hydrostatic
level Strainmeter
Root depth lithostatic pressure Tiltmeter
Annual water height variation geometrical considerations Annual mass balance, tiltmeter and strainmeter
Dip geology Geology and tiltmeter
Atmosphere-soil interface pedology Geophysics and hydrological model
Time varying water height
variation water flow out of the mine
Hydrological model, tiltmeter and strainmeter
Jan05 Apr05 Jul05 Oct05 Jan06 Apr06 Jul06 Oct06 Jan07 Apr07 -200 -150 -100 -50 0 50 100 150 200 250
Tilt [ nrad ]
Jan05 Apr05 Jul05 Oct05 Jan06 Apr06 Jul06 Oct06 Jan07 Apr07 0
10 20 30 40 50
Recorded tilt corrected from a-priori regional-scale contribution
Modeled deformation induced by fracture Residuals
Daily rainfall [ mm.day
-1
]
Figure 12: Tilt time series corrected from local hydrological effect using determined parameters (in blue). In red is shown the modeled deformation induced by the modeled nearby fracture. Note the3 to10 days signal is typically induced by pressure variations
.
5.2
Local hydrological contribution to tilt time series
The time variable reduced water height variation ∆Hhydrocalculated with the hydrological model is
transformed into the ”mechanical” water height variations ∆H and into tilt deformation using the fracture geometric parameters determined in the previous section. Figure 12 shows the comparison between modeled deformation induced by the fracture and the recorded signal corrected from re-gional scale surface loading (see Longuevergne et al., 2007). As stated previously, this local-scale deformation creates especially a long-term contribution to tilt deformation, except at fracture-filling periods.
Recorded tilt deformation is not corrected from deformations induced by atmospheric pressure variations. It typically induces a30 nrad signal with a 3 to 10 day period. The residuals also show a 500-day period signal yet unexplained, which could be linked to an erroneous estimation of hydrolog-ical fluxes. Longer time series and further studies on the modeling of the hydrologhydrolog-ical contribution are needed to improve the understanding of the recorded signals.
6
CONCLUSION
In this work, we addressed the deformation induced by hydrological subsurface processes to strain-meters and tiltstrain-meters at the newly installed observatory in Sainte-Croix-aux-Mines. Physical model-ing is applied to study the deformation induced by natural hydraulically-active fracture in response
to water pressure variations. The mechanical behavior of large fractures with respect to the identified deformation process is constrained using FEM modeling. A range of geometric parameters is inves-tigated to determine the parameter space and allow transfer to other observation sites. Water pressure boundary conditions are derived from a hydrological model, driven by observed rainfall and evapo-transpiration and calibrated on water flow. The coupled mechanical and hydrological modeling show a good agreement with the 100-m base hydrostatic tiltmeters observations. In particular, fracture fill-ing and slow drainage are well described. We show that an accurate estimation of the hydrological contribution cannot be reduced to the knowledge of rainfall alone, especially at annual time scales.
The deterministic approach allows to draw conclusions on two points of interest. On the one hand, our model allows a substantial correction of records in observatories to better study geodynamical signals. On the other hand, better constraints on the characteristics of fractures may be gained from using these sensitive instruments.
Finally, this work also allows to draw - more precisely confirms - general recommendations about the installation of future instruments in order to lower the amplitude of hydrologically induced fracture deformation (especially in a metamorphic context):
1. The setting-up of instruments in the weathered layer, at the soil-atmosphere interface, should be avoided. In a metamorphic context the altered layer could be 10 m to 20 m thick, and the fractured layer could be 50 m thick (Wyns et al., 2004).
2. An extremely small percentage of visible fractures may be hydrologically active. If so, it would be interesting to measure runoff in order to monitor an eventual local-scale deformation. 3. Short base instruments are more likely to be sensitive to eventual short hydraulically active
fractures than longer instruments.
4. Generally speaking, the hydrologically induced contribution cannot be avoided. This assess-ment implies that the estimation of the hydrological contribution is easier in homogeneous hydrological contexts where hydrological monitoring could be representative over large areas.
Acknowledgments:
The authors would like to thank the volunteers whose work has benefited to this project since the very beginning: Michel Kammenthaler, Thierry and Francoise Vincent for their daily care of our instruments. We greatly appreciate the suggestions from J¨org Renner as well as the review by Walter Z¨urn and another anonymous reviewer to improve the manuscript and clarify its content. The authors also thank Ray for the fine-tuning of English in this article. This study was carried out within the framework of the ECCO/INSU/ANR Project ”Hydrology and geodesy” coordinated by Nicolas Florsch and funded by the French research agency under the number ANR-05-009.
References
Archie, G. E., 1942. The electrical resistivity log as an aid in determining some reservoir characteris-tics, in Trans. Am. Inst. Mech. Eng., pp. 54–61.
Berger, J. & Beaumont, C., 1976. An analysis of tidal strain observations from the United States of America: 2. The inhomogeneous tide, Bull. Seismol. Soc. Am., 66(6), 1821–1846.
Bernard, P., Boudin, F., & Sacks, S., 2004. Continuous strain tilt monitoring on the Trizonia Island, Rift of Corinth, Greece, C.R. G´eoscience, 336, 313–323.
Beven, K. & Freer, J., 2001. Equifinality, data assimilation, and uncertainty estimation in mechanistic modelling of complex environmental systems, Journal of Hydrology, 249, 11–29.
Boudin, F., 2004. D´eveloppement et validation d’un inclinom`etre longue base de subsurface `a silice et mercure, Ph.D. thesis, Universit´e Denis Diderot.
Boudin, F., Bernard, P., Longuevergne, L., Florsch, N., Larmat, C., Courteille, C., Blum, P.-A., Vin-cent, T., & Kammentaler, M., 2008. A silica long base tiltmeter with high stability and resolution, Rev. Sci. Instrum., 79, 034502.
Calder, I., Harding, R. J., & Rosier, P. T. W., 1983. An objective assessment of soil-moisture deficit models, Journal of Hydrology, 60(1-4), 329–355.
Chapman, T. G. & Malone, R. W., 2002. Comparison of models for estimation of groundwater recharge, using data from a deep weighing lysimeter, Math. Comput. Simul., 59(1-3), 3–17.
Dal Moro, G. & Zadro, M., 1998. Subsurface deformations induced by rainfall atmospheric pressure: tilt/strain measurements in the ne italy seismic area, Earth Planetary Science Letters, 164, 193–203. D’Oreye de Lantremange, N. & Z¨urn, W., 2006. Quarter-diurnal tides observed with a long-base
water tube tiltmeter in the Grand Duchy of Luxembourg, Journal of Geodynamics, 41, 175–182. Dyke, C., 1995. How sensitive is natural permeability at depth to variation in effective stress ?, in
Proc. Int. Symp. on Fractured and Joint Rock Masses, edited by Myer, Cook, Goodman, & T. eds, pp. 81–88, Balkema, Rotterdam.
Edge, R., Baker, T., & Jeffries, G., 1981. Borehole tilt measurements: aperiodic crustal tilt in an aseismic area, Tectonophysics, 71, 97–109.
Evans, K., 1983. On the development of shallow hydraulic fractures as viewed though the surface deformation field. I. principles, J. Pet. Technol, 35, 406–410.
Evans, K. & Wyatt, F., 1984. Water table effects on the measurement of earth strain, Tectonophysics, 108, 323–337.
Fabian, M. & K¨umpel, H., 2003. Poroelasticity: observations of anomalous near surface tilt induced by groundwater pumping, Journal of hydrology, 281, 187–205.
Fluck, P., 1996. Le fabuleux r´eseau de Musloch, Pierres et Terre, 30, 53–70.
Gentier, S., 1986. Morphologie et comportement hydrom´ecanique d’une fracture naturelle dans un granite sous contrainte normale. Etude exp´erimentale et th´eorique, Ph.D. thesis, Universit´e d’Orl´eans, Orl´eans.
Jahr, T., Letz, H., & Jentzsch, G., 2006. Monitoring fluid induced deformation of the earth’s crust: a large scale experiment at the KTB location/Germany, Journal of geodynamics, 41, 190–197. Jakeman, A., Littlewood, I., & Whitehead, P., 1990. Computation of the instantaneous unit
hydro-graph and identifiable component flows with application to two small upland catchments, Journal of Hydrology, 117, 275–300.
Kroner, C., Jahr, T., Kuhlmann, S., & Fisher, K., 2005. Pressure-induced noise on horizontal seis-mometer strainmeter records evaluated by Finite Element Modelling, Geophys. J. Int., 161, 167– 178.
K¨umpel, H.-J., Grecksch, G., Lehmann, K., Rebscher, D., & Schulze, K., 1999. Studies of in situ pore pressure fluctuations at various scales, Oil and Gas Science and Technology Review IFP, 54, 679–688.
Latynina, L., Abashizde, V., Kapanadze, A., & Karmaleeva, P., 1993. Deformation observations in epicentral areas, Fizika Zemli, 3, 7884.
Littlewood, I. & Jakeman, A., 1994. A new method of rainfall-runoff modelling and its applications in catchment hydrology, in Environmental Modelling, edited by P. Z. (Ed.), pp. 143–171, Compu-tational Mechanics Publications, Southampton.
Littlewood, I., Down, K., Parker, J., & Post, D., 1997. The PC version of IHACRES for catchment-scale rainfall-streamflow modelling. Version 1.0. User Guide, Institute of Hydrology.
Longuevergne, L., Boudin, F., Boy, J., Oudin, L., & Florsch, N., 2007. Physical modelling to remove hydrological effects at local and regional scale: application the 100-m hydrostatic inclinometer in sainte-croix-aux-mines (vosges mountains, france), in Proceedings of the XXIVth IUGG General Assembly, Springer.
Longuevergne, L., Boy, J., Florsch, N., Viville, D., Ferhat, G., Ulrich, P., Luck, B., & Hinderer, J., 2009. Local and global hydrological contributions to gravity variations observed in strasbourg, Journal of Geodynamics, accepted.
Montheith, J., 1965. Evapotranspiration and the environment the state and movement of water in living organisms, in XIXth symposium of the Society of Experimental Biologists, pp. 205–234, Cambridge University Press, Swansea.
Nash, J. E. & Sutcliffe, J. V., 1970. River flow forecasting through conceptual models, 1, a discussion of principles, Journal of Hydrology, 10, 282–290.
Oudin, L., Andr´eassian, V., Perrin, C., & Anctil, F., 2004. Locating the sources of low-pass behavior within rainfall-runoff models, Water Resour. Res., 40, W11101.
Oudin, L., Michel, C., & Anctil, F., 2005. Which potential evapotranspiration input for a lumped rainfall-runoff model? - part 1 - can rainfall-runoff models effectively handle detailed potential evapotranspiration inputs?, Journal of Hydrology, 303(1-4), 275–289.
Oudin, L., Andr´eassian, V., Mathevet, T., Perrin, C., & Michel, C., 2006. Dynamic averaging of rainfall-runoff model simulations from complementary model parameterizations, Water Resour. Res., 42, W07410.
Penman, H., 1948. Natural evaporation from open water, bare soil and grass, in Proceedings of the Royal Society of London, vol. 193, pp. 120–148, London.
Peters, J. & Beaumont, C., 1981. Preliminary results from a new borehole tiltmeter at Charlevoix, Qu´ebec, in Proceedings of the Ninth International Symposium on Earth Tides, pp. 69–71, New York city.
Pike, J. G., 1964. The estimation of annual runoff from metrological data in tropical climate, Journal of Hydrology, 2, 116123.
Rerolle, T., Florsch, N., Llubes, M., Boudin, F., & Longuevergne, L., 2006. L’inclinom´etrie, un nouvel outil pour le suivi temporel des aquif`eres? inclinometry, a new tool for the monitoring of aquifers?, C.R. G´eosciences, 338, 775–786.
Sato, T. & Harrison, J., 1990. Local effects on tidal strain measurements at Esashi, Japan, Geophysical Journal International, 102(3), 513–526.
Sausse, J., 2002. Hydromechanical properties and alteration of natural fracture surfaces in the Soultz granite (Bas-Rhin, France), Tectonophysics, 348, 169–185.
Steffen, H., Kuhlmann, S., Jahr, T., & Kroner, C., 2005. Numerical modelling of the barometric pressure-induced noise in horizontal components for observatories Moxa and Schiltach, Journal of Geodynamics, 41, 242–252.
Sun, R., 1969. Theorical size of hydraulically induced horizontal fracture and corresponding surface uplift in an idealized medium, J. Geophys. Res., 74, 5995–6009.
Tervo, M., Virtanen, H., & Bilker-Koivula, M., 2006. Environmental loading effects on GPS time series, Bull. d’Inf. Mar´ees Terr., 142, 11407–11416.
Turc, L., 1954. Le bilan deau des sols: relation entre les pr´ecipitations, l’´evapotranspiration et l’´ecoulement, Annales agronomiques, S´erie A(491595).
Wang, R. & K¨umpel, H., 1999. Poroelasticity: efficient modeling of strongly coupled, slow deforma-tion processes in a multilayered halfspace, Geophysics, 68(2), 705–717.
Weise, A., Jentzsch, G., Kiviniemi, A., & K¨a¨ari¨ainen, J., 1999. Comparison of long-period tilt mea-surements: results from the two clinometric stations Metshovi and Lohja, Finland, Journal of geo-dynamics, 27, 237–257.
Westerhaus, M. & Welle, W., 2002. Environmental effects on tilt measurements at Merapi volcano, BIM, 137, 10917–10926.
Wolfe, J., Berg, E., & Sutton, G., 1981. The change in strain comes mainly from the rain: Kipapa, oahu, Bull. Seismol. Soc. Am., 71, 1625–1635.
Wu, W., Geller, M., & Dickinson, R., 2002. The response of soil moisture to long-term variability of precipitation, Journal of Hydrometeorology, 3, 604613.
Wyns, R., Baltassat, J., Lachassagne, P., Legtchenko, A., & Vairon, A., 2004. Application of pro-ton magnetic resonance soundings to groundwater reserves mapping in weathered basement rocks (brittany, france), Bull. Soc. g´eol. Fr, 175, 21–34.
Yamauchi, T., 1987. Anomalous strain response to rainfall in relation to earthquake occurence in the Tokai area, Japan, Journal of Physics of the Earth, 35, 19–36.
Zadro, M. & Braitenberg, C., 1999. Measurements interpretations of tilt-strain gauges in seismically active areas, Earth-Science Reviews, 47, 151–187.
Z¨urn, W., 1994. Local observation and interpretation of geodynamic phenomena, in Acta Geod. Geoph. Hung., vol. 29, pp. 339–362.
Z¨urn, W., Exss, J., Steffen, H., Kroner, C., Jahr, T., & Westerhaus, M., 2007. On the reduction of long period horizontal seismic noise using local barometric pressure, Geophys. J. Int., 171, 780–796.