RESEARCH OUTPUTS / RÉSULTATS DE RECHERCHE
Author(s) - Auteur(s) :
Publication date - Date de publication :
Permanent link - Permalien :
Rights / License - Licence de droit d’auteur :
Institutional Repository - Research Portal
Dépôt Institutionnel - Portail de la Recherche
researchportal.unamur.be
University of Namur
A century of temporal stability of genetic diversity in wild bumblebees
Maebe, Kevin; Meeus, Ivan; Vray, Sarah; Claeys, Thomas; Dekoninck, Wouter; Boevé,
Jean-Luc; Rasmont, Pierre; Smagghe, Guy
Published in:
Scientific Reports
Publication date:
2016
Document Version
Publisher's PDF, also known as Version of record
Link to publication
Citation for pulished version (HARVARD):
Maebe, K, Meeus, I, Vray, S, Claeys, T, Dekoninck, W, Boevé, J-L, Rasmont, P & Smagghe, G 2016, 'A century
of temporal stability of genetic diversity in wild bumblebees', Scientific Reports, vol. 6, 38289.
General rights
Copyright and moral rights for the publications made accessible in the public portal are retained by the authors and/or other copyright owners and it is a condition of accessing publications that users recognise and abide by the legal requirements associated with these rights. • Users may download and print one copy of any publication from the public portal for the purpose of private study or research. • You may not further distribute the material or use it for any profit-making activity or commercial gain
• You may freely distribute the URL identifying the publication in the public portal ?
Take down policy
If you believe that this document breaches copyright please contact us providing details, and we will remove access to the work immediately and investigate your claim.
A century of temporal stability
of genetic diversity in wild
bumblebees
Kevin Maebe
1, Ivan Meeus
1, Sarah Vray
2,3, Thomas Claeys
1, Wouter Dekoninck
4,
Jean-Luc Boevé
4, Pierre Rasmont
2& Guy Smagghe
1Since the 1950s, bumblebee (Bombus) species are showing a clear decline worldwide. Although many plausible drivers have been hypothesized, the cause(s) of this phenomenon remain debated. Here, genetic diversity in recent versus historical populations of bumblebee species was investigated by selecting four currently restricted and four currently widespread species. Specimens from five locations in Belgium were genotyped at 16 microsatellite loci, comparing historical specimens (1913–1915) with recent ones (2013–2015). Surprisingly, our results showed temporal stability of genetic diversity in the restricted species. Furthermore, both historical and recent populations of restricted species showed a significantly lower genetic diversity than found in populations of co-occurring widespread species. The difference in genetic diversity between species was thus already present before the alleged recent drivers of bumblebee decline could have acted (from the 1950’s). These results suggest that the alleged drivers are not directly linked with the genetic variation of currently declining bumblebee populations. A future sampling in the entire distribution range of these species will infer if the observed link between low genetic diversity and population distribution on the Belgium scale correlates with species decline on a global scale.
One of the important variables in evolutionary biology and population genetics is the effective population size (Ne)1. Ne is the size of an ideal population which has the same genetic diversity as the actual population of
inter-est2. Due to violations of the ideal scenario (e.g. all specimens should have equal reproduction and survival
prob-abilities), wild populations usually depart from Ne which is generally smaller than the corresponding census
population size (Nc)2. Although many factors are linked with population viability, by estimating Ne one can
deter-mine the viability of a population (e.g. ref. 3) and in turn the conservation status of this population or species1.
The most important conservation consequence of a decrease in Ne is that it will result in a loss of genetic
diversity2,4–6. The presence of sufficient genetic variation is crucial for the persistence of populations, as the loss
of genetic variation will lead to a lower adaptive ability in response to current and future changes in the environ-ment, such as new pathogens, climate change and habitat loss, and can ultimately lead to extinction4–6. On a short
term, populations with a low Ne, are more vulnerable to random processes, such as genetic drift (e.g. refs 4–6).
The higher effects of drift within small populations cause a (further) decrease in genetic variation. In turn, the chance of inbreeding will increase, and can lead to a decreased fitness due to inbreeding depression (e.g. refs 4–6). In social insects such as bumblebees, Ne will be very low in relation to the observed number of specimens, as
most bumblebee species are monoandrous and their colonies consist mostly out of only one founder queen (e.g. refs 7–9).
Currently, several methods are described to estimate Ne in natural populations. In general, temporal studies, which
estimate Ne by examining allele frequency changes over time, showed the best results (reviewed by refs 6,10–12).
Although favourable, these approaches will be limited to only a few organisms as it requires time series, i.e. the availability of multiple specimens from populations sampled at two or more points in time (as reviewed by Habel et al.6). Although challenging, temporal sampling methods were already successfully applied to estimate
Ne in natural populations (reviewed in ref. 6). In this manner several studies demonstrated a decrease of genetic
1Department of Crop Protection, Faculty of Bioscience Engineering, Ghent University, Coupure links 653,
B-9000, Ghent, Belgium. 2Laboratoire de Zoologie, University of Mons, Place du Parc 20, B-7000 Mons, Belgium. 3Department of Geography, University of Namur, Rue de Bruxelles 61, B-5000 Namur, Belgium. 4Royal Belgian
Institute of Natural Sciences, Vautierstraat 29, B-1000 Brussels, Belgium. Correspondence and requests for materials should be addressed to K.M. (email: [email protected]) or G.S. (email: [email protected])
Received: 16 August 2016 Accepted: 07 November 2016 Published: 05 December 2016
diversity or an increase in genetic differentiation (e.g. refs 6,13,14). For instance, Athrey et al.15 compared
his-torical and recent populations of the endangered golden-cheeked warbler (Dendroica chrysoparia) to assess the impact of demographic changes. Over a period of 100 years, genetic diversity decreased, while genetic differen-tiation increased. In contrast, other studies clearly showed temporal stability of population structures16–18. The
absence of significant shifts over time could be attributed to past population dynamics which has a direct impact on genetic drift and gene flow.
In bumblebee species, which are all essential pollinators in natural and managed ecosystems (e.g. refs 9,19), new data has recently raised the debate whether the population structure remained temporally stable or whether shifts in genetic diversity occurred during recent times20,21. Many bumblebee species show major population
declines in different parts of the world (e.g. refs 22–24). Specifically in Europe, 24% of the 68 European bumble-bee species are threatened with extinction. More generally, bumblebumble-bee populations tend to decline (46%), remain stable (29%) or increase (13%)25,26. In populations of the restricted and currently declining bumblebee species,
a lower genetic diversity than contemporary widespread and stable bumblebee species was observed20,21,27. So it
remained unclear whether this difference is caused by the decrease in population size or whether it is an intrin-sic characteristic of the currently declining species20,21,27. The generally accepted hypothesis says that the lower
genetic diversity in the declining species is due to a reduction of genetic diversity caused by the drivers of bee decline (e.g. refs 27,28). This decline is possibly due to, or at least influenced, by (a combination of) the following drivers: pathogen infection and/or spill-over from domesticated pollinators, use of pesticides, food depletion, climate change, and landscape modifications (e.g. refs 29–31). Although land cover changed substantially during the last three millennia due to anthropogenic activity32, the increasing loss of habitats and forage resources due
to the agricultural intensification, is thought to be the key driver of the observed bumblebee decline in Europe which started around the 1950s24,30,33.
Due to the impact of these drivers, the effective population size of restricted bumblebee species may decrease. Genetic drift (e.g. for changes of allele frequency in a population due to random sampling of organisms) may lead to a decrease of genetic variation within a population4,5. This stochastic loss of alleles will be more pronounced in
small populations4,5, and if the population is isolated this effect may be less buffered by dispersal. This difference
in vulnerability towards the impact of genetic drift will be reflected in the observed level of genetic variation, with lower and decreased levels within the populations of the restricted bumblebee species. However, this hypothesis is solely based on recent contemporary samples22,27,28. In contrast, studies using only historical specimens revealed
similar differences in genetic diversities between declining and stable bumblebee species in North-America20
and Europe21, which suggests that no recent major reduction in genetic diversity occurred20,21. In an
alterna-tive hypothesis, populations of restricted bumblebee species have already a lower genetic diversity due to past population dynamics. These species may maintain the lower level of genetic diversity in their populations by (i) receiving enough dispersing specimens from neighboring subpopulations to counter the effects of drift, and/or (ii) as their populations may always been small, most of their genetic variation may already be removed due to selection and drift. The latter suggests that a further decrease of genetic variation will become difficult to notice over short time periods. Testing which hypothesis is causing the observed lower genetic variation in the restricted and declining species is necessary to improve conservation strategies and secure the pollination services of wild bumblebees5,27. Indeed, lower genetic diversity will predispose these populations to have a more limited ability to
adapt to the changing environment4,5. For instance, genetically pauperized bumblebees are more susceptible to
diseases. Research performed by Whitehorn et al.34 in the UK showed that populations of the large carder bee or
moss carder bee (B. muscorum) with a lower level of heterozygosity showed a higher prevalence of the gut parasite
Crithidia bombi. The same negatively correlated interaction between parasite prevalence and genetic diversity
was found for the parasitic mite Locustacarus buchneri in B. muscorum but not in B. jonellus35. Furthermore, in
North-America, researchers found also a link between the level of genetic diversity and an increased vulnerability to the pathogen Nosema bombi22.
In this study, we compared two groups of bumblebee species, those currently widespread and found in dif-ferent parts of Belgium versus those currently restricted and limited to specific localities, to investigate whether a reduction in genetic diversity has occurred over time. More specifically, we compared the genetic diversity of eight bumblebee species before and after the general bee decline that started in Europe around the 1950s35,36.
Pin-mounted museum specimens from 100 years ago (1913–1915) were compared to specimens collected recently (2013–2015), both sets originating from the same five locations in Belgium. As pollinator regression is intensively described in Belgium and concerns bumblebees36 but also other wild bees37,38, hoverflies and
but-terflies36, this country was chosen as our main study area. Among the eight chosen bumblebee species, four are
currently restricted (B. ruderarius, B. sylvarum, B. humilis and B. soroeensis) and four are currently widespread (B. pascuorum, B. hortorum, B. pratorum and B. lapidarius) in Belgium. For each location and species, samples were genotyped with microsatellite DNA markers. Here, we hypothesize that (i) widespread bumblebee species have larger effective population sizes than sympatric restricted bumblebee species; (ii) genetic diversity in the potentially smaller populations of restricted species will decrease over time by the influence of genetic drift.
Results
Data analysis.
Each of the 16 microsatellites amplified successfully in each Bombus species. Genotype repli-cations for all loci were consistent, with a correct repetition of 99.71%. Based on our exclusion step of maximum 6 loci of missing values allowed within the genotype profile of a single specimen, 85 specimens were excluded from all further analyses for the historical data, and 11 for the recent ones (Table 1). Furthermore, an extra 114 and 86 specimens were removed as Colony 2.0 and Kinalyzer analyses identified them as being full-sibs within a population. Indeed, when these analyses detected a full-sib pair within one population (specimens from the same location and time period), only one random selected specimen per sibship was kept for further analysis (Table 1). After these two exclusions steps, 357 out of 566 historical and 436 out of 533 recent specimens remained in ourdataset, which we used to estimate the different genetic parameters of all populations of each species (Table 1). In addition, our analyses detected no significant linkage disequilibrium between microsatellites, but found signifi-cant deviations of HW for some loci in the populations of each species. Although this difference may be due to the presence of null alleles, our analysis performed with MICROCHECKER 2.2.3 revealed only very low frequencies of null alleles (< 5%) in these involved microsatellite loci.
Estimation of genetic diversity.
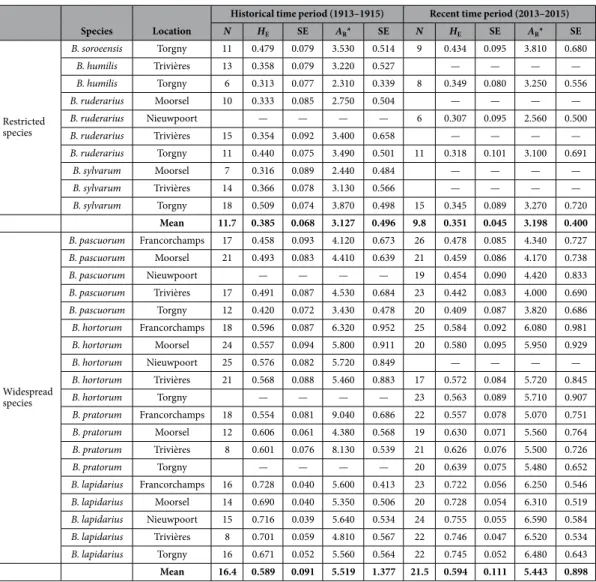
For all Bombus species, the genetic diversity of all populations was esti-mated in the two time periods (1913–1915 and 2013–2015). Within the recent populations of the widespreadBombus species, the genetic diversity parameters (AR and HE) were high, ranging from 3.820 to 6.590 and from
0.409 to 0.755, respectively (Table 2). The observed level of genetic diversity within the populations of the restricted bumblebee species was lower than within the populations of the widespread species ranging from 2.560 to 3.810 and from 0.307 to 0.434 (AR and HE, respectively; Fig. 1).
Within the historical bumblebee populations, we found a similar result, with AR and HE for the widespread
Bombus species ranging from 3.430 to 9.040 and from 0.420 to 0.728, and a lower genetic diversity within the
populations of the restricted species ranging from 2.240 to 3.870 and from 0.313 to 0.509 (AR and HE respectively;
Table 2 and Fig. 1).
Genetic diversity in restricted versus widespread species.
After running the LMM, we found no decrease of HE over time. Indeed, the factor ‘“period” was not present in the best models (delta > 2; Table 3).Therefore, HE remained stable over time for the restricted species with 0.385 versus 0.351 (mean HE in 1913–1915
and 2013–2015, respectively) and for the widespread species with 0.589 versus 0.594 (mean HE in 1913–1915 and
2013–2015, respectively; Table 2). Although, mean AR remained fairly stable for the restricted species from 3.127
to 3.198 and for the widespread species with 5.519 versus 5.443 (mean AR and HE in 1913–1915 and 2013–2015,
respectively; Table 2), time period was included in the best LMM models for AR (delta = 0.000, Table 3). However,
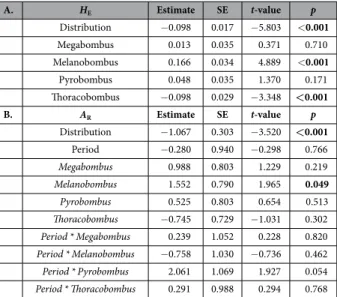
the effect of time period was not significant (LMM, P = 0.758, Table 4), neither with the interaction of “distri-bution” and the different “subgenera” (LMM, P = 0.910, and P = 0.088–0.802, respectively; Table 4). In general, these results show that the historical and recent genetic diversity within the populations of the restricted and widespread species did not decrease over 100 years; at least not in a consistent manner.
The models (delta < 2) fitting the observed pattern of the genetic diversity variable HE best were the model
with species “distribution” and “subgenera” as fixed factors and with or without the interaction between “distri-bution” and “subgenera”. The model (M12) was the best fitting model (delta = 0.000) and had the highest weight (0.632; Table 3). For the variable AR, the models with species “distribution”, “period” and “subgenera” as separate
main fixed factors and with or without the interaction between “distribution” and “subgenera” and between “sub-genera” and “period” had the lowest delta AIC score (Table 3). Although model (M12) showed a similar signif-icant result for AR (delta = 0.648, weight = 0.181; Table 3), the models including “period”, with or without the
interaction of “period” with “subgenera”, were always better fitting the data (for both M40 and M48, delta = 0.000 and weight = 0.250, respectively; Table 3). Therefore, model M12 and model M48 were selected and performed as best fitting models for HE and AR, respectively (Tables 3 and 4).
Species distribution was significantly explaining the observed pattern of HE (LMM, t-test, t = − 5.803,
p < 0.001) and AR (LMM, t-test, t = − 3.520, p < 0.001) (Table 4), which means that the widespread bumblebee
species had a higher genetic diversity than the restricted species, within and between both time periods. For both parameters, species subgenera had also a significantly effect on the observed pattern of genetic diversity. Indeed, compared with the other subgenera, the species of the subgenera Melanobombus had a higher AR and HE (LMM,
t-test, t = 4.889, p < 0.001; t = 1.965, p < 0.049; respectively; Table 4) and in Thoracobombus a lower HE (LMM,
t-test, t = − 3.348, p < 0.001; Table 4).
Effective population size estimation.
The effective size of each population, with data from two time points available, were measured with MLNe (Table 5). Within one species our estimations of Ne varied remarkablydepending on the population. Although this complexes the comparison of Ne between species, we can clearly
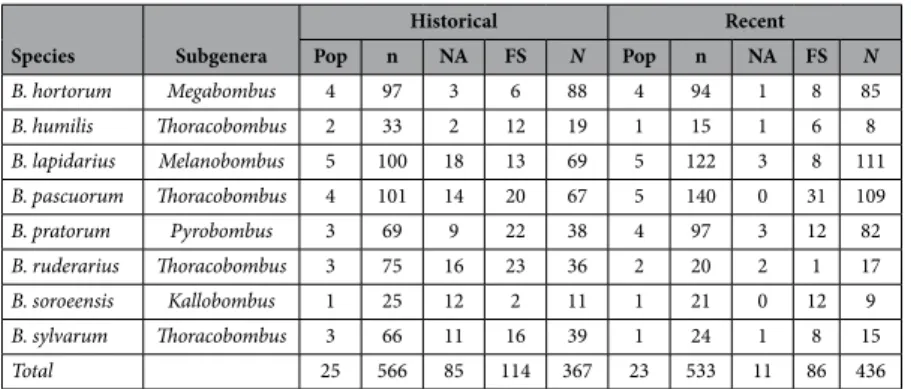
Species Subgenera Historical Recent Pop n NA FS N Pop n NA FS N B. hortorum Megabombus 4 97 3 6 88 4 94 1 8 85 B. humilis Thoracobombus 2 33 2 12 19 1 15 1 6 8 B. lapidarius Melanobombus 5 100 18 13 69 5 122 3 8 111 B. pascuorum Thoracobombus 4 101 14 20 67 5 140 0 31 109 B. pratorum Pyrobombus 3 69 9 22 38 4 97 3 12 82 B. ruderarius Thoracobombus 3 75 16 23 36 2 20 2 1 17 B. soroeensis Kallobombus 1 25 12 2 11 1 21 0 12 9 B. sylvarum Thoracobombus 3 66 11 16 39 1 24 1 8 15 Total 25 566 85 114 367 23 533 11 86 436
Table 1. Number of specimens genotyped in the analysis categorized per Bombus species. With indication
of their division in Bombus subgenera, and with pop = the number of populations sampled, n = the total number of specimens genotyped, NA = the number of specimens that were not amplifiable, FS = the number of detected and removed full sibs, and N = the final number of workers used in all further analyses.
distinguish the lower Ne in the populations of B. sylvarum and B. soroeensis (Ne = 160.6 and Ne = 239.0,
respec-tively) in comparison with the Ne within the populations of all stable bumblebee species (Table 5). Furthermore,
the estimates also showed large population sizes for B. hortorum (Table 5). B. pascuorum, B. pratorum and
B. lapidarius showed similar values in Ne as those observed in B. ruderarius and B. humilis populations (Table 5),
although the B. pascuorum population of Torgny showed a very low Ne (Ne = 219.0) comparable with the Ne
observed in the populations of B. sylvarum, B. soroeensis, and B. ruderarius in Torgny.
Discussion
Lower genetic diversity in restricted species.
Hundred years ago, and still today, restricted bumblebee species compared to widespread species had, and have, a significantly lower genetic diversity (Fig. 1). This result confirms those on the difference in level of genetic diversity between declined and more stable bumblebee spe-cies in The Netherlands by using only historical bumblebee specimens21. Hence, the here unique experimentalsetup of comparing recent with historical genetic diversity of different bumblebee species coming from the same locations in Belgium enabled us to show, moreover, that the levels of genetic diversity remained fairly stable over time in the studied populations. Indeed, in general, no major reduction in genetic diversity is observed over time. These results do not support the hypothesis based on solely recent specimens, which explains the difference in genetic variation between stable and declining species by a reduction of genetic diversity due to population declines in response to environmental drivers which acted around 1950 (e.g. refs 27,28). The present results rather corroborate the hypothesis that for some species (here, the restricted species) the levels of genetic diversity were already low at the beginning of the 20th century, thus well before the 1950s when the agricultural revolution
started with a massive use of pesticides and fertilizers. Although our results clearly support the latter hypothesis, we do not rule out the possibility that a small reduction in genetic diversity has occurred during the last 100 years. A possible and small reduction in genetic diversity may be undetectable due to the lack of statistical power and the rather small sampling sizes within the experimental setup of our study. Although we admit that an increase in
Species Location
Historical time period (1913–1915) Recent time period (2013–2015)
N HE SE AR* SE N HE SE AR* SE Restricted species B. soroeensis Torgny 11 0.479 0.079 3.530 0.514 9 0.434 0.095 3.810 0.680 B. humilis Trivières 13 0.358 0.079 3.220 0.527 — — — — B. humilis Torgny 6 0.313 0.077 2.310 0.339 8 0.349 0.080 3.250 0.556 B. ruderarius Moorsel 10 0.333 0.085 2.750 0.504 — — — — B. ruderarius Nieuwpoort — — — — 6 0.307 0.095 2.560 0.500 B. ruderarius Trivières 15 0.354 0.092 3.400 0.658 — — — — B. ruderarius Torgny 11 0.440 0.075 3.490 0.501 11 0.318 0.101 3.100 0.691 B. sylvarum Moorsel 7 0.316 0.089 2.440 0.484 — — — — B. sylvarum Trivières 14 0.366 0.078 3.130 0.566 — — — — B. sylvarum Torgny 18 0.509 0.074 3.870 0.498 15 0.345 0.089 3.270 0.720 Mean 11.7 0.385 0.068 3.127 0.496 9.8 0.351 0.045 3.198 0.400 Widespread species B. pascuorum Francorchamps 17 0.458 0.093 4.120 0.673 26 0.478 0.085 4.340 0.727 B. pascuorum Moorsel 21 0.493 0.083 4.410 0.639 21 0.459 0.086 4.170 0.738 B. pascuorum Nieuwpoort — — — — 19 0.454 0.090 4.420 0.833 B. pascuorum Trivières 17 0.491 0.087 4.530 0.684 23 0.442 0.083 4.000 0.690 B. pascuorum Torgny 12 0.420 0.072 3.430 0.478 20 0.409 0.087 3.820 0.686 B. hortorum Francorchamps 18 0.596 0.087 6.320 0.952 25 0.584 0.092 6.080 0.981 B. hortorum Moorsel 24 0.557 0.094 5.800 0.911 20 0.580 0.095 5.950 0.929 B. hortorum Nieuwpoort 25 0.576 0.082 5.720 0.849 — — — — B. hortorum Trivières 21 0.568 0.088 5.460 0.883 17 0.572 0.084 5.720 0.845 B. hortorum Torgny — — — — 23 0.563 0.089 5.710 0.907 B. pratorum Francorchamps 18 0.554 0.081 9.040 0.686 22 0.557 0.078 5.070 0.751 B. pratorum Moorsel 12 0.606 0.061 4.380 0.568 19 0.630 0.071 5.560 0.764 B. pratorum Trivières 8 0.601 0.076 8.130 0.539 21 0.626 0.076 5.500 0.726 B. pratorum Torgny — — — — 20 0.639 0.075 5.480 0.652 B. lapidarius Francorchamps 16 0.728 0.040 5.600 0.413 23 0.722 0.056 6.250 0.546 B. lapidarius Moorsel 14 0.690 0.040 5.350 0.506 20 0.728 0.054 6.310 0.519 B. lapidarius Nieuwpoort 15 0.716 0.039 5.640 0.534 24 0.755 0.055 6.590 0.584 B. lapidarius Trivières 8 0.701 0.059 4.810 0.567 22 0.746 0.047 6.520 0.534 B. lapidarius Torgny 16 0.671 0.052 5.560 0.564 22 0.745 0.052 6.480 0.643 Mean 16.4 0.589 0.091 5.519 1.377 21.5 0.594 0.111 5.443 0.898
Table 2. Comparison of the genetic diversity within historical and recent populations of Bombus species.
For each population the mean values (and SE) of the expected heterozygosity (HE) and the allelic richness (AR)
over all microsatellite loci are given. Furthermore, species are grouped based on their distribution in Belgium. With N = the number of populations of each species. *Allelic richness calculated based on 10 diploid specimens.
sample size would be preferable to strengthen the power of the results in our study, the potential reduction would be much smaller than the here observed difference between restricted and widespread species. Furthermore, we provide here the best possible sampling and setup considering the possible difficulties when using and genotyping historical old museum and collection material. Hence, a tendency towards a small decrease in genetic diversity over time can be seen for the restricted bumblebee species, B. ruderarius and B. soroeensis (Fig. 1). However, this reduction is too small to explain the observed difference between the restricted and widespread species.
Change of genetic diversity over time.
Our results are indicative for a temporal stability of genetic diversity within the studied populations of the restricted bumblebee species. A comparable example of tempo-ral stability of genetic diversity is shown in Danish populations of the large blue butterfly (Maculinea arion)39.Although declined the population showed no shift in genetic variation over 77 years. The authors mentioned several possible hypotheses to explain this result: i) the population decline was not strong enough to cause a reduction of genetic diversity; ii) the butterfly might decline as it relies on a host ant species, Myrmica sabuleti, which experiences a decline, while the butterfly’s genetic diversity is maintained by gene flow or dispersal; iii) too low statistical power in the analysis of genetic diversity due to insufficient historical sampling, or iv) the historical populations were already genetically impoverished before the start of their study. The latter explanation turned out to be the most likely one with a lower genetic variation due to long-term isolation from nearby populations39.
Here, we can formulate some similar explanations. Although we cannot totally exclude the possibility that the population decline was not severe enough to cause a reduction of genetic diversity in bumblebee species, this seems less possible, considering the major population declines observed for most bumblebee species24,30,33. As
described above, the low statistical power due to insufficient historical sampling may be another possibility here. Especially, if one takes into account that all comparisons between historical and recent genetic diversity levels in the restricted species were assessed from one location (Torgny; Table 2). Finally, the absence of recent specimens at the other locations for these species is already indicative of their population decline, and may also represent a non-measurable loss of genetic diversity at these locations.
Although no significant reduction of genetic diversity is detected, a significant increase of genetic diversity over time was observed for the widespread species B. lapidarius (subgenera Melanobombus; Table 5 and Fig. 1). A possible explanation of this observed effect is an increase in effective population sizes and/or a higher level of gene flow by dispersal between populations in this species.
Other possible causes of the lower genetic diversity in the restricted bumblebee species.
The question about genetic reduction now somewhat shifts. If it did not occur over the last 100 years, did it occur earlier? The low genetic profile within the historical populations of the restricted species was perhaps already altered due to genetic bottlenecks occurring even before the beginning of the 20th century. In Europe, land coveruse changed substantially due to anthropogenic activity, such as a large scale deforestation during the Industrial Revolution (ca. 1790–1900)32 which may have caused earlier bumblebee declines. In turn, most of the genetic
variation could be already removed from their populations, with only the necessary adaptive genetic variation remaining40. The detection of an additional reduction, within the 100 years of our study, would thus become even
more difficult to detect. Although having low levels of genetic variation, without a strong (new) external pressure on the environment, these populations would not be heavily affected40. However, once the possible drivers of bee
decline acted in the 1950’s, they may have caused the trigger that started the decline and even the extinction of
Figure 1. Comparison of the historical and recent genetic diversity within each Bombus species. Box-plots
these species. Although a very possible explanation, but in the absence of robust collection material from the 19th
century, it is impossible to test this possibility, let alone the general technical difficulties in using haplodiploid species. In our study we present species belonging to different subgenera which could represent a different genetic diversity and could bias the difference observed between restricted and widespread species. Indeed, the over representing of different species of the subgenus Thoracobombus could bias the observed lower genetic diversity within the group of restricted bumblebee species. However, we speculate that this is not the case. Indeed, even within the subgenera Thoracobombus, the widespread species (B. pascuorum) had a significantly higher genetic diversity than the restricted species (B. ruderarius, B. sylvarum and B. humilis; Table 2 and Fig. 1). The lower levels of genetic diversity in the restricted bumblebee species may be a specific character of these species, and thus do not necessarily mean that there was a population bottleneck or decline. Many species have vast differences in their effective population sizes and genetic diversity2. For instance, Romiguier et al.41 revealed a strong influence of
life-history traits (such as body mass, longevity, and reproductive strategy) on genetic diversity by a comparative analysis of patterns of diversity across several animals. A bumblebee species in which the mother queen produces much reproductives (daughter queens and/or males) may have a higher level of genetic diversity than a species which produces less reproductives. Whether this is effectively the case is not known. More research concerning the role of species specific characteristics on the observed difference in genetic diversity between these bumblebee species might bring more clarity. The relatively low genetic diversity of the restricted species may be explained by the smaller population sizes of these species. Indeed, restricted bumblebee populations may have smaller pop-ulation sizes and thus can have a reduced genetic diversity as a result of higher genetic drift and if isolated also
A HE (Intercept) Distribution Subgenera Period
Distribution:
Subgenera Distribution: Period Subgenera: Period df logLik AIC delta weight
M4 0.554 + + NA NA NA NA 9 71.762 − 120.79 0.000 0.496
M12 0.554 + + NA + NA NA 9 71.762 − 120.79 0.000 0.496
M8 0.584 + + + NA NA NA 10 68.195 − 110.44 10.343 0.003
B AR (Intercept) Distribution Subgenera Period
Distribution:
Subgenera Distribution: Period Subgenera: Period df logLik AIC delta weight
M40 4.878 + + + NA NA + 14 − 45.151 131.030 0.000 0.250
M48 4.878 + + + + NA + 14 − 45.151 131.030 0.000 0.250
M4 4.742 + + NA NA NA NA 9 − 54.470 131.678 0.648 0.181
M12 4.742 + + NA + NA NA 9 − 54.470 131.678 0.648 0.181
M56 4.915 + + + NA + + 15 − 44.719 134.438 3.408 0.046
Table 3. Selection of best fitting model explaining the genetic diversity in Bombus. Of all possible models
run under MUMIn55 using species distribution, species subgenera, location and both time periods as fixed
effects and species as a random effect, the best fitting linear mixed-effect models (with a delta < 4) are given. The final selected models for A. HE and B. AR were indicated in bold following their high (negative or positive)
Akaike’s Information Criterion (AIC) and weight of fitting the pattern. With + = parameters included in the model, and NA = not included parameters.
A. HE Estimate SE t-value p Distribution − 0.098 0.017 − 5.803 < 0.001 Megabombus 0.013 0.035 0.371 0.710 Melanobombus 0.166 0.034 4.889 < 0.001 Pyrobombus 0.048 0.035 1.370 0.171 Thoracobombus − 0.098 0.029 − 3.348 <0.001 B. AR Estimate SE t-value p Distribution − 1.067 0.303 − 3.520 <0.001 Period − 0.280 0.940 − 0.298 0.766 Megabombus 0.988 0.803 1.229 0.219 Melanobombus 1.552 0.790 1.965 0.049 Pyrobombus 0.525 0.803 0.654 0.513 Thoracobombus − 0.745 0.729 − 1.031 0.302 Period * Megabombus 0.239 1.052 0.228 0.820 Period * Melanobombus − 0.758 1.030 − 0.736 0.462 Period * Pyrobombus 2.061 1.069 1.927 0.054 Period * Thoracobombus 0.291 0.988 0.294 0.768
Table 4. Output of the selected linear mixed - effect models (LMM). Impact of the different factors in the
models on A. HE and B. AR. With the estimate, standard error (SE) and p-value of each factor or interaction in
a reduced gene flow4,6. Although it seems that genetic drift did not result in an extra reduction over the last 100
generations, our results showed that restricted bumblebee species have lower effective population sizes. Species’ smaller distribution is thus a valid explanation of the low genetic diversity observed in the restricted species which are now more heavily affected by the drivers of the decline. Hence, the question can perhaps be rephrased: is a low HE and AR intrinsically linked with the biology of a certain species, or with being locally restricted? Here
we defined the distribution range based on data from a small ecological scale (see Table 6 and Fig. 2). A sampling on a larger ecological scale, within the whole distribution range of these species, will allow for comparison of the same species being locally widespread and locally restricted. This will determine the link between species and an intrinsic level of genetic diversity. In turn, this will have great influence on the implementation of future conser-vation strategies.
Methods
Sampling of historical and recent specimens.
Historical bumblebee specimens were collected from the Hymenoptera collection of the Royal Belgian Institute of Natural Sciences (RBINS) in Brussels. Five locations in Belgium were selected due to the presence of sufficient available historical bumblebee specimens of multiple spe-cies for genetic analysis, and since these five locations represent the main bio-geographical units of the country.Species Location LMNe 95% CI
B. soroeensis Torgny 239.0 167.6–354.0 B. humilis Torgny 1343.7 467.7–∞ B. ruderarius Torgny 455.8 266.8–918.1 B. sylvarum Torgny 160.6 121.1–214.0 B. pascuorum Francorchamps 1971.0 1096.5–5041.6 B. pascuorum Moorsel 984.6 627.23–1730.0 B. pascuorum Trivières 1615.0 875.2–4315.0 B. pascuorum Torgny 219.0 167.9–288.3 B. hortorum Francorchamps ∞ 11493.0–∞ B. hortorum Moorsel ∞ ∞ –∞ B. hortorum Trivières 4896.4 17313.0–∞ B. pratorum Francorchamps 449.9 339.6–607.1 B. pratorum Moorsel 396.1 299.2–538.5 B. pratorum Trivières 503.1 364.5–726.4 B. lapidarius Francorchamps 939.8 656.9–1446.5 B. lapidarius Moorsel 658.1 477.7–955.2 B. lapidarius Nieuwpoort 840.4 610.5–1216.5 B. lapidarius Trivières 2851.4 1310.2–∞ B. lapidarius Torgny 599.9 453.5–816.6
Table 5. Estimation of the effective population sizes (Ne) with different temporal methods. For each
method, the 95% confidence interval (CI) of Ne is given. The harmonic mean is calculated over all temporal
methods for each population and over all populations of each species.
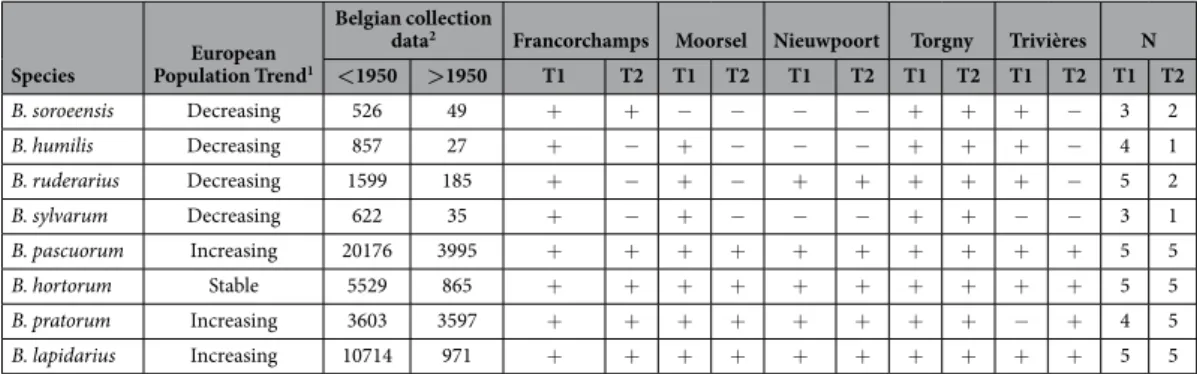
Species Population TrendEuropean 1
Belgian collection
data2 Francorchamps Moorsel Nieuwpoort Torgny Trivières N
<1950 >1950 T1 T2 T1 T2 T1 T2 T1 T2 T1 T2 T1 T2 B. soroeensis Decreasing 526 49 + + − − − − + + + − 3 2 B. humilis Decreasing 857 27 + − + − − − + + + − 4 1 B. ruderarius Decreasing 1599 185 + − + − + + + + + − 5 2 B. sylvarum Decreasing 622 35 + − + − − − + + − − 3 1 B. pascuorum Increasing 20176 3995 + + + + + + + + + + 5 5 B. hortorum Stable 5529 865 + + + + + + + + + + 5 5 B. pratorum Increasing 3603 3597 + + + + + + + + − + 4 5 B. lapidarius Increasing 10714 971 + + + + + + + + + + 5 5
Table 6. Distribution and abundance data of the different bumblebee species. The division of the selected Bombus species in restricted and widespread species is based on three sets of available data: (i) the species
population trend in Europe25; (ii) the number of bumblebee specimens within the RBINS collection before
1950 and between 1955–199336,37; and (iii) the presence or absence of the species at each location during the
historical and recent bumblebee foraging season 1913–1915 (= T1) and 2013–2015 (= T2), respectively. With N the total number of locations where a species was found, and with V = the presence and – = the absence of the species at that specific location. 1Data from25. 2Data from36,37.
In these five locations (Francorchamps, Moorsel, Nieuwpoort, Trivières, and Torgny; Fig. 2), bumblebees were collected within a 5 × 5 km2 frame. Two neighboring localities were merged together for Trivières (Trivières and
St-Vaast) and Torgny (Torgny and Lamorteau) to allow a comparable sampling area as within the other localities. Historical specimens from the RBINS collection were collected in the bumblebee foraging season 1913, 1914, and 1915 (Table 1), while recent specimens were sampled in 2013, 2014 and 2015 at the same locations. For both historical and recent time periods, 20 to 25 specimens were selected when possible from each location for genetic analyses resulting in the selection of 566 historical and 533 recent specimens (Table 1).
All bumblebee species belong to only one genus, Bombus, but are divided in different subgenera (for a full division of species in subgenera, see ref. 42). The eight bumblebee species selected here belong to five different subgenera: Kallobombus, Megabombus, Melanobombus, Pyrobombus, and Thoracobombus (see Table 1)42.
Here, the further division of the eight bumblebee species in two groups of four currently restricted and four currently widespread species is based on three layers of available distribution or abundance data: (i) the available abundance data of these species within the Belgian collection36,37, with a clear significant difference between
both groups within the two time periods by using a linear mixed model (LMM, lmer(log(abundance) ~ distri-bution + (1|species), data = Data) in R studio43 with R package lme4 version 1.1–1044 (LMM, t-test, t = 6.721,
p < 0.001; Table 6); (ii) the presence and/or absence of the species at each location during the historical and recent
bumblebee foraging season (Table 6): and (iii) the population trend of these species within Europe, with the group of restricted species having a “decreasing” population trend and the widespread species a “stable” or “increasing” population trend (ref. 25; Table 6).
Bumblebee DNA extraction and microsatellite protocol.
One middle leg of each individual bum-blebee specimen was used for DNA extraction. DNA extraction, PCR amplification with 16 microsatellite mark-ers (four multiplexes of four loci), and visualization with capillary electrophoreses on an ABI-3730xl sequencer (Applied Biosystems), were performed with the method as described in Maebe et al.21. The four microsatellitemarkers (B11, B100, B126, B132) developed by Estoup et al.45; and the four loci (BL02, BT04, BT08, and BT10)
developed by Reber-Funk et al.46 were chosen based on Maebe et al.21. Of the other remaining eight markers,
five loci (BL13, BT02, BT05, BT23, BT24) were developed by Reber-Funk et al.46 and three loci (0294, 0304 and
0810) by Stolle et al.47. From the 1099 genotyped specimens, 128 random selected specimens (11.65%) were
re-genotyped to examine the genotypic error rate.
Data analysis.
Some of the genotyped specimens were excluded prior to data analyses, after applying sev-eral validation steps following Maebe et al.21. In short, specimens were removed when they could not be scoredin a reliable manner for a minimum of 10 microsatellite loci, and only one random specimen per sibship was kept after sister identification with the programs Colony 2.048 and Kinalyzer49. Furthermore, genotypic linkage
Figure 2. Overview of the bumblebee species sampled at five locations in Belgium. Specimens for each
species were collected at the same five locations in Belgium in 1913–1915 and 2013–2015. Pictures of species are from Rasmont & Pauly60, and an adapted map of Belgium from http://www.d-maps.com/conditions.
disequilibrium, deviations from Hardy-Weinberg equilibrium (HW), and evidence of null alleles were tested using the programs FSTAT 2.9.350, GENALEX 6.551 and MICROCHECKER52, respectively.
Estimation of genetic diversity.
For each population we determined the genetic diversity based on two parameters: the allelic richness (AR) estimated as the sample size-corrected private allelic richness with thepro-gram HP-Rare 1.153 calculated and normalized on 10 diploid specimens for all populations, and Nei’s unbiased
expected heterozygosity (HE;54) calculated with the program GENALEX 6.551.
Comparison of genetic diversity between species groups.
To examine whether genetic diversity dif-fered between species, and/or whether other factors such as species distribution, species subgenera, locations and/or time period had an effect on genetic diversity, we conducted LMM’s in RStudio43. Species and samplelocation were chosen as random factors: (i) species, since the genetic diversity of a specific species is correlated over time and location; and (ii) location, as specimens were resampled at each location. Fixed factors were: time period (1913–1915 or 2013–2015), species subgenera (belonging to which bumblebee subgenera), and species distribution (widespread or restricted, see explanation above and in Table 6). The model that best fitted the pat-tern in genetic diversity was selected by using the Akaike’s Information Criterion (AIC). The MUMIn pack-age with the dredge command allowed us to calculate all possible combinations and thus model selection55. As
described in Maebe et al.21, problems linked with the interpretation of inter-specific differences could arise, for
instance, in microsatellite mutation rates and levels of polymorphisms. Therefore, we added species as a ran-dom factor in the model. Furthermore, species belonging to the same subgenera could have comparable levels of genetic diversity due to similar mutation rates and dispersal abilities. Thus, over-representing of species belonging to one subgenera in the two groups (widespread versus restricted bumblebee species) could cause bias in our analyses. For instance, bumblebee species of the subgenera Pyrobombus may have higher dispersal abilities than
Thoracobombus species56,57. As species with more limited dispersal rates will have less chance of a successful
recol-onization, they will be more vulnerable to genetic drift and thus may have less genetic variation. Thus, as division in subgenera could influence the level of genetic diversity, subgenera was included in the LMM. The best LMMs were run in R studio with R package lme4 version 1.1–1044.
Effective population size.
The estimation of Ne of each population was performed using one multipletem-poral method: a maximum-likelihood approach implemented in the program MLNe58. This method recently
became recommended for the estimation of Ne in natural populations under both ideal and migration scenarios
(see ref. 59). In short, and contradicting other methods, this method successfully takes migration into account when estimating Ne which otherwise could bias Ne estimation. A generation time of 1 year was used, as most
bumblebee species have one life-cycle per year.
References
1. Luikart, G. et al. Estimation of census and effective population sizes: the increasing usefulness of DNA - based approaches. Conserv.
Genet. 11, 355–373 (2010).
2. Ellegren, H. & Galtier, N. Determinants of genetic diversity. Nat. Rev. Genet. 17(7), 422–433 (2016).
3. Frankham, R., Bradshaw, C. J. A. & Brook, B. W. Genetics in conservation management: revised recommendations for the 50/500 rules, Red List criteria and population viability analyses. Biol. Conserv. 170, 56–63 (2014).
4. Frankham, R. Genetics and extinction. Biol. Conserv. 126, 131–140 (2005). 5. Zayed, A. Bee genetics and conservation. Apidologie 40, 237–262 (2009).
6. Habel, J. C. et al. The relevance of time series in molecular ecology and conservation biology. Biol. Rev. 89, 484–492 (2014). 7. Estoup, A., Tailliez, C., Cornuet, J. M. & Solignac, M. Ses of interrupted microsatellites in 2 bee species, Apis mellifera and Bombus
terrestris (Apidae). Mol. Biol. Evol. 12, 1074–1084 (1995).
8. Schmid-Hempel, R. & Schmid-Hempel, P. Female mating frequencies in Bombus spp. from Central Europe. Insectes Soc. 47, 36–41 (2000).
9. Goulson, D. Bumblebees, behaviour, ecology and conservation 336 (Oxford University Press, 2010).
10. Barker, J. S. F. Effective population size of natural populations of Drosophila buzzatii, with a comparative evaluation of nine methods of estimation. Mol. Ecol. 20, 4452–4471 (2011).
11. Wandeler, P., Hoeck, P. E. A. & Keller, L. F. Back to the future: museum specimens in population genetics. Trends Ecol. Evol. 22, 634–642 (2007).
12. Casas–Marce, M. et al. The value of hidden scientific resources: Preserved animal specimens from private collections and small museums. BioScience 62, 1077–1082 (2012).
13. Griffith, A. M., Koizumi, I., Bright, D. & Stevens, J. R. A case of isolation by distance and short - term temporal stability of population structure in brown trout (Salmo trutta) within the River Dart, southwest England. Evol. Appl. 2, 537–554 (2009).
14. Hoeck, P. E. A., Bollmer, J. L., Parker, P. G. & Keller, L. F. Differentiation with drift a spatio - temporal genetic analysis of Galapagos mockingbird populations (Mimus spp.). Phil. Trans. R. Soc. B. 365, 1127–1138 (2010).
15. Athrey, G., Lindsay, D. L., Lance, R. F. & Leberg P. L. Crumbling diversity: comparison of historical archived and contemporary natural populations indicate reduced genetic diversity and increasing genetic differentiation in the golden - cheeked warbler.
Conserv. Genet. 12, 1345–1355 (2011).
16. Tessier, N., Bernatche, L. & Wright, J. M. Population structure and impact of supportive breeding inferred from mitochondrial and microsatellite DNA analyses in land - locked Atlantic salmon, Salmo salar L. Mol. Ecol. 6, 735–750 (1997).
17. Hoffman, E. A., Schueler, F. W. & Blouin, M. S. Effective population sizes and temporal stability of genetic structure in Rana pipiens, the northern leopard frog. Evolution 58, 2536–2545 (2004).
18. Husemann, M., Nguyen, R., Ding, B. & Danley, P. D. A genetic demographic analysis of Lake Malawi rock - dwelling cichlids using spatio - temporal sampling. Mol. Ecol. 24, 2686–2701 (2015).
19. Klein, A. M. et al. Importance of pollinators in changing landscapes for world crops. Proc. R. Soc. Lond. B Biol. Sci. 274, 303–313 (2007).
20. Lozier, J. D., Strange, J. P., Stewart, I. J. & Cameron, S. A. Patterns of range - wide genetic variation in six North American bumble bee (Apidae: Bombus) species. Mol. Ecol. 20, 4870–4888 (2011).
21. Maebe, K. et al. Microsatellite analysis of museum specimens reveals historical differences in genetic diversity between declining versus stable Bombus species. PLoS ONE 10(6), e0127870, 10.1371/journal.pone.0127870 (2015).
22. Cameron, S. A. et al. Patterns of widespread decline in North American bumble bees. PNAS 18, 662–667 (2011).
23. Reemer, M., Kleijn, D. & Raaijmakers, I. P. Veranderingen in de Nederlandse bijenfauna. In De Nederlandse bijen (Hymenoptera:
Apidae s.l.). – Natuur van Nederland II (Ed. Van Loon, A. J.) 103–109 (Naturalis Biodiversity Center & European Invertebrate
Survey, 2012).
24. Carvalheiro, L. G. et al. Species richness declines and biotic homogenization have slowed down for NW - European pollinators and plants. Ecol. Lett. 16, 870–878 (2013).
25. International Union for Conservation of Nature and Natural Resources The IUCN Red List of Threatened Species
™
http://www. iucnredlist.org/search (2014).26. Potts, S. G. et al. Status and trends of European pollinators. Key findings of the STEP project. 72 (Pensoft Publishers, 2015). 27. Goulson, D., Lye, G. C. & Darvill, B. Decline and conservation of bumble bees. Ann. Rev. Entomol. 53, 191–208 (2008).
28. Charman, T. G., Sears, J., Green, R. E. & Bourke, A. F. G. Conservation genetics, foraging distance and nest density of the scarce Great Yellow Bumblebee (Bombus distinguendus). Mol. Ecol. 19, 2661–2674 (2010).
29. Potts, S. G. et al. Global pollinator declines: trends, impacts and drivers. Trends Ecol. Evol. 25, 345–353 (2010).
30. Vanbergen, A. J. The Insect Pollinators Initiative. Threats to an ecosystem service: pressures on pollinators. Front. Ecol.Environ. 11, 251–259 (2013).
31. Rasmont, P. et al. Climatic Risk and Distribution Atlas of European Bumblebees. Biorisk 10 (Special Issue), 246 Pensoft (2015). 32. Kaplan, J. O., Krumhardt, K. M. & Zimmermann, N. The prehistoric and preindustrial deforestation of Europe. Quat. Sci. Rev. 28,
3016–3034 (2009).
33. Biesmeijer, J. C. et al. Parallel declines in pollinators and insect - pollinated plants in Britain and the Netherlands. Science 313, 351–354 (2006).
34. Whitehorn, P. R. et al. Genetic diversity, parasite prevalence and immunity in wild bumblebees. Proc. R. Soc. Lond. B Biol. Sci. 278, 1195–1202 (2011).
35. Whitehorn, P. R. et al. Genetic diversity and parasite prevalence in two species of bumblebee. J. Insect Conserv. 18(4), 667–673 (2014).
36. Rasmont, P. et al. The survey of wild bees (Hymenoptera, Apoidea) in Belgium and France. FAO – report http://www. atlashymenoptera.net/biblio/144_2005_Rasmont_et_al_Apoid_Survey_FAO_report.pdf (2005).
37. Rasmont, P. et al. The faunistic drift of Apoidea In Belgium (Ed. Bruneau, E.) 65–87 (Commission of the European Communities, 1993).
38. Rasmont, P. & Mersch, P. Première estimation de la dérive faunique chez les bourdons de la Belgique (Hymenoptera, Apidae). Ann.
Soc. R. Zool. Bel. 118, 141–147 (1988).
39. Ugelvig, L. V., Nielsen, P. S., Boomsma, J. J. & Nash, D. R. Reconstructing eight decades of genetic variation in an isolated Danish population of the large blue butterfly Maculinea arion. BMC Evol. Biol. 11, 201–210 (2011).
40. Habel, J. C. & Smith, T. The burden of genetic diversity. Biol. Conserv. 147(1), 270–274 (2012).
41. Romiguier, J. et al. Comparative population genomics in animals uncovers the determinants of genetic diversity. Nature 515, 261–263 (2014).
42. Cameron, S. A., Hines, H. M. & Williams, P. H. A comprehensive phylogeny of the bumble bees (Bombus). Biol. J. Linnean Soc. 91, 161–188 (2007).
43. R Development Core Team. R: A language and environment for statistical computing. R Foundation for Statistical Computing http:// www.R-project.org (2008).
44. Bates, D., Maechler, M., Bolker, B. & Walker, S. Fitting Linear Mixed - Effects Models Using lme4. J. Stat. Softw. 67(1), 1–48 (2015). 45. Estoup, A., Scholl, A., Pouvreau, A. & Solignac, M. Monoandry and polyandry in bumblebees (Hymenoptera; Bombinae) as
evidenced by highly variable microsatellites. Mol. Ecol. 4(1), 89–93 (1995).
46. Reber-Funk, C., Schmid-Hempel, R. & Schmid-Hempel, P. Microsatellite loci for Bombus spp. Mol. Ecol. Notes 6, 83–86 (2006). 47. Stolle, E. et al. A second generation genetic map of the bumblebee Bombus terrestris (Linaeus, 1758) reveals slow genome and
chromosome evolution in the Apidae. BMC Genom. 12, 48 (2011).
48. Wang, J. L. Sibship reconstruction from genetic data with typing errors. Genetics 166, 1963–1979 (2004).
49. Ashley, M. V. et al. Kinalyzer, a computer program for reconstructing sibling groups. Mol. Ecol. Resour 9, 1127–1131 (2009). 50. Goudet, J. Fstat: a program to estimate and test gene diversities and fixation indices (version 2.9.3). Updated from Goudet, J (1995):
Fstat (version 1.2): a computer program to calculate F - statistics. J. Hered. 86, 485–486 (2001).
51. Peakall, R. & Smouse, F. GENALEX 6: Genetic Analysis in Excel. Population Genetic Software for Teaching and Research. Mol. Ecol.
Notes 6, 288–295 (2006).
52. Van Oosterhout, C., Hutchinson, W. F., Wills, D. P. M. & Shipley, P. MICROCHECKER: software for identifying and correcting genotyping errors. Mol. Ecol. Notes, 4, 535–538 (2004).
53. Kalinowski, S. T. HP-Rare: A computer program for performing rarefraction on measures of allelic diversity. Mol. Ecol. Notes 5, 187–189 (2005).
54. Nei, M. Estimation of average heterozygosity and genetic distance from a small number of individuals. Genetics 89, 583–590 (1978). 55. Barton, K. MuMIn: Multi - Model Inference. R package version 1.15.1. (http://CRAN.R - project.org/package= MuMIn) (2015). 56. Darvill, B. et al. Cryptic differences in dispersal lead to differential sensitivity to habitat fragmentation in two bumblebee species.
Mol. Ecol. 19, 53–63 (2010).
57. Goulson, D. et al. Population structure, dispersal and colonization history of the garden bumblebee Bombus hortorum in the Western Isles of Scotland. Conserv. Genet. 12, 867–879 (2011).
58. Wang, J. & Whitlock, M. C. Estimating effective population size and migration rates from genetic samples over space and time.
Genetics 163, 429–446 (2003).
59. Gilbert, K. J. & Whitlock, M. V. Evaluating methods for estimating local effective population size with and without migration.
Evolution 69, 2154–2166 (2015).
60. Rasmont, P. & Pauly, A. Les bourdons de la Belgique. Atlas Hymenoptera http://www.zoologie.umh.ac.be//hymenoptera/page. asp?ID= 160 (2010).
Acknowledgements
This study is as part of the BELBEES project, a Belgian conservation research project, funded by the Belgian Science Policy (BELSPO; grant BR/132/A1/BELBEES). Furthermore, we thank Michaël Terzo for his assistance in collecting the specimens of Nieuwpoort, Carole Tindo Tagnin Tchidzem and Charlotte Fieuws for their help in performing the microsatellite analyses, and Niels Piot for his help in running the statistical analysis in R Studio.
Author Contributions
Conceived and designed the experiments: K.M., I.M., G.S. Collection of old specimens: K.M., W.D., J.L.B. Sampling of recent specimens: K.M., S.V. Performed the experiments: K.M., I.M., T.C. Analyzed the data: K.M., I.M., T.C. Wrote the paper: K.M., I.M., S.V., W.D., J.L.B. P.R., G.S.
Additional Information
Competing financial interests: The authors declare no competing financial interests.
How to cite this article: Maebe, K. et al. A century of temporal stability of genetic diversity in wild bumblebees. Sci. Rep. 6, 38289; doi: 10.1038/srep38289 (2016).
Publisher's note: Springer Nature remains neutral with regard to jurisdictional claims in published maps and
institutional affiliations.
This work is licensed under a Creative Commons Attribution 4.0 International License. The images or other third party material in this article are included in the article’s Creative Commons license, unless indicated otherwise in the credit line; if the material is not included under the Creative Commons license, users will need to obtain permission from the license holder to reproduce the material. To view a copy of this license, visit http://creativecommons.org/licenses/by/4.0/