HAL Id: hal-02638247
https://hal.inrae.fr/hal-02638247
Submitted on 28 May 2020
HAL is a multi-disciplinary open access
archive for the deposit and dissemination of
sci-entific research documents, whether they are
pub-lished or not. The documents may come from
teaching and research institutions in France or
abroad, or from public or private research centers.
L’archive ouverte pluridisciplinaire HAL, est
destinée au dépôt et à la diffusion de documents
scientifiques de niveau recherche, publiés ou non,
émanant des établissements d’enseignement et de
recherche français ou étrangers, des laboratoires
publics ou privés.
tree of Lebanon (Abies cilicica Carr.) : implications for
conservation
Lara Awad, Bruno Fady, Carla Khater, Anne Roig, Rachid Cheddadi
To cite this version:
Lara Awad, Bruno Fady, Carla Khater, Anne Roig, Rachid Cheddadi. Genetic structure and diversity
of the endangered fir tree of Lebanon (Abies cilicica Carr.) : implications for conservation. PLoS ONE,
Public Library of Science, 2014, 9 (2), pp.e90086. �10.1371/journal.pone.0090086�. �hal-02638247�
Tree of Lebanon (
Abies cilicica
Carr.): Implications for
Conservation
Lara Awad1*, Bruno Fady2, Carla Khater3, Anne Roig2, Rachid Cheddadi1
1 University of Montpellier II, Institute of Evolutionary Sciences, CNRS UMR 5554, Montpellier, France, 2 INRA, UR629, Ecologie des Foreˆts Me´diterrane´ennes (URFM), Domaine St Paul, Avignon, France,3 Center for Remote Sensing, National Council for Scientific Research-Lebanon, Bir Hassan, Beirut, Lebanon
Abstract
The threatened conifer Abies cilicica currently persists in Lebanon in geographically isolated forest patches. The impact of demographic and evolutionary processes on population genetic diversity and structure were assessed using 10 nuclear microsatellite loci. All remnant 15 local populations revealed a low genetic variation but a high recent effective population size. FST-based measures of population genetic differentiation revealed a low spatial genetic structure, but Bayesian analysis
of population structure identified a significant Northeast-Southwest population structure. Populations showed significant but weak isolation-by-distance, indicating non-equilibrium conditions between dispersal and genetic drift. Bayesian assignment tests detected an asymmetric Northeast-Southwest migration involving some long-distance dispersal events. We suggest that the persistence and Northeast-Southwest geographic structure of Abies cilicica in Lebanon is the result of at least two demographic processes during its recent evolutionary history: (1) recent migration to currently marginal populations and (2) local persistence through altitudinal shifts along a mountainous topography. These results might help us better understand the mechanisms involved in the species response to expected climate change.
Citation: Awad L, Fady B, Khater C, Roig A, Cheddadi R (2014) Genetic Structure and Diversity of the Endangered Fir Tree of Lebanon (Abies cilicica Carr.): Implications for Conservation. PLoS ONE 9(2): e90086. doi:10.1371/journal.pone.0090086
Editor: Giovanni G. Vendramin, CNR, Italy
Received July 4, 2013; Accepted January 29, 2014; Published February 27, 2014
Copyright: ß 2014 Awad et al. This is an open-access article distributed under the terms of the Creative Commons Attribution License, which permits unrestricted use, distribution, and reproduction in any medium, provided the original author and source are credited.
Funding: This paper represents a part of the doctoral research of Lara Awad who acknowledges a scholarship from the Institut Ecologie et Environnement (INEE) of the Centre National de la Recherche Scientifique (CNRS) (Contract number 245303) (http://www.cnrs.fr/inee/) and (http://www.cnrs.fr/index.php). Fieldwork in Lebanon was facilitated by a financial support from the Grant Research Program (GRP) of the National Council for Scientific Research-Lebanon (NCSR) (http:// www.cnrs.edu.lb/). The stay of Lara Awad at INRA-URFM for the laboratory work was facilitated by a financial support from the EcoChange project (http://www. ecochange-project.eu/ecochange-project). The funders had no role in study design, data collection and analysis, decision to publish, or preparation of the manuscript.
Competing Interests: The authors have declared that no competing interests exist. * E-mail: lara.awad@univ-montp2.fr
Introduction
Geographic patterns of genetic variation in conifers have long been studied at the species and populations levels [1–9]. Geographic range size, geographic isolation and biogeographic position may play a crucial role in shaping patterns of genetic variation [10]. Widely distributed woody plant species with high longevity and high fecundity generally retain high genetic diversity within populations but low genetic differentiation among popula-tions [11], [12]. The opposite is generally found for endemic and narrowly distributed woody plants with the same combination of traits [12]. However, the low genetic variation found in rare species may be an overgeneralization [13]. For instance, high gene diversity and population structure can be found in endemic species with restricted geographic range [14]. The imprint of geographic range size on patterns of genetic diversity may also be indirectly driven by species’ dispersal ability. At the end of the Pleistocene, the rapid geographical range expansion of many tree species was characterized by the occurrence of long-distance dispersal events [15]. Consequences of such range expansions on spatial genetic patterns and on the maintenance or erosion of genetic diversity may respectively depend on the forms of dispersal [16] and on the number of long-distance dispersal events [17]. Gene flow arising
from dispersal can either impede or promote evolution depending on the geographic structure of natural populations [18]. For instance, local adaptation may be achieved despite high gene flow and long-distance dispersal in expanding populations [19], [20].
The genetic imprint of geographic isolation, or fragmentation, on natural populations can vary with respect to their demographic structure. Relict populations in fragmented landscapes predictably show low genetic variation but high genetic differentiation due to spatial isolation [21]. Demographic bottlenecks resulting from fragmentation may not be accompanied by genetic bottlenecks due to temporal fluctuation in population sizes, mating system dynamics, or metapopulation structure [22], [23], [24]. Short-range dispersal occurring between neighboring populations should contribute to the genetic differentiation of remote populations via isolation-by-distance [25]. Over time, the isolation-by-distance genetic pattern should be pronounced at equilibrium between dispersal and genetic drift in long-established populations [26]. In demographically unstable populations, however, fragmentation can either increase or decrease the genetic variance among populations. The outcome may depend on the mode of colonization [27], on temporal and spatial variation and co-variation in demographic parameters [28], or on the rates of
extinction and recolonization relative to the effective population size [18] or relative to the effective number of migrants [27], [29]. The biogeographic position within a geographic range or a biome may impact genetic diversity within and among popula-tions. In the Mediterranean basin, genetic diversity is higher than other regions of the world for conifers [30] and the rear-edge populations of temperate tree species often display large regional genetic diversity and unique genetic variants [31]. Most rear-edge populations have not been involved in major postglacial recolo-nization events [32]. Instead, they have persisted locally with small altitudinal shifts in range [33], [34]. Longitude and underlying demographic processes such as climate-related effective population size changes and migration can also explain genetic diversity gradients. For instance, a pattern of decreasing within-population genetic diversity is observable from east to west across the Mediterranean basin in a wide range of taxa [10], [35].
In this study, we have explored the imprint of geographic range size, geographic isolation and biogeographic position and that of demographic processes such as dispersal ability and viability on the modern genetic diversity of Abies cilicica Carr. in Lebanon (Cilician fir). Abies cilicica is a long-lived and outcrossed conifer species. It is endemic to the Eastern Mediterranean in the Taurus, Anti-Taurus and Amanus mountains of Turkey, the Alawi mountains in Syria and the Northern Mount Lebanon range in Lebanon (Figure 1). However, its range is not continuous, and in Lebanon, noticeably, it is geographically restricted and geographically isolated from the rest of its range with more than a 150 km distance from Abies cilicica in Syria (Figure 1). In Lebanon, Abies cilicica is geograph-ically marginal as it currently occupies the southernmost geographical position of its range (Figure 1). The varied topography of Mount Lebanon shelters geographically isolated forest patches. Historically, Ancient Egyptian texts attest the use of Abies cilicica for its timber, during the Ancient Egyptian New Kingdom, as a sign of power of the Pharaoh, particularly in the construction of flagpoles for temple pylons, in shipbuilding, and in the construction of the Barque of Amun [36]. During World War II, the wood of Abies cilicica was cut mainly from Qammouaa to build the railroad between Tripoli and Haifa [37]. Major current anthropogenic disturbances include illegal logging and overgraz-ing activities. The IUCN status of Abies cilicica is Near Threatened overall [38], but IUCN considers it critically endangered at national level in Lebanon.
Because genetic diversity is potentially high in the Eastern Mediterranean and for mountain species [10], and because its distribution range is patchy and some populations display low census size, Abies cilicica in Lebanon offers the opportunity to answer the following questions for which accumulating experi-mental evidence remains central: (1) Is biogeographic position affecting genetic diversity within and among populations?, (2) Is habitat fragmentation increasing spatial genetic structure?, (3) Is geographic isolation limiting dispersal?, and (4) Is geographic marginality affecting persistence?
Material and Methods Ethics Statement
All the field sampling of Abies cilicica in Lebanon was carried out after obtaining mission permits from CNRS in France and NCSR in Lebanon (number L03504, L03701, 2938/w and 5170/w) and following the approval in Lebanon of corresponding municipalities and nature reserves organizational teams. Sampling of Abies marocana Trab. (also known as Abies pinsapo subsp. marocana Trab.) was permitted by the Talassemtane National Park, Morocco.
Needle samples of Abies bornmuelleriana Mattf., Abies cephalonica Loud. and Abies alba Mill. were provided by INRA-URFM. Sampling Area and Plant Material
Abies cilicica is currently distributed in Lebanon across 15 remnant populations located between ca. 1000–1800 m.a.s.l. on the western slopes of northern Mount Lebanon. Moist airstreams off the Mediterranean approaching over Mount Lebanon result in a classic orographic precipitation pattern. Rain falling on the western side of Mount Lebanon becomes snow at higher elevations during winter. The species currently occupies humid bioclimatic zones with a mean annual precipitation over 800 mm. The varied topography of Mount Lebanon allows it to inhabit both the Supra-Mediterranean (1000–1500 m.a.s.l.) and Mountain-Mediterra-nean (1500–2000 m.a.s.l.) vegetation zones. Currently, it occupies a patchy distribution covering 1613 ha equivalent to 1.2% of the total forest cover of Lebanon, compared to 1.58% for Cedrus libani A. Rich. (Cedar of Lebanon) [39].
We have exhaustively sampled all the 15 remnant natural populations of A. cilicica in Lebanon (Table 1, Table S1). Adult trees were sampled randomly at distance intervals of 20 m approximately keeping sampled areas to a minimum. A total of 351 leaf samples of A. cilicica from Lebanon were collected and then conserved at 220uC prior to DNA extraction.
DNA Extraction
Total genomic DNA was successfully extracted and purified from 45 mg of needles per sample using the QIAGEN DNeasy 96 plant kit following manufacturer’s protocol. Furthermore, 48 needle samples from four Mediterranean Abies species were also used for DNA extraction to serve as reference for the genetic analyses. These included 6 samples of A. marocana from the Talassemtane National Park in Morocco, 8 samples representing a mixture of 6 populations of A. bornmuelleriana from Turkey, 8 samples representing a mixture of 8 populations of A. cephalonica from Greece, 10 samples representing a mixture of 10 populations of A. alba from the French Pyrenees and 16 samples representing a mixture of 4 populations of A. alba from the French Southern Alps (Table S1).
Microsatellite Analysis
Microsatellites are efficient molecular markers for describing the demographic history of populations [40], and therefore addressing specific questions related to their evolutionary ecology and conservation [41]. Genomic DNA amplification was performed using 10 nuclear microsatellites: NFF3, NFH15, NFH3 and NFF7 developed for A. nordmanniana Stev. [42], and SF1, SFb4, SFb5, SF50, SF78 and SF333 developed for A. alba Mill. [43]. The forward primer was 59 end labeled by one of fluorescent dyes 6-FAM (blue), HEX (green), TAMRA (yellow) or ATTO565 (red) (Eurofins MWG Operon). Two multiplex microsatellite sets (NFF3, NFH15, NFH3, NFF7 and SF1, SFb4, SFb5, SF50, SF78, SF333) for which allele drop-out was controlled, were amplified for all individuals by polymerase chain reaction (PCR) using Qiagen Multiplex PCR Kit. Multiplex PCR was run in an 11mL reaction on a Mastercycler EP Gradient S96 thermal cycler (Eppendorf). The PCR mix contained 26 Qiagen Multiplex PCR Master Mix (16 final concentration), 0.2mM of each forward and reverse primers, 56Q-Solution (0.56final concentration), RNase-free water (Qiagen) qs to 9mL and 2mL (about 20 ng) of genomic DNA. The thermal cycling consisted of initial denaturation step at 95uC for 15 minutes; 3-step cycling repeated 30 times and consisting of denaturation at 94uC for 30 seconds, annealing at 57uC for 90 seconds and extension at 72uC for 60 seconds; and a final extension step at 72uC for 10 minutes.
Capillary electrophoresis of multiplexed PCR products was performed on an ABI 3730XL automated sequencer (Applied Biosystems) at INRA Avignon, with the GeneScanTM- 500 LIZTM size standard (Applied Biosystems) run with each sample. In order to decrease the risks of genotyping errors related to automated or arbitrary decisions in allelic binning [44], [45], allelic binning and scoring of genotypes were performed manually by two different persons using the software GeneMapper 4.1 (Applied Biosystems) and compared to generate the final data set. The genotype dataset for the 10 microsatellites of 399 individuals of A. cilicica, A. cephalonica, A. bornmuelleriana, A. marocana and A. alba is publicly deposited in the DRYAD repository.
Data Analysis
Hardy-Weinberg Equilibrium, Linkage Disequilibrium and Null Alleles
Exact tests for deviations from Hardy–Weinberg equilibrium (HWE) were performed using the heterozygote deficiency and
heterozygote excess tests implemented inGENEPOP4.1.3 [46], [47].
Testing for linkage disequilibrium (LD) was also performed in
GENEPOP4.1.3 by using the log likelihood ratio statistic test (G-test).
Exact P-values for the individual population or locus tests were estimated using the Markov Chain algorithm implemented in
GENEPOP4.1.3 with 10000 dememorization steps, 100 batches and
5000 iterations and were then corrected both using the sequential Bonferroni procedure [48] and the Benjamini-Hochberg method [49] to ensure controlling both the Family Wise Error Rate (FWER) and the False Discovery Rate (FDR). The presence and
frequency of null alleles were examined using FreeNA [50]
following the Expectation Maximization (EM) algorithm [51] which was found to provide unbiased and low variance estimates of null allele frequencies [50]. Given that the presence of null alleles result in an overestimation of population genetic differen-tiation [50],FreeNAwas used to compute the FSTstatistic [52] both
using and without using the ENA (Excluding Null Alleles) correction method, i.e. by excluding or not excluding null allelic
Figure 1. Range of distribution ofAbies cilicicain the Eastern Mediterranean. Remnant populations of Abies cilicica in Turkey, Syria and Lebanon are plotted in red onto the map of the Eastern Mediterranean. Remnant populations of Abies cilicica in Lebanon are plotted in green onto the map of Lebanon where they are currently found on the western slopes of the northern part of Mount Lebanon. Geographical position of Abies cilicica in Turkey and Syria were plotted from aEUFORGENmap [105] while the geographical position of Abies cilicica in Lebanon corresponds to our
sampling data. Map was prepared usingQGISversion 1.8.0 [106] and theGMTpackage [107] withinR[108]. doi:10.1371/journal.pone.0090086.g001
states from the FST computation [50]. The bootstrap 95%
confidence intervals (CI) for the global FSTvalues were calculated
using 50000 replicates over loci. Within-Population Genetic Diversity
GenAlEx v6 [53] and FSTAT version 2.9.3.2 [54] were used to
estimate observed heterozygosity HO, expected heterozygosity HE
[55], [56], rarefied allelic richness AR[57], [58] for a sample size of
n = 20 gene copies (10 diploid trees), and inbreeding coefficient FIS
[59]. The bootstrap 99% CI for the global FISvalue over loci was
calculated inFSTATversion 2.9.3.2 using 15000 replicates. Rarefied
private allelic richness s was computed using the rarefaction
method [57], [60] implemented in HP-Rare 1.1 [61] with a
minimum sample size of n = 20 gene copies. Statistical significance at the 5% nominal level of the difference between the mean value of HOand HEacross all samples for all loci was
verified using a Student’s t-test. Differences in the within-population genetic diversity and allelic richness among A. cilicica, A. marocana, A. bornmuelleriana, A. cephalonica and A. alba were assessed using a permutation test implemented in FSTATversion
2.9.3.2 [54]. Statistical significance at the 5% nominal level was calculated after 10000 permutations of populations among groups. Among-Population Genetic Differentiation
The differentiation between populations was computed in
SPAGeDi [62] based on allele identity and allele size by respectively using FST [59] and RST [63], [64], and their significance was
determined by 10000 permutations. The presence of a phylogeo-graphic pattern was also assessed, using the same software, after 10000 randomizations of allele sizes among alleles within loci [65], by testing whether RSTcomputed before randomization was larger
than RST obtained after allele size permutation (pRST). The
randomization test also infers whether or not strict stepwise-like mutations contributed to population differentiation [65].
Population genetic structure was also assessed using two Bayesian clustering approaches with different underlying assump-tions concerning the units of clustering (individual, population), the types of clustering (non-spatial, spatial), and the computation algorithm (Markov chain Monte Carlo (MCMC), stochastic optimization). The first Bayesian clustering approach, implement-ed in the softwareSTRUCTURE2.3.3 [66], identifies the number of
distinct genetic clusters (K) and probabilistically assigns individual multilocus genotypes to these clusters. To infer posterior probabilities of K, we ran a series of independent runs with different user-defined values of K clusters ranging from 1 to 15. Assuming that individuals may have mixed ancestry and that the different populations have correlated allele frequency [67], analysis was run ten times for 106 iterations of MCMC after a burn-in period of 30000. No prior information on the sampling locations of each individual was used as recommended in the
software documentation [68]. STRUCTURE results were then
processed in a web-based program,STRUCTURE HARVESTER[69],
which implements the Evanno method [70] to estimate a mode at the true K. The second Bayesian approach, implemented in the softwareBAPS6 [71], estimates the hidden population substructure
by clustering sampled populations into panmictic groups [72]. Analysis was performed at the population level by using a spatial mixture model with prior information on the geographical position of the sampled populations, to prevent both over-smoothing in the case of a weak spatial structure and the emergence of spurious genetic structure as a result of weak stochastic fluctuations in the allele frequencies [73], [74]. Spatial genetic mixture analysis was run ten times after choosing a set of possible values of K clusters ranging from 1 to 15. To find the optimal partition, the program uses a stochastic optimization algorithm, which is less computa-tionally intensive than the MCMC algorithm used inSTRUCTURE
[75]. A joint posterior distribution of partitions of the sampled populations into genetically divergent groups was produced and then plotted onto the map of Lebanon.
FSTATversion 2.9.3.2 [54] was used to compute, for the identified
clusters, the observed (HO) and expected (HE) proportion of
heterozygotes and the overall gene diversity (HT) according to
[76], FISand FSTaccording to [59], and rarefied allelic richness (AR)
for a sample size of n = 102 gene copies or 51 diploid individuals [57], [58]. Statistical significance at the 5% significance level was obtained after 10000 permutations of populations among demes. RST[63], [64] was also computed among populations of each of the
identified clusters using the software SPAGeDi [62], as well as the
occurrence of a phylogeographic pattern as described above. Direct estimates of recent migration rates within and between the current clusters were generated in the software GENECLASS2
[77] through assignment tests allowing the detection of first-generation (F0) migrants. The likelihood (L) that an individual
originates from a given population sample was computed using the statistical criterionL hom eL max, i.e. the ratio of the likelihood of finding a given individual in the population in which it was sampled to the greatest likelihood among all sampled populations [78]. Given that all the populations of A. cilicica in Lebanon have been extensively sampled, this criterion was considered to be informative on recent dispersal [77], [78]. The likelihood estimation was computed using the likelihood-based Bayesian method of [79], which has been shown to perform better than frequency-based and distance-based methods [80]. The probability computation, at the 1% significance level, was assessed by using the Monte Carlo resampling method of [78] with 10000 simulated individuals instead of the Monte Carlo resampling methods of [79], [80] to better control type I error rates.
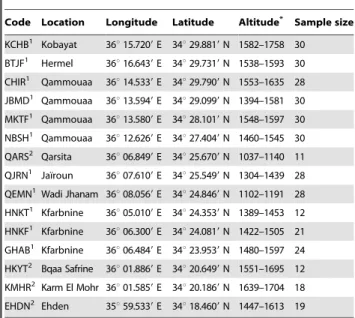
Table 1. Origin, location and sample size of Abies cilicica populations in Lebanon.
Code Location Longitude Latitude Altitude* Sample size KCHB1
Kobayat 36u 15.7209 E 34u 29.8819 N 1582–1758 30 BTJF1
Hermel 36u 16.6439 E 34u 29.7319 N 1538–1593 30 CHIR1
Qammouaa 36u 14.5339 E 34u 29.7909 N 1553–1635 28 JBMD1
Qammouaa 36u 13.5949 E 34u 29.0999 N 1394–1581 30 MKTF1
Qammouaa 36u 13.5809 E 34u 28.1019 N 1548–1597 30 NBSH1 Qammouaa 36u 12.6269 E 34u 27.4049 N 1460–1545 30 QARS2
Qarsita 36u 06.8499 E 34u 25.6709 N 1037–1140 11 QJRN1
Jaı¨roun 36u 07.6109 E 34u 25.5499 N 1304–1439 28 QEMN1Wadi Jhanam 36u 08.0569 E 34u 24.8469 N 1102–1191 28 HNKT1
Kfarbnine 36u 05.0109 E 34u 24.3539 N 1389–1453 12 HNKF1
Kfarbnine 36u 06.3009 E 34u 24.0819 N 1422–1505 21 GHAB1 Kfarbnine 36u 06.4849 E 34u 23.9539 N 1480–1597 24 HKYT2
Bqaa Safrine 36u 01.8869 E 34u 20.6499 N 1551–1695 12 KMHR2 Karm El Mohr 36u 01.5859 E 34u 20.1869 N 1639–1704 18
EHDN2 Ehden 35u 59.5339 E 34u 18.4609 N 1447–1613 19 *Elevation in meters above sea level.
1
membership of the local population to deme 1 (Northeastern ridge).
2
membership of the local population to deme 2 (Southwestern ridge). doi:10.1371/journal.pone.0090086.t001
Isolation-By-Distance
Isolation-by-distance (IBD) [25] was analyzed using IBDWS
version 3.23 [81] by assessing the statistical significance, in a Mantel test [82] with 30000 permutations, of the relationship
between the measure of similarity MM~^
1 FST{1
4 [26] among
population pairs and the comparable matrix of geographic distances in a two-dimensional stepping stone model. This approach was chosen as it has been shown to distinguish between equilibrium and non-equilibrium populations under dispersal and genetic drift [26]. Both ^MM and the geographic distance were log-transformed as suggested in [26]. The strength of IBD was quantified using a reduced major axis (RMA) regression, which is more appropriate for this purpose than a standard ordinary least squares (OLS) regression [83]. Genetic Bottlenecks
Three complementary methods were used to detect whether or not A. cilicica in Lebanon had experienced recent and severe genetic bottlenecks. The first method, implemented in the software
M-P-Val and Critical_M[84], is based on the computation of the
parameter M~ k
rz1, i.e. the mean ratio of the number of alleles (k)
to the range in allele size (r), from a population sample of microsatellite loci [84], [85]. Along with the fact that when effective population size decreases, genetic drift intensifies and alleles are subsequently lost, this ratio is expected to be smaller in recently and severely bottlenecked populations than in populations under mutation-drift equilibrium [84]. This method can detect recent genetic bottlenecks over a period of time of 100 generations [84]. The analysis was run assuming a Two-Phase Mutation
Model (TPM) [86] of microsatellite loci with parameters ps
(proportion of one-step mutations) = 0.88 and Dg(average size of
non one-step mutations) = 2.8 as reviewed in [84]. InM-P-Val, the
average observed value of M calculated from the microsatellite dataset was compared with a simulated equilibrium distribution of
M for different values of the population parameter h~4Nem
(where Neis the pre-bottleneck effective population size, and m is
the mutation rate of microsatellites per locus per generation). InCritical_M, values of the critical M threshold (Mc), below which
a bottleneck is evident, were also calculated for the different h values. Considering an average mutation rate per locus per generation equal to 0.0005 [84], [87], statistical significance was assessed with 10000 simulations carried out with values of h C -{10; 1; 0.5; 0.1} corresponding respectively to a pre-bottleneck effective population size of 5000, 500, 250 and 50.
The second method makes use of a Wilcoxon’s signed rank test to compare the distribution of the heterozygosity expected under mutation-drift equilibrium and under HWE and can detect recent genetic bottlenecks over the past 4 Ne or 2 Ne generations [88].
The third method is a mode-shift test, which searches for bottleneck-induced and transient distortions of allele frequency distributions over the past few dozen generations [89]. The last two methods were performed using the softwareBOTTLENECK[90]
and a Two-Phase Mutation Model (TPM) [86] consisting of 95% of Stepwise Mutation Model (SMM) [91] and 5% of Infinite Allele Model (IAM) [92] with a variance of 12% among multi-steps, as recommended in [90], and 10000 iterations.
Results
Hardy-Weinberg Equilibrium, Linkage Disequilibrium and Null Alleles
Out of a total of 149 tests for heterozygote deficiency, only the population KCHB for the locus SFb5 showed heterozygote
deficiency (P,0.05), after controlling both the FWER and the FDR. Heterozygosity excess was never detected in any population and any locus. Further, the LD test showed no statistical significance for all the 666 tests between pairs of loci indicating an independent segregation of loci. The locus SFb5 for the population KCHB showed a relatively high percentage of null alleles (21%). However, the percentage of null alleles for SFb5 on average across the 15 local populations was only 4.5%. In total, null allele frequency estimates ranged from 0.6% to 4.5% with 2.5% on average across loci. The estimation of FSTboth using and
without using the ENA correction method gave equal results; FST not using ENA
= FSTusing ENA = 0.0524 with the respective 95% CI
[0.039–0.072] and [0.038–0.073]. Classical measures of popula-tion differentiapopula-tion are only slightly biased with a null allele frequency ranging between 5% and 8% on average across loci [50], [93]. Given that the average percentage of null allele frequency across loci (2.5%) is lower than 5%, and that the estimation of FSTdid not vary after excluding null alleles, all loci
were kept for further statistical analyses. Within-Population Genetic Diversity
In total, 109 different alleles were scored in the 351 genotyped individuals. Mean rarefied allelic richness per locus and per population averaged 4.14 (60.02 SE) for a standardized sample size of n = 20 gene copies and 2.77 (60.01 SE) alleles per locus and per population for a standardized sample size of n = 6 gene copies (Table 2). Mean rarefied private allelic richness per locus and per population averaged 0.15 (60.005 SE) (Table 2). The mean observed heterozygosity (HO= 0.57860.017 SE) was not
signifi-cantly different from the mean expected heterozygosity under
HWE (HE= 0.59560.016 SE) (P.0.05) (Table 2). The overall
mean inbreeding coefficient (FIS= 0.029) was not significantly
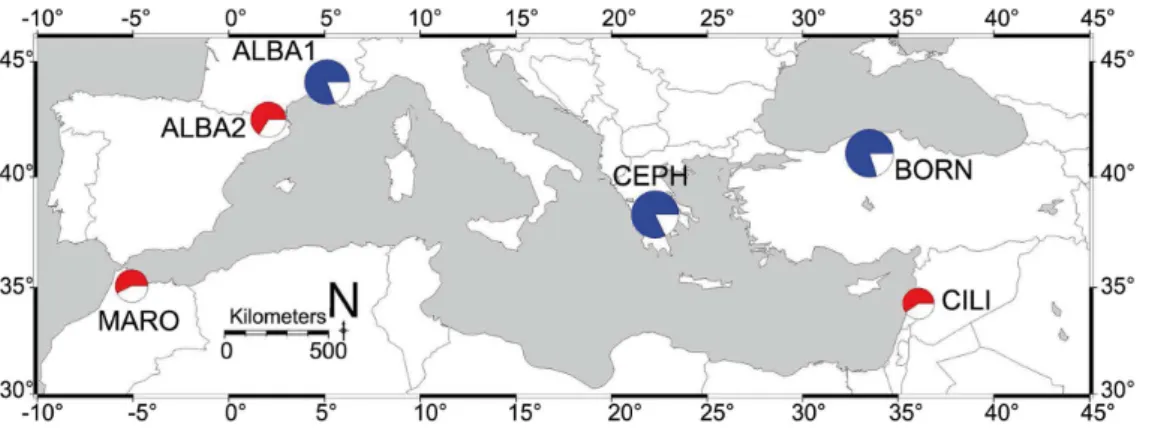
different from zero with the 99% CI [20.024–0.090] (Table 2). Permutation tests showed that A. cilicica was significantly less genetically diverse (P,0.001) and had significantly less allelic richness (P,0.001) than the studied northern Mediterranean fir species (A. alba, A. bornmuelleriana and A. cephalonica) (Figure 2, Table 2). Despite being significantly less genetically diverse (P,0.01) and significantly less rich in alleles (P,0.01) than A. alba populations from the French Pyrenees and the French Southern Alps, no significant difference was observed for gene diversity and rarefied allelic richness between populations of A. alba from the Pyrenees and A. cilicica from Lebanon (P.0.05) (Figure 2, Table 2). Similarly, A. cilicica and A. marocana were not significantly different in both gene diversity and rarefied allelic richness (P.0.05) (Figure 2, Table 2).
Among-Population Genetic Differentiation
The among-population genetic differentiation based on allele identities (FST) and on allele sizes (RST) averaged 0.0536 (P = 0) and
0.0374 (P = 0), respectively, across all loci. Allele size permutation tests showed that the observed value of RST computed before
randomization was not significantly different from the RST
obtained after allele size permutation (pRST) (P = 0.43). Therefore,
strict stepwise mutations did not contribute to among-population differentiation and no phylogeographic pattern was detected.
The Bayesian analysis of population structure inSTRUCTUREand
calculation of DK from theSTRUCTUREoutput produced a modal value near 100 of the statistic at K = 2, thus indicating that the
uppermost hierarchical level detected by STRUCTURE was two
distinct genetic clusters. The Bayesian analysis of population structure inBAPSsplit the 15 local populations into two genetically distinct groups with a posterior probability of 0.95: 11 populations (KCHB, BTJF, CHIR, JBMD, MKTF, NBSH, QJRN, QEMN,
HNKT, HNKF and GHAB) were grouped into a single deme (deme 1) while the other 4 populations (QARS, HKYT, KMHR and EHDN) formed another deme (deme 2). Because of their geographic distribution, throughout this paper, the demes 1 and 2 are referred to as ‘‘Northeastern ridge’’ and ‘‘Southwestern ridge’’ respectively.
The permutation test of populations performed in FSTAT
revealed significant differences among demes. Notably, the Southwestern ridge had significantly lower allelic richness (P,0.001), had significantly lower gene diversity (P,0.01), but significantly higher differentiation (P,0.05) than the Northeastern ridge (Table 3). The total genetic diversity of each deme, however, was not significantly different and neither was FIS (P.0.05)
(Table 3). Additionally, RST was not significantly different from
pRSTfor each deme (P.0.05), thus, no phylogeographic pattern
was detected within the Northeastern ridge and within the Southwestern ridge (Table 3).
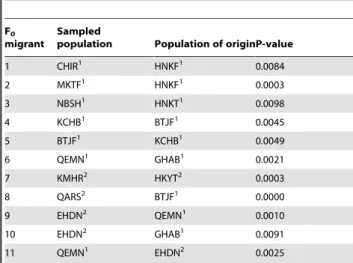
The likelihood-based Bayesian assignment test performed within GENECLASS2 allowed the detection of 11 first-generation migrants among the 15 remnant populations of A. cilicica in Lebanon (P,0.01) (Table 4). Gene flow within the Northeastern ridge was pronounced with a total of 6 F0migrants, although only
one F0 migrant was detected within the Southwestern ridge.
Among-deme gene flow was asymmetrical: more gene flow from the Northeastern ridge towards the Southwestern ridge (3 F0
migrants) and less gene flow from the Southwestern ridge towards the Northeastern ridge (1 F0 migrant) (Figure 3). Dispersal
occurred not only between neighboring populations, but also between distant populations at distance intervals comprised between 10 Km and 20 Km. Dispersal was not observed between the two most distant local populations, i.e. KCHB and EHDN. Isolation-By-Distance
Isolation-by-distance (IBD) assessed over all populations was significant (Mantel test, P,0.01). However, the strength of the IBD was weak, with the RMA explaining only 5% of the variance in the whole distribution area (r = 20.2248; R2= 0.05) (Figure 4), thus implying non-equilibrium conditions between dispersal and genetic drift. The weak strength of IBD and the lack of phylogeographic patterns further implied a recent isolation of local populations. No pattern of IBD was detected within the
Figure 2. Genetic variation ofAbies cilicicaand other Mediterranean Abiesspecies. Pie charts are used to depict the gene diversity corrected for sample size [55], [56] and the rarefied allelic richness [57], [58], averaged over 10 nuclear microsatellite loci, for A. cilicica in Lebanon (CILI), A. bornmuelleriana in Turkey (BORN), A. cephalonica in Greece (CEPH), A. alba in the French Southern Alps (ALBA1), A. alba in the French Pyrenees (ALBA2), and A. marocana in Morocco (MARO). Diameter of pie charts is relative to the correspondent rarefied allelic richness of the species. Proportion of red or blue color within pie charts is relative to the correspondent gene diversity of the species. Blue and red colors are employed to separate the studied fir populations into a group with significant lower genetic variation (red pie charts), and a group with significant higher genetic variation (blue pie charts) based on 10000 permutations of populations among groups performed inFSTATversion 2.9.3.2 [54].
doi:10.1371/journal.pone.0090086.g002
Table 2. Genetic variation and genetic distinctiveness of Abies cilicica and other Mediterranean Abies species.
Code HO HE AR (20) AR (6) s FIS KCHB 0.568 0.616 4.95 3.04 0.18 0.079 BTJF 0.582 0.607 4.40 2.9 0.24 0.042 CHIR 0.629 0.631 4.57 2.95 0.05 0.005 JBMD 0.615 0.629 4.57 2.93 0.14 0.023 MKTF 0.561 0.612 4.32 2.85 0.22 0.086 NBSH 0.567 0.572 4.02 2.67 0.10 0.010 QARS 0.448 0.497 3.23 2.34 0.24 0.103 QJRN 0.609 0.598 4.39 2.83 0.35 20.019 QEMN 0.603 0.585 4.33 2.78 0.18 20.031 HNKT 0.665 0.611 4.09 2.77 0.08 20.094 HNKF 0.621 0.619 4.47 2.91 0.20 20.004 GHAB 0.579 0.625 4.45 2.90 0.22 0.075 HKYT 0.558 0.600 3.21 2.56 0 0.072 KMHR 0.621 0.599 3.45 2.67 0 20.037 EHDN 0.446 0.522 3.67 2.53 0.01 0.149 Mean 0.578 0.595 4.14 2.77 0.15 0.029 MARO 0.405 0.572 - 2.86 - -BORN 0.668 0.799 - 4.22 - -CEPH 0.713 0.821 - 4.17 - -ALBA1 0.663 0.808 - 3.93 - -ALBA2 0.640 0.662 - 3.08 - -HOobserved heterozygosity per population averaged over loci; HEexpected
heterozygosity corrected for sample size averaged over loci [55], [56]; AR (20)
rarefied allelic richness for a sample size of 20 gene copies averaged over loci [57], [58]; AR (6)rarefied allelic richness for a sample size of 6 gene copies
averaged over loci [57], [58]; srarefied private allelic richness for a sample size
of 20 gene copies averaged over loci [57], [60]; FISinbreeding coefficient [59].
MARO refers to Abies marocana in Morocco, BORN to Abies bornmuelleriana in Turkey, CEPH to Abies cephalonica in Greece, ALBA1 to Abies alba in the French Southern Alps and ALBA2 to Abies alba in the French Pyrenees. Other codes refer to Abies cilicica in Lebanon (See Tables 1 and S1).
Northeastern ridge (P = 0.1568) and within the Southwestern ridge (P = 0.0834).
Genetic Bottlenecks
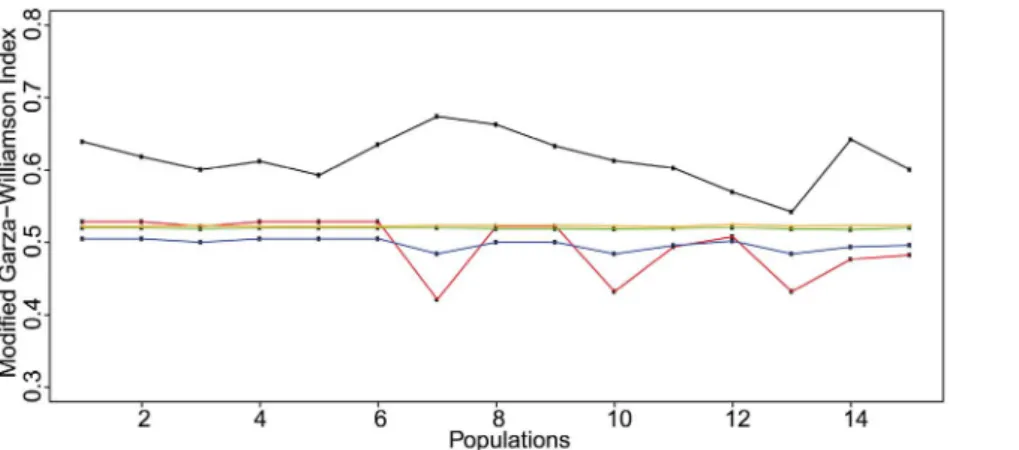
The observed values of the Garza-Williamson indices ranged between 0.54 and 0.67. However, there was no statistical evidence of a recent and severe genetic bottleneck. First, the observed M-ratios were not significantly lower than the simulated equilibrium distribution of M for all the different pre-bottleneck h values (P.0.05). Second, the bottleneck threshold values, calculated for all the pre-bottleneck h values, were significantly lower than the observed M-ratios (P,0.05) (Figure 5). The Wilcoxon’s signed rank test revealed recent heterozygosity excess in only 4
populations (MKTF, P,0.05; QARS, P,0.01; HNKT,
P,0.001; and KMHR, P,0.05). However, for each local population, the mode-shift test detected the typical L-shaped allele frequency distribution of non-bottlenecked populations at mutation-drift equilibrium (Figure 6). We concluded, for the 3 different tests, that no recent and severe genetic bottleneck was evident for any local population.
Discussion
A. cilicica in Lebanon revealed low within-population genetic diversity (0.59560.016 SE), low allelic richness (2.7760.01 SE), compared to other Abies species, and low among-population Table 3. Genetic variation, population structure and phylogeography in the Northeastern and Southwestern ridges.
HO HE AR HT FIS FST RST pRST Northeastern ridge 0.595 ** 0.609** 4.413*** 0.631NS 0.023NS 0.038* 0.018NS 0.024NS Southwestern ridge 0.521 ** 0.556** 3.389*** 0.594NS 0.064NS 0.081* 0.0731NS 0.0858NS
HOobserved heterozygosity per deme [76]; HEexpected heterozygosity per deme and corrected for sample size [76]; ARrarefied allelic richness per deme for a sample
size of 102 gene copies [57], [58]; HToverall gene diversity per deme [76]; FISinbreeding coefficient per deme [59]; FSTgenetic differentiation per deme based on allele
identity [59]; RSTgenetic differentiation per deme based on allele size [63], [64]; pRSTpermuted RSTafter allele size permutation test [65]. Columns 1 to 6 indicate the
statistical differences in genetic variation and population structure between populations of the Northeastern ridge and populations of the Southwestern ridge. Columns 7 and 8 indicate the results of the test of phylogeographic patterns corresponding to the statistical differences between RSTand pRSTwithin the Northeastern ridge and
within the Southwestern ridge. * P,0.05; ** P,0.01; *** P,0.001.NS
Non-Significant test. doi:10.1371/journal.pone.0090086.t003
Figure 3. Asymmetric Northeast-Southwest migration ofAbies cilicicain Lebanon. The Northeastern and Southwestern ridges correspond to the two genetically-distinct demes assigned byBAPS[71]. Populations of the Northeastern ridge are plotted in green color while those of the
Southwestern ridge are plotted in magenta color. A likelihood-based Bayesian assignment test [79] performed in GENECLASS2 [77] allowed the detection, in the Southwestern ridge, of 3 F0migrants originating from the Northeastern ridge. It has also allowed the detection, in the Northeastern
ridge, of 1 F0migrant originating from the Southwestern ridge, suggesting an asymmetric Northeast-Southwest migration.
genetic differentiation (FST= 0.0536; RST= 0.0374). Populations
were not inbred and showed no signal of a recent and severe genetic bottleneck. Despite the low spatial genetic structure inferred from classical genetic differentiation parameters, popula-tions showed a significant genetic divergence, forming two demes, the Northeastern and Southwestern ridges. Additionally, despite their isolation-by-distance, populations were capable of long-distance dispersal. We discuss in the following sections how these contradictory features may have emerged and their effect on the
persistence of A. cilicica in Lebanon. We finally discuss the implications of these results for conservation.
A Lower Within-Population Genetic Diversity than Expected
Previous comparative studies between Abies species in the Mediterranean, using allozymes and chloroplast microsatellites [2], [3], have respectively shown that A. cilicica in Turkey and Syria harbor high values of heterozygosity. High levels of genetic variation have also been found for A. cephalonica and A. bornmuelleriana in numerous studies [2–5], and were further supported in our study. Contrary to its geographical position in the Eastern Mediterranean and its life-history traits as a conifer species, our results have shown that A. cilicica in Lebanon revealed unexpected low within-population genetic diversity and low allelic richness. Particularly, this low genetic variation was not signifi-cantly different from the genetic variation of A. marocana in the Moroccan Rif and A. alba in the French Pyrenees. Previous studies have also reported low genetic variation in A. marocana [2], [3]. The significant lower genetic variation found in A. alba in the French Pyrenees with respect to A. alba in the French Southern Alps is also consistent with a previous study [6]. Particularly, A. alba in the Pyrenees is isolated within a glacial refugium and highly differentiated from the rest of its range [7]. The low genetic variation detected in A. alba in the Pyrenees might be the result of their exposure to a historic severe genetic bottleneck [8].
The low genetic variation of A. cilicica in Lebanon might be explained by the historical timber use during the Ancient Egyptian New Kingdom’s rule over Phoenicia [36] and more recently during World War II [37], and by current severe illegal logging and overgrazing activities, resulting in strong habitat fragmenta-tion. In this context, the absence of signatures of recent and severe genetic bottlenecks is unexpected and so is the high recent effective population size of A. cilicica in Lebanon. The low genetic variation might have been shaped over time by a rather long-term than a short-term low effective population size. One probable cause of this might be the temporal fluctuation in population sizes [22], [23], which can be typical of populations situated at the margins of geographic distributions [94]. It might also be the result of temporal variation in mating system dynamics, which can be typical of conifer species with dynamic mating systems [95], [96]. It might as well be the result of the founder effect mediated by local extinction and recolonizations in a metapopulation context Table 4. First-generation migrants among populations and
among demes.
F0
migrant
Sampled
population Population of originP-value 1 CHIR1 HNKF1 0.0084 2 MKTF1 HNKF1 0.0003 3 NBSH1 HNKT1 0.0098 4 KCHB1 BTJF1 0.0045 5 BTJF1 KCHB1 0.0049 6 QEMN1 GHAB1 0.0021 7 KMHR2 HKYT2 0.0003 8 QARS2 BTJF1 0.0000 9 EHDN2 QEMN1 0.0010 10 EHDN2 GHAB1 0.0091 11 QEMN1 EHDN2 0.0025 This table corresponds to the results of the likelihood-based Bayesian assignment test [79] performed withinGENECLASS2 [77] allowing the detection of first-generation (F0) migrants within and between the Northeastern and
Southwestern ridges. The probability computation at the 1% significance level was performed using the Monte Carlo resampling method of [78] with 10000 simulated individuals. Rows 1 to 6 correspond to recent dispersal between populations of the Northeastern ridge (6 F0migrants) while row 7 corresponds
to recent dispersal between populations of the Southwestern ridge (1 F0
migrant). Recent dispersal between both the Northeastern and Southwestern ridges is represented in rows 8 to 11 (4 F0migrants). See Tables 1 and S1 for
codes.
1
membership of the local population to deme 1 (Northeastern ridge).
2
membership of the local population to deme 2 (Southwestern ridge). doi:10.1371/journal.pone.0090086.t004
Figure 4. Isolation-by-distance and non-equilibrium conditions between dispersal and genetic drift. The logarithm of genetic similarity is plotted against the logarithm of geographic distance among population pairs [26]. Estimations of slope, intercept and R2of the relationships were calculated using Reduced Major Axis (RMA) regression [83]. The RMA regression explained only 5% of the variance in the whole distribution area of Abies cilicica in Lebanon. Analysis was performed inIBDWS[81].
[24]. Nevertheless, the genetic imprint of recent founder events within these populations might have been rapidly masked by gene flow [28], and particularly by long-distance dispersal.
A Significant Genetic Structure despite Low FST
Despite the low observed value of FST, the Bayesian clustering
methods detected two genetically distinct, but highly admixed demes, the Northeastern and Southwestern ridges. Populations of the Southwestern ridge inhabited the smallest habitat patches and occupied the southernmost part of the distribution area. Popula-tions of the Southwestern ridge were significantly less genetically diverse, had significantly less allelic richness, but were significantly more genetically differentiated than populations of the Northeast-ern ridge. Despite these differences, the NortheastNortheast-ern and Southwestern ridges shared similar ecological attributes. Both demes occupied a similar elevation range, between ca. 1000 and 1800 m.a.s.l. Neither deme showed inbreeding or sub-population structure. Both demes preserved the same amount of total genetic diversity (HT), and were capable of short-distance and
long-distance dispersal. The recent large effective population size and the weak IBD pattern suggest an outperformance of migration
over genetic drift. Consequently, genetic drift may not be the leading evolutionary force for population differentiation in A. cilicica from Lebanon. In the latter case, FSTmay not be accurate
[97] and molecular measures of genetic diversity may weakly predict quantitative genetic variation [98].
High Dispersal Ability and Persistence despite Geographic Marginality
Similarly to many tree species, the genetic structure of A. cilicica in Lebanon may result from rapid colonization where both long-distance and short-long-distance dispersal are key demographic processes [15], [99], [100]. We define the observed migration type found in A. cilicica from Lebanon as a recent rear-edge migration with both recent colonization balancing local extinctions and recent range expansion along altitudinal gradients. Consid-ering that brief episodes of range expansions are thought to leave strong and persistent signature on the genetic structure of natural populations [101], the Northeast-Southwest structure of A. cilicica in Lebanon suggests two plausible demographic processes promoting persistence.
Figure 5. Observed and simulated values of the modified Garza-Williamson index forAbies cilicicapopulations. This figure shows the different observed values of the M-ratios calculated for the microsatellite loci and the values of the simulated critical M threshold (Mc) below which a
bottleneck is evident. The observed M-ratio values are displayed in black solid line. The Mcvalues calculated for h = 10, h = 1, h = 0.5, and h = 0.1 are
respectively displayed in red, blue, green and orange solid lines. All the observed M-ratio values were significantly higher than the simulated Mc
values for different pre-bottleneck h values. Values of the M-ratio and the Mcparameters were obtained usingM-P-Val andCritical_M[84].
doi:10.1371/journal.pone.0090086.g005
Figure 6. Allele frequency distribution over different allele frequency classes for each population ofAbies cilicica. This figure shows the distribution of allele frequencies across the 15 local populations. The values were obtained using the mode-shift test [89]. The distribution of allele frequencies across the 15 local populations is plotted using different colors. All populations showed a higher abundance of rare alleles (frequency,0.1) than alleles at intermediate frequencies (0.1–0.2).
First, the Northeast-Southwest structure might result from recent colonization balancing local extinctions. The likelihood-based Bayesian assignment test detected an emigration rate from the Northeastern ridge exceeding three-fold that from the Southwestern ridge (Figure 3). Although, this asymmetric migra-tion might be a simple consequence of the smaller size of the Southwestern ridge, gene flow from more genetically diverse populations may counteract drift and contribute to restoring genetic diversity in populations of the Southwestern ridge (e.g. QARS and EHDN), thus making persistence possible.
Second, the Northeast-Southwest structure might also result from recent range expansion along altitudinal gradients. Private alleles in both the Northeastern and Southwestern ridges could indicate the presence of different glacial microrefugia in both demes (Table 2). In the Northeastern ridge, more or less all local populations harbored private alleles, both at low and high elevations, suggesting multiple low-elevation and high-elevation microrefugia. The higher genetic diversity of Northeastern ridge populations might result from the mixing of these different microrefugial lineages along mountain slopes during recoloniza-tion. In the Southwestern ridge, high private allelic richness was only found in low-elevation population QARS. Other Southwest-ern ridge populations, located at higher elevations, harbored either no private alleles (HKYT and KMHR) or very few private alleles (EHDN), suggesting a postglacial colonization from QARS upwards. Range expansion along altitudinal gradients may have occurred concomitantly or at different time scales from the Northeastern-Southwestern asymmetric migration described ear-lier. Microrefugial populations may be crucial for predicting climate-change-related range shifts of tree species [102], and particularly, altitudinal range shifts may be an efficient mechanism for populations to cope with changing environmental and/or climatic conditions. A recent meta-analysis study showed that the distribution of species had recently shifted to higher elevations at an average rate of 11 meters per decade [103].
Implications for Conservation
Because they contain most of the genetic diversity of A. cilicica in Lebanon, and have shaped current diversity via long-distance migration and altitudinal range shifts, all local populations of the Northeastern ridge as well as QARS of the Southwestern ridge have disproportionate conservation importance. The very low census size of QARS and its location on the lowest elevation warrant special attention. Conserving other Southwestern ridge populations (such as EHDN) would also be useful as they are stepping stones for gene flow between the two demes. EHDN is an interesting example for highlighting conservation challenges. A mixed fir/cedar population, EHDN has been managed as a nature reserve since 1992. The low number of surviving fir trees in this nature reserve as well as their low genetic variation suggest that a change of strategy is needed if conserving the genetic diversity of A. cilicica is a target for management. Dynamic conservation of genetic diversity [104] in situ requires that a particular attention should be given to regeneration and to avoid introducing seeds or seedlings from exotic locations outside demes or farther away. Attention should be given to keeping gene flow between the Northeastern and Southwestern ridges at reasonable rates. This
can be potential through maintaining historic-likewise levels of gene flow by (1) preserving the natural ecological corridor between the Northeastern and Southwestern ridges, and (2) preserving a buffer zone across each local population to facilitate the natural recolonization of local populations over unoccupied habitat patches. For local populations with very low census size and genetic diversity, ex situ conservation (e.g. establishing seed banks and clonal archives) or assisted migration to suitable locations where future climate should be favorable to A. cilicica is strongly advisable.
Conclusions
The population genetic diversity and structure of A. cilicica in Lebanon is at odds with biogeographical and life history trait expectations. Rather, demographic processes linked to current habitat fragmentation and geographic range structure, and to original historical range contraction and recolonization better explain genetic diversity. A. cilicica in Lebanon is made of two demes moderately connected by geneflow shaping a weak isolation-by-distance pattern. Persistence of A. cilicica in Lebanon was linked to two plausible demographic processes, occurring concurrently or sequentially, which we called rear-edge type migration: (1) alternating colonization and extinction events and (2) range shifts along altitudinal gradients. These two demographic events might help us better understand the species response to expected climate change. Populations of the Northeastern and Southwestern ridges might harbor a large evolutionary potential, and should be consequently prioritized for conservation. Supporting Information
Table S1 Origin, location sample size ofAbies cilicica
and other Mediterranean Abies species. Legend: Origin,
location, and sample size of the 15 populations of Abies cilicica in Lebanon and other Mediterranean Abies species. Altitude is in meters above sea level ( m.a.s.l.) and the surface of the sampled populations of Abies cilicica in Lebanon is in hectares. N.B. Surface is not indicative of population density.
(XLS)
Acknowledgments
The authors would like to thank all of those who assisted in sampling the fir populations in Lebanon and Morocco. We are grateful to the National Council for Scientific Research-Lebanon as well as the municipalities of Fnaydeq and Bqaa Safrine in Lebanon for the logistics support. We also would like to thank Matthieu Lingrand (INRA-URFM) for the technical support in the laboratory. This is an ISEM contribution number ISEM 2013-182.
Author Contributions
Conceived and designed the experiments: RC CK LA. Performed the experiments: LA AR. Analyzed the data: LA BF RC. Contributed reagents/materials/analysis tools: RC LA BF. Wrote the paper: LA BF RC. Performed the field sampling: LA CK RC. Read and approved the manuscript: LA BF RC CK AR.
References
1. Billington HL (1991) Effect of population size on genetic variation in a dioecious conifer. Conserv Biol 5: 115–119.
2. Scaltsoyiannes A, Tsaktsira M, Drouzas AD (1999) Allozyme differentiation in the Mediterranean firs (Abies, Pinaceae). A first comparative study with phylogenetic implications. Plant Syst Evol 216: 289–307.
3. Liepelt S, Mayland-Quellhorst E, Lahme M, Ziegenhagen B (2010) Contrasting geographical patterns of ancient and modern genetic lineages in Mediterranean Abies species. Plant Syst Evol 284: 141–151.
4. Fady B, Conkle MT (1993) Allozyme variation and possible phylogenetic implications in Abies cephalonica Loudon and some related Eastern Mediterranean firs. Silvae Genet 42: 351–359.
5. Parducci L, Szmidt AE, Madaghiele A, Anzidei M, Vendramin GG (2001) Genetic variation at chloroplast microsatellites (cpSSRs) in Abies nebrodensis (Lojac.) Mattei and three neighboring Abies species. Theor Appl Genet 102: 733–740.
6. Fady B, Forest I, Hochu I, Ribiollet A, de Beaulieu J-L, et al. (1999) Genetic differentiation in Abies alba Mill. populations from Southeastern France. Forest Genetics 6: 129–138.
7. Konnert M, Bergmann F (1995) The geographical distribution of genetic variation of silver fir (Abies alba, Pinaceae) in relation to its migration history. Plant Syst Evol 196: 19–30.
8. Vendramin GG, Degen B, Petit RJ, Anzidei M, Madaghiele A et al. (1999) High level of variation at Abies alba chloroplast microsatellite loci in Europe. Mol Ecol 8: 1117–1126.
9. Pluess AR (2011) Pursuing glacier retreat: genetic structure of a rapidly expanding Larix decidua population. Mol Ecol 20: 473–485.
10. Conord C, Gurevitch J, Fady B (2012) Large-scale longitudinal gradients of genetic diversity: a meta-analysis across six phyla in the Mediterranean basin. Ecol Evol 2: 2600–2614.
11. Hamrick JL, Godt MJW (1989) Allozyme diversity in plant species. In: Brown AHD, Clegg MT, Kahler AL, Weir BS, editors. Plant population genetics, breeding and genetic resources. Sunderland, Massachusetts: Sinauer Press. pp. 43–63.
12. Hamrick JL, Godt MJW, Sherman-Broyles SL (1992) Factors influencing levels of genetic diversity in woody plant species. New Forests 6: 95–124. 13. Gitzendanner MA, Soltis PS (2000) Patterns of genetic variation in rare and
widespread plant congeners. Am J Bot 87: 783–792.
14. Eliades N-GH, Gailing O, Leinemann L, Fady B, Finkeldey R (2011) High genetic diversity and significant population structure in Cedrus brevifolia Henry, a narrow endemic Mediterranean tree from Cyprus. Plant Syst Evol 294: 185– 198.
15. Clark JS (1998) Why trees migrate so fast: confronting theory with dispersal biology and the paleorecord. Am Nat 152: 204–224.
16. Ibrahim KM, Nichols RA, Hewitt GM (1996) Spatial patterns of genetic variation generated by different forms of dispersal during range expansion. Heredity 77: 282–291.
17. Bialozyt R, Ziegenhagen B, Petit RJ (2006) Contrasting effects of long distance seed dispersal on genetic diversity during range expansion. J Evol Biol 19: 12– 20.
18. Slatkin M (1987) Gene flow and the geographic structure of natural populations. Science 236: 787–792.
19. Mimura M, Aitken SN (2007) Adaptive gradients and isolation-by-distance with postglacial migration in Picea sitchensis. Heredity 99: 224–232. 20. Mimura M, Aitken SN (2010) Local adaptation at the range peripheries of
Sitka spruce. J Evol Biol 23: 249–258.
21. Young A, Boyle T, Brown T (1996) The population genetic consequences of habitat fragmentation for plants. Tree 11: 413–418.
22. Pimm SL, Gittleman JL, McCracken GF, Gilpin ME (1989) Plausible alternatives to bottlenecks to explain reduced genetic diversity. Trends Ecol Evol 4: 176–178.
23. Cornuet J-M, Luikart G (1996) Description and power analysis of two tests for detecting recent population bottlenecks from allele frequency data. Genetics 144: 2001–2014.
24. Gilpin M (1991) The genetic effective size of a metapopulation. Biol J Linn Soc Lond 42: 165–175.
25. Wright S (1943) Isolation by distance. Genetics 38: 114–138.
26. Slatkin M (1993) Isolation by distance in equilibrium and non-equilibrium populations. Evolution 47: 264–279.
27. Wade MJ, McCauley DE (1988) Extinction and recolonization: their effects on the genetic differentiation of local populations. Evolution 42: 995–1005. 28. Whitlock MC (1992) Temporal fluctuations in demographic parameters and
the genetic variance among populations. Evolution 46: 608–615.
29. Lande R (1992) Neutral theory of quantitative genetic variance in an island model with local extinction and colonization. Evolution 46: 381–389. 30. Fady-Welterlen B (2005) Is there really more biodiversity in Mediterranean
forest ecosystems?.Taxon 54: 905–910.
31. Petit RJ, Hampe A, Cheddadi R (2005) Climate changes and tree phylogeography in the Mediterranean. Taxon 54: 877–885.
32. Petit RJ, Aguinagalde I, de Beaulieu J-L, Bittkau C, Brewer S, et al. (2003) Glacial refugia: hotspots but not melting pots of genetic diversity. Science 300: 1563–1565.
33. Hewitt G (2000) The genetic legacy of the Quaternary ice ages. Nature 405: 907–913.
34. Hampe A, Petit RJ (2005) Conserving biodiversity under climate change: the rear edge matters. Ecol Lett 8: 461–467.
35. Fady B, Conord C (2010) Macroecological patterns of species and genetic diversity in vascular plants of the Mediterranean basin. Diversity and Distributions 16: 53–64.
36. Bardinet T (2008) Relations e´conomiques et pressions militaires en Me´diterra-ne´e orientale et en Libye au temps des Pharaons. Histoire des importations e´gyptiennes des re´sines et des conife`res du Liban et de la Libye depuis la pe´riode archaı¨que jusqu’a` l’e´poque ptole´maı¨que. In: Cybele, editor. Paris: Etudes et me´moires d’e´gyptologie. 337p.
37. Mikesell MW (1969) The deforestation of Mount Lebanon. Geogr Rev 59: 1– 28.
38. Gardner M, Knees S (2013) Abies cilicica. In: IUCN 2013. IUCN Red List of Threatened Species Version 2013.1. Available: http://bit.ly/1bKIa6C. Accessed 18 September 2013.
39. MOA DRDNR (2005) National forest and tree assessment and inventory TCP/LEB/2903. FAO. Available: http://bit.ly/1a9yJkQ. Accessed 19 March 2013.
40. Selkoe KA, Toonen RJ (2006) Microsatellites for ecologists: a practical guide to using and evaluating microsatellite markers. Ecol Lett 9: 615–629. 41. Balloux F, Lugon-Moulin N (2002) The estimation of population differentiation
with microsatellite markers. Mol Ecol 11: 155–165.
42. Hansen OK, Vendramin GG, Sebastiani F, Edwards KJ (2005) Development of microsatellite markers in Abies nordmanniana (Stev.) Spach and cross-species amplification in the Abies genus. Mol Ecol Notes 5: 784–787.
43. Cremer E, Liepelt S, Sebastiani F, Buonamici A, Michalczyk IM, et al. (2006) Identification and characterization of nuclear microsatellite loci in Abies alba Mill. Mol Ecol Notes 6: 374–376.
44. Amos W, Hoffman JI, Frodsham A, Zhang L, Best S, et al. (2007) Automated binning of microsatellite alleles: problems and solutions. Mol Ecol Notes 7: 10– 14.
45. Guichoux E, Lagache L, Wagner S, Chaumeil P, Le´ger P, et al. (2011) Current trends in microsatellite genotyping. Mol Ecol Resour 11: 591–611. 46. Raymond M, Rousset F (1995) GENEPOP(version 1.2): Population genetics
software for exact tests and ecumenicism. J Hered 86: 248–249.
47. Rousset F (2008)GENEPOP’007: a complete re-implementation of the genepop software for Windows and Linux. Mol Ecol Resour 8: 103–106.
48. Rice WR (1989) Analyzing tables of statistical tests. Evolution 43: 223–225. 49. Benjamini Y, Hochberg Y (1995) Controlling the False Discovery Rate: a
practical and powerful approach to multiple testing. J R Stat Soc Series B Stat Methodol 57: 289–300.
50. Chapuis M-P, Estoup A (2007) Microsatellite null alleles and estimation of population differentiation. Mol Biol Evol 24: 621–631.
51. Dempster AP, Laird NM, Rubin DB (1977) Maximum Likelihood from incomplete data via the EM algorithm. J R Stat Soc Series B Stat Methodol 39: 1–38.
52. Weir BS (1996) Genetic data analysis II. Sunderland, Massachusetts: Sinauer Associates, Inc. 445 p.
53. Peakall R, Smouse PE (2006)GenAlEx 6: genetic analysis in Excel. Population genetic software for teaching and research. Mol Ecol Notes 6: 288–295. 54. Goudet J (1995)FSTAT (Version 1.2): A computer program to calculate
F-statistics. J Hered 86: 485–486.
55. Nei M (1978) Estimation of average heterozygosity and genetic distance from a small number of individuals. Genetics 89: 583–590.
56. Hartl DL, Clark AG (1997) Principles of population genetics, 3rd edition. Sunderland, Massachusetts: Sinauer Associates, Inc. 542 p.
57. Hurlbert SH (1971) The nonconcept of species diversity: a critique and alternative parameters. Ecology 52: 577–586.
58. El Mousadik A, Petit RJ (1996) High level of genetic differentiation for allelic richness among populations of the argan tree [Argania spinosa (L.) Skeels] endemic to Morocco. Theor Appl Genet 92: 832–839.
59. Weir BS, Cockerham CC (1984) Estimating F-statistics for the analysis of population structure. Evolution 38: 1358–1370.
60. Kalinowski ST (2004) Counting alleles with rarefaction: private alleles and hierarchical sampling designs. Conserv Genet 5: 539–543.
61. Kalinowski ST (2005) HP-RARE 1.0: a computer program for performing rarefaction on measures of allelic richness. Mol Ecol Notes 5: 187–189. 62. Hardy OJ, Vekemans X (2002) SAPGeDi: a versatile computer program to
analyse spatial genetic structure at the individual or population levels. Mol Ecol Notes 2: 618–620.
63. Slatkin M (1995) A measure of population subdivision based on microsatellite allele frequencies. Genetics 139: 457–462.
64. Michalakis Y, Excoffier L (1996) A generic estimation of population subdivision using distances between alleles with special reference for microsatellite loci. Genetics 142: 1061–1064.
65. Hardy OJ, Charbonnel N, Fre´ville H, Heuertz M (2003) Microsatellite allele sizes: a simple test to assess their significance on genetic differentiation. Genetics 163: 1467–1482.
66. Pritchard JK, Stephens M, Donnelly P (2000) Inference of population structure using multilocus genotype data. Genetics 155: 945–959.
67. Falush D, Stephens M, Pritchard JK (2003) Inference of population structure using multilocus genotype data: linked loci and correlated allele frequencies. Genetics 164: 1567–1587.
68. Pritchard JK, Wen X, Falush D (2010) Documentation for STRUCTURE software: version 2.3. Available: http://stanford.io/1dGRJYQ. Accessed 26 April 2012.
69. Earl DA, vonHoldt BM (2011)STRUCTURE HARVESTER: a website and program for visualizingSTRUCTURE output and implementing the Evanno method. Conserv Genet Resour 4: 359–361.
70. Evanno G, Regnaut S, Goudet J (2005) Detecting the number of clusters of individuals using the softwareSTRUCTURE: a simulation study. Mol Ecol 14: 2611–2620.
71. Corander J, Cheng L, Marttinen P, Sire´n J, Tang J (2013) BAPS: Bayesian Analysis of Population Structure. Manual v.6.0. Available: http://bit.ly/ 1eAKi4e. Accessed 20 February 2013.
72. Corander J, Waldmann P, Sillanpa¨a¨ MJ (2003) Bayesian analysis of genetic differentiation between populations. Genetics 163: 367–374.
73. Corander J, Sire´n J, Arjas E (2008) Bayesian spatial modeling of genetic population structure. Computational Statistics 23:111–129.
74. Rodrı´guez-Ramilo ST, Toro MA, Ferna´ndez J (2009) Assessing population genetic structure via the maximisation of genetic distance. Genet Sel Evol 41:49.
75. Corander J, Marttinen P, Ma¨ntyniemi S (2006) Bayesian identification of stock mixtures from molecular marker data. Fishery Bulletin 104: 550–558. 76. Nei M (1987) Molecular evolutionary genetics. New York: Columbia
University Press. 512 p.
77. Piry S, Alapetite A, Cornuet J-M, Paetkau D, Baudouin L, et al. (2004) GENECLASS2: a software for genetic assignment and first-generation migrant detection. J Hered 95: 536–539.
78. Paetkau D, Slade R, Burden M, Estoup A (2004) Genetic assignment methods for the direct, real-time estimation of migration rate: a simulation-based exploration of accuracy and power. Mol Ecol 13: 55–65.
79. Rannala B, Mountain JL (1997) Detecting immigration by using multilocus genotypes. Proc Natl Acad Sci U S A 94: 9197–9201.
80. Cornuet J-M, Piry S, Luikart G, Estoup A, Solignac M (1999) New methods employing multilocus genotypes to select or exclude populations as origins of individuals. Genetics 153: 1989–2000.
81. Jensen JL, Bohonak AJ, Kelley ST (2005) Isolation by distance, web service. BMC Genetics 6: 13.
82. Manly BFJ (1994) Multivariate statistical methods: a primer, 2nd edition. New York: Chapman and Hall.
83. Hellberg ME (1994) Relationships between inferred levels of gene flow and geographic distance in a philopatric Coral, Balanophyllia elegans. Evolution 48: 1829–1854.
84. Garza JC, Williamson EG (2001) Detection of reduction in population size using data from microsatellite loci. Mol Ecol 10: 305–318.
85. Excoffier L, Estoup A, Cornuet J-M (2005) Bayesian analysis of an admixture model with mutations and arbitrarily linked markers. Genetics 169: 1727– 1738.
86. Di Rienzo A, Peterson AC, Garza JC, Valdes AM, Slatkin M, et al. (1994) Mutational processes of simple-sequence repeat loci in human populations. Proc Natl Acad Sci U S A 91: 3166–3170.
87. Estoup A, Angers B (1998) Microsatellites and minisatellites for molecular ecology: theoretical and empirical considerations. In: Carvalho G, editor. Advances in molecular ecology. Amsterdam: IOS Press. pp. 55–86. 88. Luikart G (1997) Usefulness of molecular markers for detecting population
bottlenecks and monitoring genetic change. Ph. D. Thesis. Missoula: University of Montana.
89. Luikart G, Allendorf FW, Cornuet J-M, Sherwin WB (1998) Distortion of allele frequency distributions provides a test for recent population bottlenecks. J Hered 89: 238–247.
90. Piry S, Luikart G, Cornuet J-M (1999)BOTTLENECK: a computer program for detecting recent reductions in the effective population size using allele frequency data. J Hered 90: 502–503.
91. Ohta T, Kimura M (1973) A model of mutation appropriate to estimate the number of electrophoretically detectable alleles in a finite population. Genet Res 22: 201–204.
92. Kimura M, Crow JF (1964) The number of alleles that can be maintained in a finite population. Genetics 49: 725–738.
93. Dakin EE, Avise JC (2004) Microsatellite null alleles in parentage analysis. Heredity 93: 504–509.
94. Cuervo JJ, Møller AP (2013) Temporal Variation in Population Size of European Bird Species: Effects of Latitude and Marginality of Distribution. PLoS ONE 8(10): e77654. doi:10.1371/journal.pone.0077654.
95. Cheliak WM, Dancik BP, Morgan K, Yeh FCH, Strobeck C (1985) Temporal variation of the mating system in a natural population of Jack Pine. Genetics 109: 569–584.
96. Mitton JB (1992) The dynamic mating systems of conifers. New Forests 6: 197– 216.
97. Neigel JE (2002) Is FSTobsolete?. Conserv Genet 3: 167–173.
98. Reed DH, Frankham R (2001) How closely correlated are molecular and quantitative measures of genetic variation? A meta-analysis. Evolution 55: 1095–1103.
99. Le Corre V, Machon N, Petit RJ, Kremer A (1997) Colonization with long-distance seed dispersal and genetic structure of maternally inherited genes in forest trees: a simulation study. Genet Res 69: 117–125.
100. Roques L, Hamel F, Fayard J, Fady B, Klein EK (2010) Recolonization by diffusion can generate increasing rates of spread. Theor Popul Biol 77: 205– 212.
101. Petit RJ (2011) Early insights into the genetic consequences of range expansions. Heredity 106: 203–204.
102. Feurdean A, Bhagwat SA, Willis KJ, Birks HJB, Lischke H, et al. (2013) Tree Migration-Rates: Narrowing the Gap between Inferred Post-Glacial Rates and Projected Rates. PLoS ONE 8(8): e71797. doi:10.1371/journal.pone.0071797 103. Chen I-C, Hill JK, Ohlemu¨ller R, Roy DB, Thomas CD (2011) Rapid range shifts of species associated with high levels of climate warming. Science 333: 1024–1026.
104. Koskela J, Lefe`vre F, Schueler S, Kraigher H, Olrik DC, et al. (2013) Translating conservation genetics into management: Pan-European minimum requirements for dynamic conservation units of forest tree genetic diversity. Biol Conserv 157: 39–49.
105. Alizoti PG, Fady B, Prada MA, Vendramin GG (2011)EUFORGENTechnical Guidelines for genetic conservation and use of Mediterranean firs (Abies spp.) Bioversity International, Rome, Italy. 6 p. Available: http://bit.ly/1f6VcDo. Accessed 5 September 2013.
106. QGIS Development Team (2012) QGIS Geographic Information System. Open Source Geospatial Foundation Project. Available: http://bit.ly/ 1d3UwLH. Accessed 19 July 2012.
107. Wessel P, Smith WHF (2006) New, improved version of generic mapping tools released. Eos, Transactions American Geophysical Union 79: 579–579. 108. R Development Core Team (2008) R: A language and environment for
statistical computing. R Foundation for Statistical Computing, Vienna, Austria. Available: http://bit.ly/19WExR5. Accessed 10 January 2013.
![Figure 3. Asymmetric Northeast-Southwest migration of Abies cilicica in Lebanon. The Northeastern and Southwestern ridges correspond to the two genetically-distinct demes assigned by BAPS [71]](https://thumb-eu.123doks.com/thumbv2/123doknet/13937446.451344/8.918.96.833.118.203/asymmetric-northeast-southwest-migration-northeastern-southwestern-correspond-genetically.webp)