HAL Id: hal-01605033
https://hal.archives-ouvertes.fr/hal-01605033
Submitted on 25 Apr 2018HAL is a multi-disciplinary open access archive for the deposit and dissemination of sci-entific research documents, whether they are pub-lished or not. The documents may come from teaching and research institutions in France or abroad, or from public or private research centers.
L’archive ouverte pluridisciplinaire HAL, est destinée au dépôt et à la diffusion de documents scientifiques de niveau recherche, publiés ou non, émanant des établissements d’enseignement et de recherche français ou étrangers, des laboratoires publics ou privés.
Genetic variation of loci potentially under selection
confounds species-genetic diversity correlations in a
fragmented habitat
Angeline Bertin, Nicolas Gouin, Alex Baumel, Ernesto Gianoli, Juan
Serratosa, Rodomiro Osorio, Stephanie Manel
To cite this version:
Angeline Bertin, Nicolas Gouin, Alex Baumel, Ernesto Gianoli, Juan Serratosa, et al.. Genetic varia-tion of loci potentially under selecvaria-tion confounds species-genetic diversity correlavaria-tions in a fragmented habitat. Molecular Ecology, Wiley, 2017, 26 (2), pp.431 - 443. �10.1111/mec.13923�. �hal-01605033�
Genetic variation of loci potentially under selection
confounds species-genetic diversity correlations in a
fragmented habitat
ANGELINE BERTIN1, NICOLAS GOUIN1,2,3, ALEX BAUMEL4, ERNESTO
GIANOLI1,5, JUAN SERRATOSA6, RODOMIRO OSORIO1 and STEPHANIE MANEL7
1Departamento de Biología, Universidad de La Serena, La Serena, Chile
2Centro de Estudios Avanzados en Zonas Áridas, La Serena, Chile
3Instituto de Investigación Multidisciplinar en Ciencia y Tecnología, Universidad de La
Serena, La Serena, Chile
4Institut Méditerranéen de Biodiversité et d´Ecologie marine et continentale (IMBE)
Aix Marseille Univ, Univ Avignon, CNRS, IRD, Marseille, France.
5Departamento de Botánica, Universidad de Concepción, Concepción, Chile
6Facultad de Ciencias del Mar, Doctorado en Biología y Ecología Aplicada, Universidad
Católica del Norte
7EPHE, PSL Research University, CNRS, UM, SupAgro, IRD, INRA, UMR 5175 CEFE,
F-34293 Montpellier, FRANCE
Keywords: community genetics, species-genetic diversity correlations, outlier loci, habitat
connectivity, high Andean wetlands
Corresponding Author:
Angéline Bertin
Departamento de Biología, Facultad de Ciencias, Universidad de La Serena, Av. Raúl Bitrán 1305, Casilla 554, La Serena, Chile.
Fax : (56) (51) 2 204383, electronic mail address: abertin@userena.cl;
Abstract
1
Positive species-genetic diversity correlations (SGDCs) are often thought to result from the 2
parallel influence of neutral processes on genetic and species diversity. Yet, confounding effects 3
of neutral mechanisms have not been explored. Here, we investigate the impact of non-4
neutral genetic diversity on SGDCs in high Andean wetlands. We compare correlations between 5
plant species diversity (SD) and genetic diversity (GD) calculated with and without loci 6
potentially under selection (outlier loci). The study system includes 2188 specimens from five 7
species (three common aquatic macroinvertebrate and two dominant plant species) that were 8
genotyped for 396 amplified fragment length polymorphism loci. We also appraise the 9
importance of neutral processes on SGDCs by investigating the influence of habitat 10
fragmentation features. Significant positive SGDCs were detected for all five species (mean 11
SGDC = 0.52 ± 0.05). While only a few outlier loci were detected in each species, they resulted 12
in significant decreases in GD and in SGDCs. This supports the hypothesis that neutral processes 13
drive species-genetic diversity relationships in high Andean wetlands. Unexpectedly, the effects 14
on genetic diversity of the habitat fragmentation characteristics in this study increased with the 15
presence of outlier loci in two species. Overall, our results reveal pitfalls in using habitat features 16
to infer processes driving SGDCs and show that a few loci potentially under selection are enough 17
to cause a significant downward bias in SGDC. Investigating confounding effects of outlier loci 18
thus represents a useful approach to evidence the contribution of neutral processes on species-19
genetic diversity relationships. 20
Introduction
21
Investigating spatial or temporal patterns of covariation between species diversity within a 22
community (SD) and genetic diversity within a species (GD) is one of the main objectives 23
of community genetics (Antonovics 1992). It is a key step towards a conceptual synthesis at 24
the interface between ecology and evolutionary biology (Vellend & Geber 2005). It is also 25
a core issue in conservation biology as it provides valuable information to understand and 26
predict different facets of biodiversity (Hu et al. 2009; Lavergne et al. 2010; Mouquet et al. 27
2012). 28
Studies addressing species genetic diversity correlations (SGDCs) in the wild have 29
shown that the relationship between GD and SD can take different forms depending on the 30
mechanisms at work (Kahilainen et al. 2014), with reports of positive (He et al. 2008; 31
Papadopoulou et al. 2011; Lamy et al. 2013), negative (Silvertown et al. 2009; Xu et al. 32
2016) and no correlation (Taberlet et al. 2012) between the two components. Concordant 33
spatial patterns between species and genetic diversity can emerge from various processes. 34
They may result from direct causal relationships between the two biodiversity components 35
(Vellend and Geber 2005). For instance, GD can influence SD when genetic variation of 36
habitat-forming species, such as forest trees, structures dependent communities (i.e. micro-37
organisms, fungi, arthropods and vertebrates, Whitham et al. 2006). Alternatively, SD in 38
the community can impose variable selective pressures on populations, and therefore alter 39
the levels of population GD (Strauss et al. 2005; Vellend and Geber 2005; Johnson and 40
Stinchcombe 2007; Lankau and Strauss 2007). SD and GD can become indirectly 41
associated as well, by responding similarly to common mechanisms (Vellend and Geber 42
2005). Indeed, both ecological and genetic models posit similar effects of drift and 43
migration on species and genetic diversity (e.g. depletion effects of drift and diversity 44
increases from immigration, Hu et al. 2009). Thus, concordant spatial patterns between 45
species and genetic diversity can be common under conditions of demographic stochasticity 46
and dispersal limitation (Rosenzweig 1995; Frankham 1996; Frankham 1997). To date, 47
little research has been conducted into the drivers of negative SGDCs (Xu et al. 2016). 48
According to a modeling study, negative SGDCs can occur under particular conditions of 49
high genetic mutation rates, depending on the relative importance of mutation, immigration 50
and local competition (Laroche et al. 2015). They may also occur in situations where 51
increases in SD, promoted by environmental heterogeneity, are associated with a reduction 52
in niche breadth and/or population size (Taberlet et al. 2012; Vellend et al. 2014; Xu et al. 53
2016). 54
While both neutral and selective mechanisms can generate positive covariation 55
between genetic and species diversity (Vellend and Geber 2005), evidence suggests that 56
neutral processes play a dominant role of in this respect (Odat et al. 2004; Vellend 2004; 57
Struebig et al. 2011; Papadopoulou et al. 2011; Lamy et al. 2013; Vellend et al. 2014). 58
Positive SGDCs are common in discrete habitat units like oceanic islands, lakes, or forest 59
fragments, and less frequent in arbitrarily defined spatial units such as grid cells or 60
vegetation plots (Vellend and Geber 2005; Whitlock 2014; Vellend et al. 2014). In 61
fragmented landscapes, migration and drift are likely major contributors to within-patch 62
diversity. Thus, positive SGDCs among islands and habitat patches have been postulated to 63
arise from the parallel influence of neutral processes on both species and genetic diversity 64
(Vellend and Geber 2005; Whitlock 2014; Vellend et al. 2014). This is supported by a 65
number of empirical studies, which have demonstrated that local habitat characteristics 66
influencing rates of stochastic immigration and extinction contribute markedly to species-67
genetic diversity relationships in fragmented habitats (Vellend 2005; He et al. 2008; 68
Papadopoulou et al. 2011; Lamy et al. 2013). These habitat features include habitat size, 69
connectivity and perturbation. Indeed, both habitat carrying capacity and heterogeneity are 70
expected to increase with habitat size. Larger patches can thus support larger populations, 71
which are both more genetically diverse and more resilient to genetic drift (Frankham 72
1997). In addition, by offering more diverse ecological niches, larger habitats are also 73
expected to hold more diverse communities, and are consequently less susceptible to 74
random species loss through ecological drift (MacArthur and Wilson 1967, Hubbell 2001). 75
Because habitat connectivity influences rates of migration, it is expected to result in 76
increases in both genetic and species diversity, by facilitating the introduction of new 77
alleles in a population or new species in the community (Hu et al. 2009). Regarding habitat 78
perturbation, it can cause parallel effects on species and genetic diversity by provoking 79
extinction of species and alleles irrespectively of their identities (Vellend 2003). 80
Neutral explanations for positive SGDCs have also come from the wide use of 81
presumed neutral molecular markers to estimate genetic diversity in SGDC investigations 82
(Vellend and Geber 2005; Vellend et al. 2014). Genetic variation of molecular markers 83
with supposedly no effects on fitness, such as microsatellite or amplified fragment length 84
polymorphism (AFLP) loci, is considered to mirror neutral processes, including mutation, 85
genetic drift and gene flow (Holderegger et al. 2006; Kirk and Freeland 2011). SGDCs 86
estimated with these markers have therefore been assumed to emerge from concordant 87
changes in species and genetic diversity induced by neutral processes (Vellend and Geber 88
2005; Lamy et al. 2013; Vellend et al. 2014). However, no attention has been paid to 89
confounding effects of non-neutral mechanisms, which may lead to erroneous conclusions 90
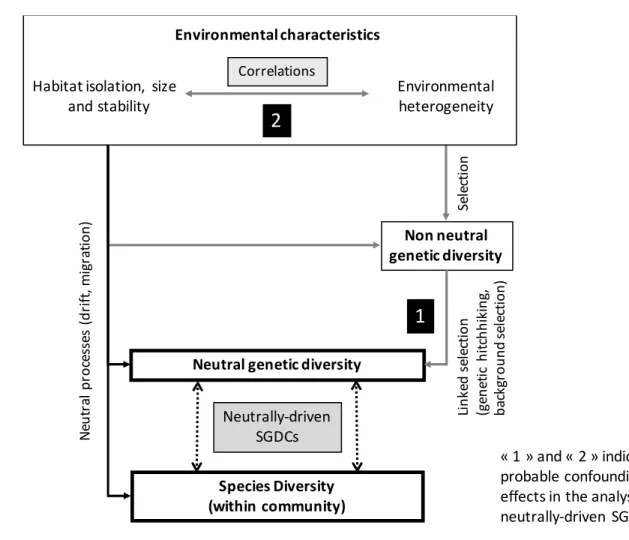
regarding the mechanisms causing SD-GD covariation (Fig. 1). Indeed, selection generates 91
changes in allele frequencies at target genes, but also in adjacent, linked regions (genetic 92
hitchhiking; Barton 2000). Such linked DNA regions, even non-coding DNA, can thus bear 93
signatures of selection (confounding effect 1 in Fig. 1; Barton 2000; Oleksyk et al. 2010). 94
When used to infer neutral processes, such loci may bias population parameter estimates 95
(Luikart et al. 2003). Their expected effects on genetic diversity depend on the type of 96
selection operating, as each selection mode leads to specific patterns of allele frequency 97
changes (Oleksyk et al. 2010). For instance, divergent directional selection decreases 98
genetic variation within populations, while balancing selection maintains variation within 99
populations. A few loci potentially under divergent selection are enough to cause a 100
significant downward bias in the assessment of GD estimated from markers assumed to be 101
neutral (García-Verdugo et al. 2015). The presence of such markers can thus be misleading 102
for SGDC studies. When SGDCs are driven by neutral mechanisms, loci under selection 103
are likely to decrease the correlation between species and genetic diversity, since only 104
neutral GD is expected to covary with SD in such circumstances. In contrast, no such 105
effects are expected when SGDCs arise from non-neutral processes. 106
Separating the neutral and non-neutral components of GD not only opens new 107
perspectives for the study of SGDCs, but can also be critical to interpreting apparent effects 108
of local habitat features in a neutral framework. Several studies have investigated how 109
disturbance regime, habitat size and/or connectivity relate to SGDCs in order to infer 110
underlying mechanisms (Vellend and Geber 2005; Papadopoulou et al. 2011; Lamy et al. 111
2013; Vellend et al. 2014). These studies postulate that these local features become 112
associated with neutral components of SD/GD due to their modulating role on rates of 113
migration and stochastic loss of species/alleles. However, these relationships can be 114
mistakenly attributed to neutral processes (confounding effect 2 in Fig. 1) if disturbance 115
regime, habitat size and/or connectivity and selective environmental factors are spatially 116
correlated, as they would lead to indirect associations between non-neutral components of 117
GD and the local habitat features. These confounding effects have been documented for 118
species richness-island area associations (Ricklefs and Lovette 1999), and are expected at 119
the genetic level since populations at the margins of a species distribution range are not 120
only more fragmented and isolated than central populations, but also subject to different 121
ecological constraints (central-marginal hypothesis, Eckert et al. 2008). In such situations, 122
factoring out the effects of disturbance regime, habitat size and/or connectivity bears the 123
risk of overestimating the contribution of neutral processes on SD and GD, as it is likely to 124
control for some influence of selective factors as well. 125
In this study, we aimed to disentangle the confounding effects of non-neutral 126
genetic diversity on species-genetic diversity relationships in a highly fragmented 127
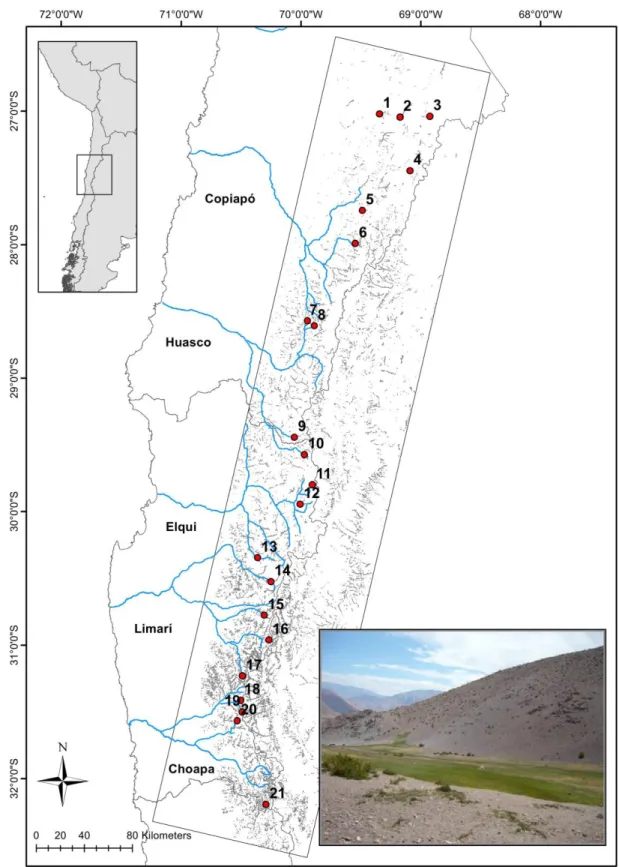
ecosystem, the high Andean wetlands of Chile’s Norte Chico. These wetlands, formed by 128
groundwater upwelling, resemble oases in an arid matrix (Fig. 2, Squeo et al. 2006). They 129
occupy a latitudinal gradient of both aridity (increasing northwards) and wetland density 130
(Fig. 2). This suggests that wetlands differing in connectivity also experience different 131
selective pressures. Given the high degree of fragmentation of these ecosystems, we 132
hypothesized that neutral processes should play a critical role in species-genetic diversity 133
relationships. Thus, we expected loci influenced by selection to decrease SGDCs. We also 134
postulated that such loci can complicate the evaluation of the importance of neutral 135
processes on SGDC by factoring out the effects of habitat connectivity on SD and GD. 136
Indeed, due to the spatial covariation between habitat fragmentation and the latitudinal 137
environment gradient, GD of loci under environmental gradient pressure is also expected to 138
correlate with fragmentation characteristics. To test these conjectures, we investigated 139
SGDCs between species diversity of high Andean wetland vegetation and GDs of five 140
species (two plants and three macroinvertebrates) with contrasting life-histories. We used a 141
genome scan approach to screen for AFLP markers potentially under selection (i.e. outlier 142
loci; Storz et al. 2004) and analyzed SGDCs and the effects of habitat characteristics (size, 143
connectivity and stability) on SGDCs with and without these loci. Our results showed that, 144
as expected, confounding effects of outlier loci on GD decrease SGDCs. This trend was 145
particularly evident with loci potentially under divergent selection. We also found that, in 146
some species, GD at outlier loci correlate with habitat features supposedly linked to neutral 147
processes, revealing pitfalls in using such characteristics to infer processes driving SGDCs. 148
149
Material and methods
150
Study system
151
We analyzed species and genetic diversity for 21 high Andean wetlands located along a ca. 152
600 km latitudinal range (26°S–32°S) in north-central Chile (Fig. 2, and see Bertin et al. 153
2015). The region, known as Norte Chico, is a biodiversity hotspot, and is characterized by 154
remarkably high levels of endemism (Arroyo et al. 2004). It includes five hydrologically 155
unconnected river basins. The climate of the region varies from hyperarid in the north to 156
mediterranean in the south, with mean annual precipitation ranging between 35 mm and 157
200 mm for the northernmost and southernmost valleys, respectively. 158
159
Data collection
160
Community and population sampling
Sampling of plant and benthic macroinvertebrate specimens was carried out between March 162
and April 2011. For plant diversity assessment, the length of each wetland was divided into 163
five sectors and a 30 x 30 cm quadrat was randomly placed within each sector. Plant 164
species were separated and identified in the laboratory. 165
For genetic diversity evaluation, we selected five common species: two dominant 166
plants, Carex gayana (Cyperaceae) and Patosia clandestina (Juncaceae), and three 167
abundant aquatic macroinvertebrates, Andesiops peruvianus (Insecta, Ephemeroptera), 168
Austrelmis sp. (Insecta, Coleoptera) and Hyallela fossamancinii (Crustacea, Amphipoda).
169
Samples were collected by hand or using a small fishing net in the case of aquatic 170
organisms. The entire wetland surface area was sampled in each case, with individual 171
wetlands ranging in size from 3.7 to 38 ha. Leaf samples were conserved individually in 172
silica gel until DNA extraction, whereas macroinvertebrates were stored in 95% alcohol. 173
The plant C. gayana was the only species found to occur within all 21 wetlands sampled. 174
Details regarding sampling sites and size for each species are given in Table S1. 175
176
Genetic data
177
For all five species, DNA extraction was performed using a CTAB protocol. AFLP 178
amplifications and genotyping were carried out using standard procedures and following 179
the protocol of Meudt and Clarke (2007), available at http://clarkeresearch.org/aflp_2012-180
01-26/aflp.html, with very few modifications. In each species, four combinations of 181
specific primers were selected based on their reliability and number of fragments amplified. 182
AFLP fragments were separated by capillary electrophoresis and genotyping was 183
performed with the software GeneMarker v2.4 (Softgenetics). Following Bonin et al. 184
(2007), we retained only AFLP loci with genotyping error rate < 10%, with the exception 185
of the crustacean H. fossamancinii, for which we included loci with up to 12% genotyping 186
error in order to maintain a comparable number of loci for all species. Loci with redundant 187
information were filtered using the software AFLPOP (Duchesne and Bernatchez 2002). 188
Detailed procedures and AFLP primer pairs are described in Supplementary Information. 189
Only polymorphic markers (those with band frequencies between 5% and 95%) were kept 190
in the analysis (Bonin et al. 2007). 191
192
Habitat parameters
193
Habitat attributes associated with connectivity, size and stability were assessed for each of 194
the 21 sampled wetlands. Attributes were derived from maps of wetland distribution 195
generated based on spectral analysis of Landsat 8 OLI satellite imagery 196
(http://glovis.usgs.gov/, see Fig. 2) and elevation data. Normalized Difference Vegetation 197
Index, a measure of actively photosynthesizing vegetation (NDVI, Rouse et al. 1973), was 198
first calculated using Landsat data (January 2011) for a training dataset of 87 high Andean 199
wetlands mapped on-site in the Norte Chico region by Chile’s Ministry of Environment and 200
Agricultural and Livestock Service. Based on the mean NDVI value of all pixels 201
comprising the 87 field-mapped wetlands, and applying the minimum observed elevation 202
value as a cut-off, we defined wetlands here as all vegetated pixels with NDVI values > 0.2, 203
located above 1800 m a.s.l. To exclude sparse vegetation from the mapping, only vegetated 204
areas ≥ 0.36 ha were considered. 205
We calculated various local structural connectivity metrics for each wetland using 206
Graphab 1.0 (Foltete et al. 2012), including node degree (Dg), clustering coefficient (CC), 207
closeness centrality (CCe), eccentricity (Ec), betweenness centrality (BC) and wetland 208
density. These metrics were quantified by considering all the wetlands mapped within a 20 209
km radius from the focal site. In addition, we estimated the surface of each focal wetland 210
from the GIS-based map (Fig. 2). As a proxy for wetland stability, we used the temporal 211
range of the mean NDVI of each site calculated over 20 years (from 1991 to 2002 and from 212
2004 to 2011). Before evaluating the impact of the habitat metrics on diversity, we removed 213
strongly correlated predictors by excluding one variable when a Pearson’s correlation 214
between a pair of habitat metrics was > 0.7. The final set of predictors included wetland 215
size, Dg, CCe, Ec, BC and the temporal range of NDVI wetland values. 216
217
Statistical analysis
218
Identification of outlier loci
219
We used the Bayesian likelihood FST-based method implemented in the software BayeScan
220
(Foll and Gaggiotti 2008) to identify outlier loci. This approach estimates for each locus the 221
posterior probabilities of two alternative models: a neutral one and a model including 222
selection. We performed the analyses using the default parameters and considered a 223
conservative value of 10 for the prior odds (10:1 odds in favor of the neutral model). Loci 224
with FST values substantially higher than the observed norm are considered potentially
225
under diversifying selection, while those with substantially lower FST values are considered
226
potentially under balancing or purifying selection (Foll and Gaggiotti 2008). These outlier 227
loci were identified with the R function plot_bayescan as described in the user’s manual, 228
using a false discovery rate (FDR, the q-value threshold) of 5%. Accordingly, we examined 229
the effects of outlier loci by creating three marker datasets and considering their FST values:
230
a dataset free of outliers (DS1), one with all the genotyped loci, thus including both the 231
non-outlier and all the outlier loci (i.e. with high and low FST, DS2) and one dataset
232
including the non-outlier loci and the outlier loci with high FST only (DS3).
233 234
Species richness, genetic diversity and the influence of outlier loci on genetic diversity
235
estimates
236
We used the statistical software R (R Core Team 2015) to calculate diversity indices and
237
perform SGDC analyses. We estimated species diversity within each wetland as species 238
richness of all the collected quadrats, and within-population genetic diversity as Nei’s gene 239
diversity (Nei 1987). We calculated the bootstrapped 95% confidence interval of species 240
richness and Nei’s indices by considering 10,000 bootstrap replications using the R 241
package rich (Rossi 2011) and R functions of AFLPdat (Ehrich 2006), respectively. Nei’s 242
gene indices were computed for the three marker datasets separately (DS1, DS2 and DS3). 243
We tested the effects of outlier loci on GD by carrying out linear mixed models (LMM) of 244
Nei’s gene diversity (dependent variable) in relation to the presence of outlier loci (fixed 245
effect), and including species and site as crossed random factors. We performed two such 246
analyses, testing the effects of all the outlier loci (with datasets DS1 and DS2), and of those 247
with high FST only (with datasets DS1 and DS3). These analyses were also performed for
248
each species separately. 249
250
Effects of habitat characteristics on species and genetic diversity
251
We used partial least-square (PLS) regressions to analyze the influence of habitat 252
characteristics on species and genetic diversity. PLS regressions are recommended in 253
analyses involving a large number of potentially correlated predictor variables and few 254
observations (Mevik and Wehrens 2007), as in the case of the present study. Such analyses 255
first produce a set of uncorrelated linear combinations of the original predictors, the PLS 256
components, calculated so as to maximize the covariance between the predictor and 257
response variables (Mevik and Wehrens 2007). Then, the PLS components are used to 258
derive the linear regression of the dependent variable (i.e. species or genetic diversity in 259
this case). To establish the optimal number of PLS components, we used a leave-one-out 260
cross-validation strategy (Mevik and Cederkvist 2004). Significance of the PLS model was 261
assessed by testing the significance of the Pearson correlation between the observed and 262
predicted values. To determine which habitat characteristics contributed most to the model, 263
we examined the loading weights and performed approximate t-tests based on jackknife 264
variance estimates of regression coefficients, calculated based on the optimal number of 265
PLS components. 266
267
Species and genetic diversity correlations
268
For each marker dataset, we computed Pearson correlations between plant species richness 269
and Nei’s gene diversity index. One-tail tests with Bonferroni-Holm corrections were 270
applied to correct for multiple comparisons. In order to assess the overall trend in SGDCs, 271
we calculated Student’s t-tests to determine whether the average correlation calculated from 272
the five species was greater than zero. To investigate whether the relationships between 273
species and genetic diversity were mediated by habitat isolation, stability, and size, we 274
performed partial Pearson correlations after controlling for significant effects of habitat 275
characteristics on species and genetic diversity. Significance of the residual correlations 276
was tested as described above for the raw SGDC coefficients. LMMs were performed to 277
test for differences in SGDCs between DS1 and DS2 (dataset as fixed effect), using species 278
as a random factor. 279
Results
280
Identification of the outlier loci
281
Depending on the species, between 66 and 90 polymorphic AFLP loci were retained in our 282
study (Table S2). The BayeScan analysis identified between one and ten outlier loci per 283
species, representing between 1.2% and 15.1% of the AFLP loci, respectively, with an 284
average of 6.8% over all species (Table S2). Most of these outlier loci had high FST values,
285
but in P. clandestina and Austrelmis sp. two loci showed low FST values (Table S2).
286 287
Species richness and genetic diversity
288
Plant species richness ranged from 6 to 21 species per wetland (Table S3) and decreased 289
with latitude (Fig. S1). The two plant species showed low genetic diversity overall (range 290
of average Nei´s gene diversity indices: 0.11–0.13; Table S4), varying moderately to 291
substantially between wetlands (more than six-fold in C. gayana; Table S4). Genetic 292
diversity estimates of macroinvertebrates were higher (range of average Nei´s gene 293
diversity indices: 0.11–0.28; Table S4) but less variable (Table S4). The presence of outlier 294
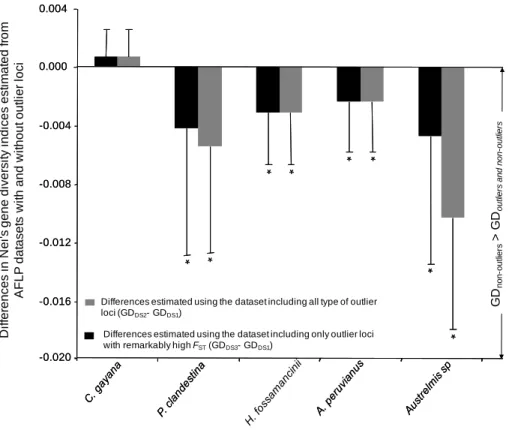
loci significantly influenced Nei’s gene diversity. These effects were detected in four of the 295
five species (Fig. 3), and as an overall trend across species (LMM, dataset effect: LR = 296
12.52, df = 1, P < 0.001 for DS1 vs DS2; LR = 24.77, df = 1, P < 0.001 for DS1 vs DS3). 297
The only species for which we failed to detect outlier loci effects on genetic diversity was 298
C. gayana, but only one outlier was identified for this species. Overall, GD estimates
299
decreased with the presence of outlier loci (Fig. 3, Fig. S1), and this trend was more 300
pronounced when only outliers with high FST were included in the genetic datasets than
301
when both outliers with high and low FST were included.
Species-genetic diversity correlations and the influence of outlier loci
303
Our analyses revealed positive correlations between species richness and genetic diversity 304
(Table S5). The average SGDCs of the five species was high (ranging from 0.51 ± 0.07 for 305
DS3 to 0.54 ± 0.05 for DS1, Table S5) and significantly positive overall (t-tests: t = 17.4– 306
25.5, df = 4, P < 0.001 in all cases). All SGDCs were positive and significant with respect 307
to each species (P < 0.05 in all cases after correcting for multiple comparisons). They 308
ranged from 0.47 to 0.60 for DS1 (Table S5). The presence of outlier loci significantly 309
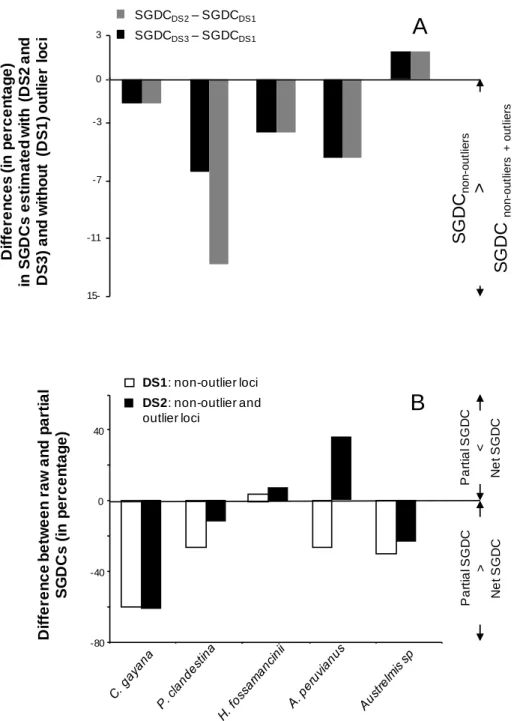
influenced the SGDCs (Fig. 4A, LMM, dataset effect: LR = 6.05, df = 2, P = 0.05), causing 310
a decrease in SGDCs overall (Fig 4A, Table S5). This trend was particularly marked in P. 311
clandestina (Fig. 4A), for which the SGDC estimate dropped by 13.5% when outlier loci
312
with high FST were included (Fig. 4A).
313 314
Influence of habitat fragmentation on species richness, genetic diversity and SGDCs
315
The PLS regressions explained 49% of the variation in wetland plant richness (Table 1). 316
Significant influence of wetland size and connectivity on genetic diversity was found for 317
the plants and the mayfly species (A. peruvianus), but no such effects were detected for the 318
long-lived aquatic species (H. fossamancinii and Austrelmis sp). Wetland isolation was an 319
important determinant of plant species richness and genetic diversity. We found a negative 320
influence of the average distance to neighboring patches (i.e. closeness centrality, Table 1) 321
and positive effects of the number of neighboring patches (i.e. node degree, Table 1) on 322
genetic and species diversity. A positive effect of the distance to the farthest wetland (i.e. 323
eccentricity) on species richness and genetic diversity was observed for the plants and the 324
mayfly species (Table 1). 325
The effects of habitat fragmentation on GD were not lowered by the presence of 326
outlier loci (i.e. DS2 and DS3, Table 1). In fact, the opposite trend was observed in P. 327
clandestina and A. peruvianus, with habitat connectivity explaining a greater proportion of
328
the variance in GD for DS2/DS3 than for DS1 (Table 1). 329
Factoring out the effects of habitat fragmentation on species and genetic diversity 330
significantly influenced SGDC estimates (LMM, fragmentation habitat control effect: LR = 331
8.42, df = 1, P < 0.01), decreasing average partial SDGCs relative to average original 332
values (Fig. 4B, Table S5). The decreases in partial SGDCs were more consistent and 333
pronounced with DS1 than with DS2 (Fig. 4B). In A. peruvianus, controlling for habitat 334
fragmentation had strikingly contrasting effects depending on whether or not the outlier loci 335
were included in the analysis (Fig. 4B). As in other species, the partial SGDC decreased 336
with DS1, but increased considerably with DS2, reaching a maximum of 0.7 (Table S5). To 337
confirm that this discrepancy was specifically linked to the three outlier loci detected, we 338
applied a bootstrap procedure to simulate the null distribution of the difference in partial 339
SGDCs between DS1 and DS2 when randomly eliminating three non-outlier loci from 340
DS2. None of the 1,000 bootstrap replications resulted in SGDC differences greater than or 341
equal to the one observed between DS1 and DS2. 342
343
Discussion
344
Confounding effects of outlier loci in SGDC studies
345 346
There is increased awareness that neutral molecular markers are not always free of 347
selection pressures; disregarding this fact can bias population genetic inferences (Luikart et 348
al. 2003, Landguth & Balkenhol 2012). To avoid this problem, Luikart et al. (2003) 349
advocated excluding FST outlier loci from genetic analyses when the focus is on neutral
350
processes. In this study, we screened for AFLP outlier loci and investigated their impact on 351
SGDC estimates. We also examined how these loci influence the apparent contribution of 352
habitat characteristics linked to neutral processes (migration rates and rates of stochastic 353
loss of alleles/species) on SGDCs. Our results show that outlier loci led to a marked 354
decrease in GD, which in turn downplayed the strength of SGDCs. 355
Outlier loci have been suggested to be involved in adaptive processes (Hancock et 356
al. 2011; Manel et al. 2012). Yet, alternative mechanisms, which may or may not be
357
indirectly associated with selective forces, have also been proposed to explain outlier loci, 358
such as correlations in co-ancestry between subpopulations in hierarchical structures, gene 359
surfing, background selection, and even endogenous genetic barriers (Bierne et al. 2011, 360
2013). Regardless of the actual mechanisms involved in the atypical of the actual 361
mechanisms involved in the atypical differentiation patterns of the outlier loci, those with 362
markedly high FST demonstrated the most pronounced effects in terms of reductions in GD.
363
This result concurs with previous empirical observations based on microsatellite data 364
(Garcia-Verdugo et al. 2015), and thus suggests that GD might often be underestimated 365
when such loci are included in population genetic analyses. 366
We found a significant downward effect of outlier loci on SGDCs, indicating that 367
SD correlates more strongly with GD of non-outlier loci than with GD of outlier loci. This 368
pattern is consistent with the expectation that SD is more closely related to neutral GD than 369
to non-neutral GD, due to the parallel influence of neutral processes on both diversity 370
levels. Investigating the effects of filtering out outlier loci from SGDC studies is therefore a 371
potentially useful approach to evidence the contribution of neutral processes. In addition, it 372
may contribute to revealing SGDCs, and explain some of the variation in species-genetic 373
diversity relationships observed in the field. Indeed, the effects of outlier loci are likely to 374
depend on the strength of neutral mechanisms on both diversity components. In high 375
Andean wetlands, and highly fragmented ecosystems in general, neutral evolutionary 376
processes are likely key determinants of biodiversity. As a result, they are expected to 377
generate strong species-genetic diversity covariations (Vellend and Geber 2005; Whitlock 378
2014; Vellend et al. 2014), as were found here, with these SGDCs ranking among the 379
highest values reported to date (Vellend and Geber 2005; Whitlock 2014; Vellend et al. 380
2014). In such conditions, non-neutral processes, and thus outlier loci, should only have 381
minor confounding effects. The influence of outlier loci on SGDCs is likely to become 382
increasingly problematic as the relative importance of neutral processes in shaping diversity 383
patterns decreases. Extending the present framework to less fragmented ecosystems may 384
potentially uncover further SGDC patterns, thereby advancing current understanding of 385
species-genetic diversity relationships. 386
The presence of outlier loci also complicated the evaluation of the contribution to 387
SGDCs of habitat characteristics supposedly linked to neutral processes. Without such loci, 388
the partial SGDCs, calculated after filtering out the effects of habitat fragmentation on SD 389
and GD, decreased compared to the corresponding non-partial estimates. This indicates 390
concordant responses of SD and GD at non-outlier loci to these habitat characteristics. 391
Outlier loci somehow blurred these trends however, as reduction of partial SGDCs was less 392
consistent and less pronounced among species with outlier loci present. In the mayfly A. 393
peruvianus, the SGDC with outlier loci actually increased when habitat effects were
394
factored out (Fig. 4B). This indicates that contrasting effects of habitat characteristics on 395
SD and GD at outlier loci were partly masking the species-genetic diversity relationship in 396
this species. It further shows that GD at outlier loci and neutral GD can correlate differently 397
with habitat features, thus confounding the apparent importance of neutral mechanisms on 398
GD. In fact, for both P. clandestina and A. peruvianus, the habitat features showed stronger 399
correlations with GD at outlier than at non-outlier loci (Table 1). Habitat stability, size, and 400
connectivity, being intrinsic determinants of population demography, are expected to 401
influence all neutral loci equally (Luikart et al. 2003). Their stronger association with 402
outlier loci in two species thus suggests that they can also be indirectly associated with 403
selective processes and local adaptation. In our case, high altitude wetland densities decline 404
in parallel with latitude, and both wetland size and connectivity show spatial structure along 405
this gradient (Fig. S2, Supplementary Material). In such circumstances, the standard 406
approach to disentangling the influence of neutral processes on SGDCs – i.e., factoring out 407
the effects of habitat features– may be ineffective, since it can simultaneously omit the 408
effects of selective environmental factors. Our results thus illustrate the difficulties in 409
inferring evolutionary processes from partial SGDCs when habitat density is paired with 410
environmental gradient, a situation likely to be common in ecosystems subject to climatic 411
and/or topographic influence. To overcome pitfalls in interpreting the contribution of 412
disturbance regime, habitat size and/or connectivity to SGDCs, it would be advisable to 413
analyze the spatial distribution of these variables and evaluate their correlation with other 414
environmental factors as potential actors of selection. 415
416
Species-genetic diversity correlations in high altitude wetlands: patterns and processes
417
We found strong spatial associations between species richness and AFLP genetic diversity 418
estimates in high altitude wetlands. Consistent with simulation models suggesting stronger 419
species-genetic diversity relationships when GD is measured in more common species 420
(Vellend 2005), highest SGDC was obtained for C. gayana, the most abundant plant 421
species of high altitude wetlands of Chile’s Norte Chico. Overall, our results add to 422
previous meta-analysis evidence that SGDCs are widespread in discrete habitats 423
functioning as islands (Vellend and Geber 2005; Whitlock 2014; Vellend et al. 2014). 424
Furthermore, our results show that such correlations are not limited to component species 425
of the community. For instance, we detected strong SGDCs between plant species richness 426
and GD of the benthic macro-invertebrate taxa, despite the fact that the latter possess very 427
different life-history traits, particularly regarding their dispersal modes. 428
SGDCs in patchy ecosystems are thought to result from parallel influences of 429
neutral forces governing variation at the genetic and species diversity levels (Vellend and 430
Geber 2005; Whitlock 2014; Vellend et al. 2014). Here, the contribution of such 431
mechanisms is substantiated both by the lowering effect of outlier loci on SGDCs, as well 432
as the apparent common responses of SD and GD at non-outlier loci to habitat features 433
(size, connectivity and stability). The persistence of positive, and overall significant, partial 434
SGDCs after removing all confounding effects (outlier loci and habitat features) suggests, 435
however, that other causal mechanisms might also be involved. These can include both 436
parallel responses to processes unrelated to habitat features, and direct relationships 437
between SD and GD. While our results indicate that potentially selected loci tend to 438
decrease SGDCs overall, they do not rule out the possibility that some selective 439
mechanisms may contribute to species-genetic diversity relationships. For instance, a strong 440
selective agent, e.g. a voracious herbivore or an aggressive exotic plant, acting with 441
increasing intensity upon plant communities located along a spatial gradient might cause a 442
gradual reduction in SD (due to differences in species’ abilities to cope with increased 443
predation/competition) together with a reduction of GD in the “surviving” species, where 444
only some tolerant genotypes could remain; this would generate a positive correlation 445
between SD and GD. In our study system, plant SD may affect soil and water 446
characteristics and, as such, may influence local GD by determining the abundance of plant 447
and macroinvertebrate populations. Alternatively, genetic variation within foundation 448
species such as P. clandestina, which hosts other plant species, can affect the composition 449
and diversity of associated communities (Whitham et al. 2006). Nevertheless, this 450
conjecture would imply a significant correlation between GD at non-outlier loci and GD of 451
specific genes encoding ecologically relevant traits influencing plant assemblages. 452
Further investigation is required to fully unravel the mechanisms driving SGDCs in 453
high Andean wetlands. Future studies will benefit from next-generation sequencing applied 454
to genome scans, which will very soon allow for more reliable estimates of genes under 455
selection (Manel et al. 2016), essential to distinguishing neutral from adaptive markers. 456
Ideally, field studies could complement these efforts by identifying strong interactions 457
between species in the community, putative selective pressures, and patterns of selection 458
and adaptive evolution. 459
460
Acknowledgements
461
We thank F. Squeo, G. Arancio, D. Rodriguez, R. Inzulza Ayala, L. Cifuentes, E. Alvarez, 462
C. Urqueta, R. Hereme and A. Troncoso for their help with field work and/or for their 463
technical assistance, and Craig Weideman for revising the English of the manuscript. Our 464
thanks go to P. Jarne and F. Laroche for insightful discussion during the preparation of this 465
manuscript. We also thank four anonymous reviewers for their comments on previous 466
versions of the manuscript. The authors are grateful to La Junta de Vigilancia del Elqui, la 467
Comunidad Agrícola los Huascoaltinos, La Sociedad de Parceleros de Coiron, La Sociedad 468
de Parceleros de San Agustín, La Sociedad de Parceleros Hacienda Illapel, la Hacienda 469
Tulahuén Oriente, la Hacienda El Maiten de Pedregal and la Hacienda El Bosque for giving 470
us access to private wetlands. This research was funded by a grant from the Chilean 471
National Research Agency FONDECYT #1110514 and the exchange research grant ECOS-472 CONICYT C12B02. 473 474
References
475Antonovics J (1992) Toward community genetics. In: Plant resistance to herbivores and 476
pathogens: ecology, evolution, genetics (eds. Fritz RS, Simms E), pp. 426-449. The
477
University of Chicago Press, Chicago. 478
Arroyo MTK, Marquet P, Marticorena C et al. (2004) Chilean winter rainfall-Valdivian 479
forests. In: Hotspots revised: Earth's biologically wealthiest and most threatened 480
ecosystems. (eds. Mittermeier RA, Gil PR, Hoffmann M et al.), pp. 99-103. CEMEX,
481
México D.F. 482
Barton NH (2000) Genetic hitchhiking. Philosophical Transactions of the Royal Society of 483
London Series B-Biological Sciences, 355, 1553-1562.
484
Bertin A, Alvarez E, Gouin N et al. (2015) Effects of wind-driven spatial structure and 485
environmental heterogeneity on high-altitude wetland macroinvertebrate assemblages 486
with contrasting dispersal modes. Freshwater Biology, 60, 297-310. 487
Bierne N, Welch J, Loire E et al. (2011) The coupling hypothesis: why genome scans may 488
fail to map local adaptation genes. Molecular Ecology, 20, 2044-2072. 489
Bierne N, Roze D, Welch JJ (2013). Pervasive selection or is it …? Why are Fst outliers 490
sometimes so frequent? Molecular Ecology, 22, 2061-2064. 491
Bonin A, Ehrich D, Manel S (2007) Statistical analysis of amplified fragment length 492
polymorphism data: a toolbox for molecular ecologists and evolutionists 493
6. Molecular Ecology, 16, 3737-3758. 494
Duchesne P, Bernatchez L (2002) AFLPOP: a computer program for simulated and real 495
population allocation, based on AFLP data. Molecular Ecology Notes, 2, 380-383. 496
Eckert C, Samis K, Lougheed S (2008) Genetic variation across species' geographical 497
ranges: the central-marginal hypothesis and beyond. Molecular Ecology, 17, 1170-498
1188. 499
Ehrich D (2006) AFLPDAT: a collection of R functions for convenient handling of AFLP 500
data. Molecular Ecology Notes, 6, 603-604. 501
Foll M, Gaggiotti O (2008) A Genome-Scan Method to Identify Selected Loci Appropriate 502
for Both Dominant and Codominant Markers: A Bayesian Perspective. Genetics, 180, 503
977-993. 504
Foltete JC, Clauzel C, Vuidel G (2012) A software tool dedicated to the modelling of 505
landscape networks. Environmental Modelling & Software, 38, 316-327. 506
Frankham R (1996) Relationship of genetic variation to population size in wildlife. 507
Conservation Biology, 10, 1500-1508.
508
Frankham R (1997) Do island populations have less genetic variation than mainland 509
populations? Heredity, 78, 311-327. 510
García-Verdugo C, Sajeva M, La Mantia T et al. (2015) Do island plant populations really 511
have lower genetic variation than mainland populations? Effects of selection and 512
distribution range on genetic diversity estimates. Molecular Ecology, 24, 726-741. 513
Hancock AM, Brachi B, Faure N et al. (2011) Adaptation to Climate Across the 514
Arabidopsis thaliana Genome. Science, 334, 83-86. 515
He T, Lamont BB, Krauss SL, Enright NJ, Miller BP (2008) Covariation between 516
intraspecific genetic diversity and species diversity within a plant functional group. 517
Journal of Ecology, 96, 956-961.
518
Holderegger R, Kamm U, Gugerli F (2006) Adaptive vs. neutral genetic diversity: 519
implications for landscape genetics. Landscape Ecology, 21, 797-807. 520
Hu FS, Hampe A, Petit RJ (2009) Paleoecology meets genetics: deciphering past 521
vegetational dynamics. Frontiers in Ecology and the Environment, 7, 371-379. 522
Hubbell, S.P. (2001) The Unified Neutral Theory of Biodiversity and Biogeography, 523
Princeton University Press. 524
Johnson MTJ, Stinchcombe JR (2007) An emerging synthesis between community ecology 525
and evolutionary biology. Trends in Ecology & Evolution, 22, 250-257. 526
Kahilainen A, Puurtinen M, Kotiaho JS (2014) Conservation implications of species-527
genetic diversity correlations. Global Ecology Conservation, 2, 315-323. 528
Kirk H, Freeland JR (2011) Applications and Implications of Neutral versus Non-neutral 529
Markers in Molecular Ecology. International Journal of Molecular Sciences, 12, 530
3966-3988. 531
Lamy T, Jarne P, Laroche F et al. (2013) Variation in habitat connectivity generates 532
positive correlations between species and genetic diversity in a metacommunity. 533
Molecular Ecology, 22, 4445-4456.
534
Lankau RA, Strauss SY (2007) Mutual feedbacks maintain both genetic and species 535
diversity in a plant community. Science, 317, 1561-1563. 536
Laroche F, Jarne P, Lamy T, David P, Massol F (2015) A Neutral Theory for Interpreting 537
Correlations between Species and Genetic Diversity in Communities. American 538
Naturalist, 185, 59-69.
Lavergne S, Mouquet N, Thuiller W, Ronce O (2010) Biodiversity and Climate Change: 540
Integrating Evolutionary and Ecological Responses of Species and Communities. 541
Annual Review of Ecology, Evolution, and Systematics, Vol 41, 41, 321-350.
542
Luikart G, England PR, Tallmon D, Jordan S, Taberlet P (2003) The power and promise of 543
population genomics: From genotyping to genome typing 544
13. Nature Reviews Genetics, 4, 981-994. 545
MacArthur R.H., Wilson E.O. (1967) The theory of island biogeography. Princeton 546
University Press, New Jersey. 547
Manel S, Perrier C, Pratlong M et al. (2016) Genomic resources and their influence on the 548
detection of the signal of positive selection in genome scans. Molecular Ecology, 25, 549
170-184. 550
Manel S, Gugerli F, Thuiller W et al. (2012) Broad-scale adaptive genetic variation in 551
alpine plants is driven by temperature and precipitation. Molecular Ecology, 21, 552
3729-3738. 553
Meudt HM, Clarke AC (2007) Almost forgotten or latest practice? AFLP applications, 554
analyses and advances. Trends in Plant Science, 12, 106-117. 555
Mevik BH, Cederkvist HR (2004) Mean squared error of prediction (MSEP) estimates for 556
principal component regression (PCR) and partial least squares regression (PLSR). 557
Journal of Chemometrics, 18, 422-429.
558
Mevik BH, Wehrens R (2007) The pls package: Principal component and partial least 559
squares regression in R. Journal of Statistical Software, 18, 1-23. 560
Mouquet N, Devictor V, Meynard CN et al. (2012) Ecophylogenetics: advances and 561
perspectives. Biological Reviews, 87, 769-785. 562
Nei M (1987) Molecular Evolutionary Genetics. Columbia University Press, New York, N. 563
Y. 564
Odat N, Jetschke G, Hellwig FH (2004) Genetic diversity of Ranunculus acris L. 565
(Ranunculaceae) populations in relation to species diversity and habitat type in 566
grassland communities. Molecular Ecology, 13, 1251-1257. 567
Oleksyk TK, Smith MW, O'Brien SJ (2010) Genome-wide scans for footprints of natural 568
selection. Philosophical Transactions of the Royal Society B-Biological Sciences, 569
365, 185-205.
570
Papadopoulou A, Anastasiou I, Spagopoulou F et al. (2011) Testing the Species-Genetic 571
Diversity Correlation in the Aegean Archipelago: Toward a Haplotype-Based 572
Macroecology? American Naturalist, 178, 241-255. 573
R Core Team. A language and environment for statistical computing. 2015. Vienna, 574
Austria, R Foundation for Statistical Computing. 575
Ricklefs RE, Lovette IJ (1999) The roles of island area per se and habitat diversity in the 576
species-area relationships of four Lesser Antillean faunal groups. Journal of Animal 577
Ecology, 68, 1142-1160.
578
Rosenzweig (1995) Species diversity in space and time, Cambridge University Press 579
ednCambridge, UK. 580
Rossi J (2011) Rich: an R package to analyse species richness. Diversity, 3, 112-120. 581
Rouse JW, Haas RH, Schell J, Deering D (1973) Monitoring vegetation systems in the 582
Great Plains with ERTS. In: Third ERTS Symposium (ed. NASA SP-351 I), pp. 309-583
317. 584
Silvertown J, Biss PM, Freeland J (2009) Community genetics: resource addition has 585
opposing effects on genetic and species diversity in a 150-year experiment. Ecology 586
Letters, 12, 165-170.
587
Squeo FA, Warner BG, Aravena R, Espinoza D (2006) Bofedales: high altitude peatlands 588
of the central Andes. Revista Chilena de Historia Natural, 79, 245-255. 589
Storz JF, Payseur BA, Nachman MW (2004) Genome scans of DNA variability in humans 590
reveal evidence for selective sweeps outside of Africa. Molecular Biology and 591
Evolution, 21, 1800-1811.
592
Strauss SY, Sahli H, Conner JK (2005) Toward a more trait-centered approach to diffuse 593
(co)evolution. New Phytologist, 165, 81-89. 594
Struebig MJ, Kingston T, Petit EJ et al. (2011) Parallel declines in species and genetic 595
diversity in tropical forest fragments. Ecology Letters, 14, 582-590. 596
Taberlet P, Zimmermann NE, Englisch T et al. (2012) Genetic diversity in widespread 597
species is not congruent with species richness in alpine plant communities. Ecology 598
Letters, 15, 1439-1448.
599
Vellend M (2004) Parallel effects of land-use history on species diversity and genetic 600
diversity of forest herbs. Ecology, 85, 3043-3055. 601
Vellend M (2005) Species diversity and genetic diversity: Parallel processes and correlated 602
patterns. American Naturalist, 166, 199-215. 603
Vellend M, Geber MA (2005) Connections between species diversity and genetic diversity. 604
Ecology Letters, 8, 767-781.
605
Vellend M, Lajoie G, Bourret A et al. (2014) Drawing ecological inferences from 606
coincident patterns of population- and community-level biodiversity. Molecular 607
Ecology, 23, 2890-2901.
Whitham TG, Bailey JK, Schweitzer JA et al. (2006) A framework for community and 609
ecosystem genetics: from genes to ecosystems. Nature Reviews Genetics, 7, 510-523. 610
Whitlock R (2014) Relationships between adaptive and neutral genetic diversity and 611
ecological structure and functioning: a meta-analysis. Journal of Ecology, 102, 857-612
872. 613
Xu W, Liu L, He T et al. (2016) Soil properties drive a negative correlation between 614
species diversity and genetic diversity in a tropical seasonal rainforest. Scientific 615 Reports, 6. 616 617
Data accessibility
618Raw files of the AFLP genotypes (i.e. band presence and absence) for each of the five 619
species and R scripts will be made available from the Dryad Digital Repository upon 620
acceptance of the manuscript. 621
622
Author contributions
623
ABertin, NG, ABaumel, EG and SM conceived and designed the study. ABertin, NG, JS 624
and RO performed the experiments. ABertin, NG and ABaumel analyzed the data. ABertin, 625
NG, ABaumel and SM wrote the manuscript. All the authors contributed substantially to 626
revisions. 627
Tables
629
Table 1. Effects of habitat characteristics on genetic diversity and taxa diversity estimated using partial least-square regressions
630
(PLSR). The direction of the effect (positive/negative) of each habitat characteristic on the diversity parameters is reported in 631
parentheses. DS1 refers to the AFLP dataset excluding outlier loci, DS2 to the dataset including both non-outlier and outlier loci 632
(potentially under diversifying or balancing selection), and DS3 to the dataset including non-outlier and outlier loci with high FST
633
(potentially under diversifying selection). 634
Number of sites
Optimal number of
PLSR axes Most contributing variables
Explained variance
(R2)
AFLP
dataset
Species diversity 21 3 Closeness centrality (<0), Eccentricity (>0), Node degree (>0) 0.49***
Genetic Diversity
C. gayana DS1 21 3 Node degree (>0), Closeness centrality (<0), Eccentricity (>0) 0.51***
DS2 / DS3 21 3 Node degree (>0), Closeness centrality (<0), Eccentricity (>0) 0.50***
DS2 16 1 Closeness centrality (<0), Eccentricity (>0), Node degree (>0), Capacity (>0)
0.35*
DS3 16 2 Node degree (>0), Capacity (>0) 0.31†
H. fossamancinii DS1 14 0 - - DS2 / DS3 14 0 - - A. peruvianus DS1 14 0 - - DS2 / DS3 14 1 Closeness centrality (<0) 0.43* Austrelmis sp DS1 15 0 - - DS2 15 0 - - DS3 15 0 - - †: P < 0.1, *: P < 0.05 and ***: P < 0.001 635
636
637 638
Figure 1. Relationship between species diversity within a community and neutral genetic
639
diversity within a species. Species-genetic diversity correlations (SGDCs) with neutral 640
genetic diversity are assumed to result from parallel responses to neutral processes (black 641
arrows), which relative importance is expected to be determined by habitat features such as 642
disturbance regime, habitat size and/or connectivity. Yet, non-neutral processes can have 643
confounding effects (grey arrows) in the investigation of neutrally-driven SGDCs. They can 644
confound the apparent level of SGDCs driven by neutral processes (confounding effect 1) 645
influencing neutral genetic diversity through linked selection. The contribution of habitat 646
characteristics regulating rates of stochastic immigration and extinction to SGDCs may also 647
be confounded by linked selection if adaptive genetic markers are selected by 648
environmental conditions covarying with those habitat characteristics (confounding effect 649 2). 650 Se le ct io n Species Diversity (within community) N eu tr al p ro ce ss es (d ri ft ,m ig ra ti o n )
Neutral genetic diversity
Non neutral genetic diversity Neutrally-driven SGDCs Li n ke d se le ct io n (g en et ic h it ch h ik in g, b ac kg ro u n d se le ct io n )
1
Habitat isolation, size and stability
Environmental heterogeneity
« 1 » and « 2 » indicate probable confounding effects in the analysis of neutrally-driven SGDCs
Correlations
Environmental characteristics
Figure 2. Picture of a high altitude wetland and geographical distribution of the sampling
651
sites along Chile´s Norte Chico. The rectangle depicts the remote-sensing area used for 652
identification and mapping of high Andean wetlands (shown in grey). 653
654
Figure 3. Average population difference + or – SD between Nei's gene diversity indices
655
estimated from the AFLP datasets including outlier loci (DS2 and DS3) and the dataset free 656
of outliers (DS1). Asterisks indicate significant differences (P < 0.05) in average population 657
genetic diversity estimated with and without outlier loci for each comparison in each 658 species. 659 0.004 0.000 -0.004 -0.008 -0.012 -0.016 -0.020 G Dn o n -o u tli e rs > G Do u tli e rs a n d n o n -o u tli e rs * * * * * * * * 0.004 D if fe re n c e s in N e i's g e n e d iv e rs it y in d ic e s e s ti m a te d fr o m A F L P d a ta s e ts w it h a n d w it h o u t o u tl ie r lo c i 0.000 -0.004 -0.008 -0.012 -0.016 -0.020 G Dn o n -o u tli e rs > G Do u tli e rs a n d n o n -o u tli e rs
Differences estimated using the dataset including all type of outlier loci (GDDS2- GDDS1)
Differences estimated using the dataset including only outlier loci with remarkably high FST(GDDS3- GDDS1)
* *
* *
* *
*
660
Figure 4. Differences between species genetic diversity correlations (SGDCs) estimated
661
under various scenarios. A) Differences between SGDCs estimated without (SGDCDS1) and
662
with outlier loci (SGDCDS2 and SGDCDS3). SGDCDS2 – SGDCDS1 refers to the difference
663
between SGDCs calculated with the full AFLP dataset including both non-outlier and 664
outlier loci (DS2) and the dataset excluding all the outlier loci (DS1), and SGDCDS3 –
665
SGDCDS1 to the difference between SGDCs calculated with the dataset including
non-666
outlier and outlier loci with high FST only (DS3) and the dataset excluding all the outlier
667
loci (DS1). B) Difference between raw SGDCs and partial SGDCs, calculated after 668
accounting for habitat characteristics, for each focal species and for datasets without (DS1) 669
and with all the outlier loci (DS2). 670 671