HAL Id: hal-02460070
https://hal.archives-ouvertes.fr/hal-02460070
Submitted on 25 May 2020
HAL is a multi-disciplinary open access
archive for the deposit and dissemination of
sci-entific research documents, whether they are
pub-lished or not. The documents may come from
teaching and research institutions in France or
abroad, or from public or private research centers.
L’archive ouverte pluridisciplinaire HAL, est
destinée au dépôt et à la diffusion de documents
scientifiques de niveau recherche, publiés ou non,
émanant des établissements d’enseignement et de
recherche français ou étrangers, des laboratoires
publics ou privés.
macromolecular systems
Anna Sangregorio, Nathanaël Guigo, J. C. van der Waal, Nicolas Sbirrazzuoli
To cite this version:
Anna Sangregorio, Nathanaël Guigo, J. C. van der Waal, Nicolas Sbirrazzuoli. Humins from
biore-fineries as thermo-reactive macromolecular systems. ChemSusChem, ChemPubSoc Europe/Wiley,
2018, 11 (24), pp.4246-4255. �10.1002/cssc.201802066�. �hal-02460070�
Humins from biorefineries as thermo-reactive macromolecular
systems
Anna Sangregorio,
[a,b]Nathanael Guigo*
[a], Jan C. van der Waal,
[b]Nicolas Sbirrazzuoli *
[a]Abstract: Conversion of lignocellulosic biomass often brings along
the formation of several side products. Among these, the formation of a black and viscous co-product so-called humins is observed due to acidic treatment of polysaccharides. To improve the efficiency of this process from an economical and environmental prospective, new solutions for humins valorization are urgently needed. This work focuses on the comprehensive understanding of humins with special emphasis on their structure/properties relations. Humins were subjected to different thermal treatments and were investigated by means of structural, thermoanalytical and rheological characterizations. The structure and composition of humins is very diverse and depends on the thermochemical conditions. Upon sufficient heating, humins will change into a non-reversible and more branched furanic structure with a relatively high glass transition temperature (Tg > 65 °C). It means that humins can be easily
processed for preparing thermoset-like resins.
Introduction
Polysaccharides, which includes cellulose and hemicellulose, are the largest constituent of lignocellulosic biomass and thus the most abundant natural carbon source.[1–3] Cellulose and hemicellulose can be depolymerized in pentose and glucose units, which can be further converted to different green chemicals and fuels. For example, two key building blocks can be obtained, 5-hydroxymethylfurfural (HMF) and furfural (FF), by acid-catalyzed dehydration of respectively C6 and C5 sugars. HMF can be further converted to several biomass-derived intermediates, as levulinic acid, formic acid and 2,5-furandicarboxylic acid (FDCA) through simple reactions.[2–9]
The growing interest of chemical industries in developing green processes and lignocellulosic biorefinery operations is exemplified by the FDCA chain value from carbohydrates conversion.[10–12] The high functionality of chemicals derived from
biomass often leads to the formation of many side-products. The most notable among these are the formation of a black and viscous co-product so-called humins (Scheme 1). Humins from biorefinery processes are carbonaceous heterogeneous
polydisperse macromolecules. Despite that it has been almost a century that humins were observed for the first time,[13] only in the
last few years there has been a growing interest in the formation and the characterization of this side-product. Different routes have been proposed for humins formation.[9,14–16] HMF
polycondensation through electrophilic substitution was postulated as possible pathway for humins formation[15]. In
another study, aldol addition and condensation were proposed as key reactions in the acid-catalyzed growth of humins, adding HMF to 2,5-dioxo-6-hydroxy-hexanal (DHH).[14] Humins chemical
structure has also not been unequivocally established yet, due to their complex and recalcitrant nature.[4,16–20] Moreover, humins’ structure is highly dependent on the conditions under which they are formed, as well as on the isolation and post-treatment methods.[4,17,21,22] Patil et al.[14,18] synthesized humins formed
during the acid-catalyzed conversion of glucose, fructose, and 5- hydroxymethylfurfuraldehyde (HMF). A conjugated network of C=C bonds and furanic rings with aldehydes, ketones, and hydroxyls as main functional groups was associated to all the humins samples. Van Zandvoort et al.[4,23] studied humins from
glucose, fructose, and xylose acid-catalyzed conversion. The aforementioned humins consist of furan rings connected via aliphatic linkers, with oxygen-containing functional groups, such as carboxyl, carbonyl, and hydroxyl. In another study, the size, morphology, and molecular structure of HMF-derived humins was reported.[16] Particles of ~200 nm in diameter were observed
during the HMF conversion. Lately, it was proposed that humins should be considered as an agglomerates of oligomeric species held together by weak interactions rather than entire macromolecules.[19]
Very recently, humins’ valorization techniques started receiving more and more attention.[2,21,22,24–31] Hoang et al. demonstrated the potential of humins as source for sustainable H2 and as model
feedstock for gasification.[25,31] Humins have been proposed in the
preparation of catalytic nanocomposites, showing to be highly active in the microwave-assisted oxidation of iso-eugenol to vanillin.[21] Valorization toward material applications have been
suggested,[2,24] demonstrating that humins impact positively the
mechanical properties of the thermosetting composites. Recently, other applications such as humins-derived porous materials [22,28]
and active carbon[29,30] have also emerged, suggesting possible
routes in applications such as sorbents or electrode materials. Several treatments have also been proposed, such as hydrotreatments,[32–35] oxidation[36] and pyrolysis.[37,38] Wang et
al.[32] reported that humins derived from glucose can be
depolymerized using hydrotreatment. The main species detected arising from humins were substituted alkylphenolics, naphthalenes, and cyclic alkanes. Catalytic hydrotreatment of fructose-derived humins was studied by Vlachos et al..[33] The
major products in the resulted oil were aromatic hydrocarbons, phenols, esters, ketones and alcohols, which are valuable bulk or specialty bio-based chemicals. Although all these processes are valuable valorization solutions, they mainly concern high
[a] A.Sangregorio, N.Guigo, N. Sbirrazzuoli
Institut de Chimie de Nice, Université Côte d'Azur, CNRS, UMR 7272, 06108 Nice, France.
E-mail: [email protected] [b] A.Sangregorio, J.C. van der Waal
Avantium Chemicals B.V., Zekeringstraat 29, 1014 BV, Amsterdam, the Netherlands.
Supporting information for this article is given via a link at the end of the document.
Scheme 1. The FDCA chain value and humins’ formation and potential valorisation.
temperature treatment, making the valorization process potentially expensive and complex. Thus, very mild thermal treatment should be investigated, targeting economically valuable solutions for biorefineries.
The increasing number of studies concerning new solutions for humins valorization, is driven by the growing attention of industry in green chemistry and lignocellulosic biorefinery operations. Synvina, a joint venture between Avantium and BASF, has planned to construct a 50 kton/year FDCA plant in Antwerp. This plant will consequently lead to the production of significant amounts of humins. The valorization of this side-product would further improve both the environmental footprint and the process economics. So far, humins are still mainly involved in energy and heat applications. It is of interest to increase the knowledge concerning humins to be able to increment their value. When discussing about humins, analogies can be made with lignin, another recalcitrant, highly heterogeneous aromatic biopolymer. Along the same lines, lignin is an undefined macromolecule, without a well-defined structure, showing a certain variation in their chemical composition. Despite lignins are considered a waste for decades, the scientific and commercial interest for this product has significantly increased in the last 30 years, as part of the by-products valorization concept. Nowadays, several applications have been already proposed, ranging from energy to polymer and chemical conversion.[39] Following the same
approach which led to many valorization strategies for lignin, scientists and industries started looking for added-value solutions for humins.
To create a bridge between humins and potential new applications, a deep understanding of the physico-chemical properties of this material is needed. So far, most of the studies about humins concern either humins synthesized in lab-scale
[4,14-16,18-20,23,25,33-35,38] or purified industrial humins[17,37]. In this study,
industrial humins directly obtained from biorefinery operations were analyzed. To make biorefinery processes sound from an economical point of view, valorization technique for the crude material, rather than purified one, should also be targeted. For material application perspectives, the already existing
macromolecular structure of humins is an unquestionable advantage. In such context, focusing on the macromolecular behavior of humins presents more interest than depolymerization treatments. For this reason, the link between the physical transition and the chemical structure as well as the evolution of this material under mild thermal treatment is fundamental. The objective of this study is to give new insights on these phenomena and to study the variation of humins’ properties and structure when exposed to thermal treatment. Attention is paid to identification of physical transitions and chemical reactions occurring in humins. The study first focused on infrared spectroscopy investigations to highlight the main structural changes in thermally treated humins. Then, advanced thermoanalytical methods have been used to study the glass transition behavior and cross-linking of humins under different treatments and conditions. Rheological measurements were performed to obtain more insights on humins’ macrostructure and behavior under stress and increasing temperatures. Elemental analysis and liquid chromatography have been also used for this purpose.
Results and Discussion
Figure 1 and Figure 2 compare the IR spectra of humins thermally treated respectively at 120 °C and 140 °C, for 2 hours, 4 hours, 8 hours, 16 hours and 24 hours. Measured peak intensities were normalized to 1 with respect to the intensity of the most intense peak at 1668 cm-1. Figure 1 and 2 (top) focus on the 4000 – 2500
cm-1 region i.e. the O-H and C-H stretching while Figure 1 and 2
(bottom) rather focus on the 2000 – 600 cm-1 region. The peak
assignment is shown in Table 1, according to literature.[2,4,16,18] Of
interest, it is comparing the variation of the relative intensities in each spectrum. As shown in Figure 1, a broad peak of O-H stretching is observed at 3383 cm-1 and a weak peak
corresponding to aliphatic C-H stretch is observed at 2928 cm-1.
The relative intensity of these two peaks significantly changes after humins thermal treatment. In Figure 1, the O-H peak is observed to decrease compared to the C-H peak with time of treatment. This is even more evident when the treatment is done at higher temperature (Figure 2). In case of humins heated at 140 °C, also a shift in O-H peak toward higher wavenumber, from 3383 cm-1 to 3406 cm-1, is observed with time of treatment in case
for the thermally treated humins indicate changes in the H-bond network. Free OH are located at higher wavenumbers (i.e. from 3600 to 3400 cm-1) while H-bonded OH bands are rather located
below 3400 cm-1. It would suggest that the thermal treatment
occurring in humins have modified the direct environment of OH group from H-bonded in raw humins to less H-bonded cross-linked humins. Reactive functions such as carbonyl or hydroxyls have decreased in cross-linked humins thus the possibility of creating H-bonds between hydroxyls and other entities is then much lower. Since humins sample has not been purified before analysis, oligomers from sugar conversion process might be trapped in the sample. As shown in Figure 1 and 2 bottom, the peak at 1668 cm-1 is typical of HMF spectra [18], but it is not
observed in purified humins from literature.[4,18] Free HMF as well
as humins’ furan ring contribution could be observed in the peak at 1515 cm-1 as well. The intensity of these peaks is shown to
decrease with time of thermal treatment. Indeed, part of the free HMF is probably volatizing and part is involved in reactions with the humins structure. More generally, peaks located from 1650 cm-1 to 1800 cm-1 could be attributed to carbonyl groups in humins.
In comparison with the intensity of the C-O band (i.e. mainly the C-O from furan ring) peaking at 1019 cm-1, the intensities of these
carbonyl peaks are slightly decreasing with the thermal treatment, again suggesting
Figure 1. Infrared spectroscopy of humins thermally treated at 120 °C for different time.
crosslinking formation via transformation of aldehydes groups. As shown in Figure 1 and 2 bottom, the peak corresponding to aliphatic C=C stretching at 1615 cm-1 is rather increasing and
broadening with time of thermal treatment. This suggests formation of aliphatic alkenes most likely through dehydration of hydroxyl groups. At lower wavenumber, 755 cm-1 803 cm-1 and
1019 cm-1, the characteristic peaks of furan ring are observed.
The FT-IR spectra are consistent with what previously studied in literature.[2,4,16,18]
Figure 2. Infrared spectroscopy of humins thermally treated at 140 °C for different time.
Table 1. Assignment of major peaks of raw humins.
Assignment Wavenumber (cm-1
)
O – H stretching 3383
C-H aliphatic stretching 2928
C – H wagging furan ring 755
C –H out of plane deformation in
furan ring 803 3500 3000 Abso rb a n ce Wavenumber (cm-1) 3406 cm-1 raw 2h 4h 8h 16h 24h 3383 cm-1 2928 cm-1 1800 1600 1400 1200 1000 800 600 Abso rb a n ce Wavenumber (cm-1) 24h raw 2h 4h 8h 16h 1700 cm-1 1668 cm-1 1615 cm-1 1515 cm-1 1019 cm-1 803 cm-1 755 cm-1
C – O stretching in furan ring 1019
C = C in furan ring 1515
C = C stretching 1615
Carbonyl group in HMF and
humins 1668
C=O conjugated to alkene 1700
Thermal and rheological behavior of raw humins and the effect of thermal treatment on humins were investigated to better understand the link between the chemical structure and the effect of thermal treatment.
Thermal behavior of raw humins
DSC was used to identify transitions and chemical reactions occurring in humins within a specific range of temperatures. Influences of water sorption and small molecules trapped in the industrial humins were also evaluated by investigating the behavior of vacuum dried humins. This will particularly help to discriminate the contribution of these volatiles on the glass transition behavior from the contribution of thermal cross-linking. Indeed, the presence of polar groups might have a significant contribution to the molecular mobility of humins’ macromolecules. This is for example observed in many biopolymers. When water is absorbed on specific sites, it acts as an efficient plasticizer.[40,41]
The DSC measurement was performed using a heating rate of 30 °C min-1 and 10 °C min-1, starting from -60 °C to 180 °C. The
prior cooling rate was the same as the heating rate. The first and the second heating scans obtained for the samples are shown in Figure 3. For crude humins, a step in the heat flow, which can be attributed to the glass transition of the material, is observed at around -11 °C when using a heating rate of 30 °C min-1 and at
-14 °C when using a heating rate of 10 °C min-1. Indeed, as the
glass transition is a kinetic transition starting from a non-equilibrium glassy state, it is shifted to higher temperature when the heating rate is increased. The glass transition of vacuum dried humins were checked at 10 °C min-1 (Figure 3). Compared to
crude humins, the Tg of vacuum dried humins at the first heating
scan is about -10 °C which is slightly higher (+ 4°C) compared to crude humins. At 30 °C.min-1 (scan not shown in Figure 3) the T
g
~ -5 °C only 6 °C higher than crude humins. Thus, the plasticizing effect of physisorbed water, or other small volatiles, in crude humins is rather limited compared to what was observed for lignin or amorphous cellulose. [40,42]. In the first run, a broad endothermic
peak is observed between 90 °C and 160 °C for crude samples, which could be associated with vaporization or eventually a broad melting. In this temperature range, residual monomeric units, physisorbed water and water by-product due to condensation reactions could be released. This endothermic peak is not observed in the first heating scan of vacuum dried humins. Vacuum drying at relatively low temperature helps in partially removing water and volatiles. A significant shift of Tg is observed
when running a second DSC scan and no endothermic peak is present confirming that no melting occurred during the first run. This suggests that the endothermic peak in the first scan rather corresponds to vaporization of volatiles. The shift of the glass
transition depends on the heating rate employed. At 30 °C min-1,
the Tg shifts from -11 °C in the first run, to -1 °C in the second run
(+10 °C) for crude humins. At slower heating rate (i.e. 10 °C min -1) the T
g shifts from -14 °C to 5 °C (+19 °C). These shifts suggest
a modification of humins structure and environment when heating them above glass transition. The slower is the heating process, the longer is the time of permanence of humins at high temperatures, promoting cross-linking reactions in the humins. Indeed, the most important Tg variation between the first and the
second run is observed in case of lower heating ramp. The same shift in Tg (+18 °C at 10 °C.min-1 and +9 °C at 30 °C.min-1) is
observed in the vacuum dried sample for which mostly cross-linking occurs in the first heating. This confirms that the Tg
increase after heating to 180 °C is not attributed to the release of small molecules acting as plasticizer, but rather to modification of the humins’ structure through cross-linking. Table 2 summarize the value of the Tg for each sample before and after vacuum
drying.
Table 2. Tg of crude and vacuum dried humins at different heating rate,
obtained during the 1st and 2nd DSC scan
1st scan 2nd scan Crude humins (30 °C.min-1) -11 °C -1 °C Crude humins (10 °C.min-1) -14 °C 5 °C
Vacuum dried humins (30 °C.min-1)
-5 °C 4 °C
Vacuum dried humins (10 °C.min-1)
-10 °C 8 °C
Figure 3. Standard DSC data from crude humins sample at a heating rate 30 °C min-1 and 10 °C min-1 and vacuum dried humins sample at a heating rate 10 °C
min-1. -50 0 50 100 150 200 crude humins 10 °C min-1 H e a t fl o w (W g -1) Temperature (°C) 10 °C min-1 30 °C min-1
vacuum dried humins 0.2 W.g-1
2nd run
To try to better identify physical transitions and chemical reactions occurring in humins, stochastically temperature modulated DSC measurement was done on crude humins. Figure 4 shows results obtained by stochastically temperature modulated DSC. After treatment of the measured heat flow, the separation of reversing (φrev) and non-reversing (φnon-rev) heat flows can be obtained (Figure 4 top). Glass transition can be identified by the sigmoidal decrease of φrev around -20 °C (Figure 4 top), corresponding to a heat capacity increase (Figure 4 bottom). This is due to the transition from a more solid-like state to a more liquid-like state, meaning a significant increase of molecular mobility, determining the Tg of the material. The φnon-rev curve in Figure 4 shows a decreasing trend until 90 °C. An exothermal increase in the heat flow is observed around 130 °C. Starting from this temperature, mobility is hindered and chain mobility is limited, corresponding to a deep decrease of the heat capacity (Figure 4 bottom). The heat capacity decrease could correspond to the formation of a cross-linked network or could be attributed to loss of water/VOCs from the matrix. After a second DSC run of the same sample under the same condition, an increase of around 70°C of Tg is reported, confirming that crosslinks occurred during the first scan at 1 °C min-1. This also strengthen our believes that the exothermic thermal event observed during the first run is not the result of thermal degradation of the sample.
Figure 4. Topem DSC data from raw humins. Heating rate 1 °C min-1. Reversing
(φrev) and non-reversing (φ non-rev) heat flow (top) and heat capacity (bottom).
Thermogravimetric analysis was used to quantify the mass loss of crude and vacuum dried humins during heating (Figure 5 top). Two different regions can be easily identified observing the variation of the derivative of the weight loss curve (dTG), as observed in Figure 5 top. In the first region, up to around 110 °C, crude humins undergoes an almost constant mass loss, primary due to loss of volatiles. According to the TGA-MS studies of Hoang et al.[31] and to Tosi et al.[22],only water is released from
humins in this low temperature region. To obtain more information about other small volatiles, headspace GC-MS measurements were done respectively at 100 °C and 170 °C. The GC-MS relative area are presented in Supporting Information (Figure SI 1). Basically, furanics (i.e. HMF, MMF, furfural, methyl furfural) and oxygenated aliphatics (methanol, acetic acid etc.) are detected both at 100 °C and 170 °C. Logically, the total GC-MS area at 170 °C is more important compared to total area measured at 100 °C which indicates that more volatiles are formed at 170 °C. The amount of levulinics (i.e. levulinic acid and methyl levulinate) is very low at 100 °C and it becomes more important at 170 °C suggesting that furan ring opening reactions occur preferentially above 100 °C. These data are in good agreement with the Pyrolysis-GC-MS investigations of Hoang et al.[31] between 21 and
400 °C. However, compared to their studies, no phenolic derivatives were detected both at 100 ° and 170 °C. It suggests that phenolics would be formed at higher temperature.
As shown in Figure 5 top, crude humins lose around 3.3% of mass below 110 °C. For dried humins the mass loss is shifted to higher temperature with only 1.5 % of mass loss at 110 °C. This difference of about 1.8 % between crude and dried humins confirms that small volatiles such as physisorbed water have been partially removed after the vacuum drying treatment. Crude humins rate of mass loss is progressively increasing from 110 °C to 180 °C. At 180 °C both materials have lost around 12.5% of their initial mases.
In order to further investigate the influence of volatilization and in situ crosslinking on the molecular mobility of humins, Tg was
determined after heating at 1 °C min-1 and stopped at a given
temperature (Figure 5 bottom). No variation of the Tg is observed
compared to crude humins when the samples are heated up to 100 °C. This is in perfect agreement with the behavior of vacuum dried humins which present almost the same Tg as crude humins
(Figure 3). This means that most of the mass loss below 100 °C is due to loss of volatiles with practically no influence on humins’ chain motion. Tg starts increasing after heating up at temperatures
higher than 100 °C. Between 110 °C and 140 °C, a small Tg
variation is observed. It is likely that crosslinking occurs very slowly in this temperature region and that the effect on Tg is rather
limited (+ 7 °C). Above 140 °C, the rate of weight loss is faster. This is associated with a significant increase of the Tg when the
samples are heated in this temperature range. The condensation reactions that are likely to occur in this temperature range are promoted. This leads to important modification of the cross-link density in humins, thus greatly impacting their glass transition.
-100 -50 0 50 100 150 -0,5 0,0 0,5 1,0 1,5
Reversing heat flow
n o n -r e v (mW) Temperature (°C) Exo
Non-reversing heat flow
-0,20 -0,15 -0,10 -0,05 0,00 re v (mW) -100 -50 0 50 100 150 200 1.3 1.5 1.8 2.0 2.3 2.5 H e a t cap a ci ty (J. g -1 .K -1 ) Temperature (°C)
Figure 5. TG and dTG measurement of crude humins and vacuum dried humins, heating rate 1 °C min-1
(top). Tg variation of crude humins after heating up at
reference temperatures (x-axis) vs loss of mass loss studied by TGA (bottom).
Rheological behavior
The variation of the complex viscosity as function of angular frequency of crude humins is shown in Figure 6. The measurements were taken between 40 °C and 140 °C. Up to 140 °C, a decrease of the viscosity measured at low frequency is observed when increasing the temperature. For temperatures between 40 °C and 80 °C, the dependence of complex viscosity with angular frequency shows a quasi-constant. From 100 °C to 140 °C, humins show a non-Newtonian behavior, pointed by the variation of the viscosity with the angular frequency. At 40 °C and 60 °C humins are characterized by a shear thinning behavior. The viscosity slightly decreases at high shear rate meaning that the microstructure tends to align with the flow direction. This behavior is typically observed when some disentanglement or slippage of chains occurs. For temperature of 80 °C and above, humins rather show a shear thickening behavior, characterized by an increase of the viscosity when increasing the frequency. This is typically
due to structure rearrangements. This phenomenon becomes very significant at temperature above 100 °C.
Figure 6. Variation of the complex viscosity as function of angular frequency at 40 °C, 60 °C, 80 °C, 100 °C, 120 °C, 140 °C.).
At high temperature, viscosity is very low (<1 Pa.s) and accordingly humins macromolecules start to have high mobility. Chains may open-up and stretch, exposing parts of the macromolecule capable of forming transient intermolecular associations, and thus helping formation of a different microstructure. At 120 °C and 140 °C, the shear thickening starts at much lower frequencies (5 Hz and 2 Hz respectively) and it exhibits much higher amplitude (from 100 Pa.s to 103 Pa.s).
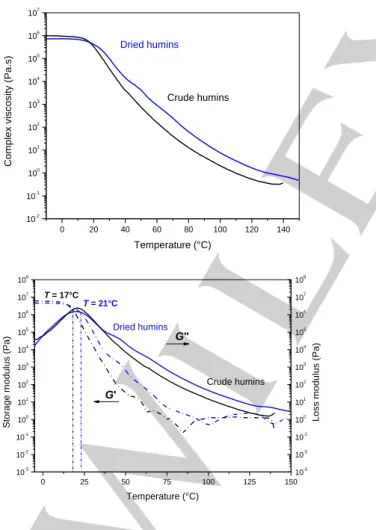
The variation of the complex viscosity and the storage and loss moduli as function of temperature for crude and dried humins is shown in Figure 7. Figure 7 (top) clearly shows the viscosity decreases when temperature increases. Nevertheless, when the sample reaches 120 °C – 140 °C, the decrease in viscosity is less significant due to loss of volatiles and beginning of crosslinking reactions. At very low temperature, i.e. between -15 °C and 15 °C, the viscosity slightly decreases with the temperature. Viscosity decreases significantly above 15 °C. These behaviors are observed in both crude and dried samples. Dried sample shows a delay in decreasing of the viscosity. This again proves that some of the water and small molecules present in crude humins have been removed, slightly increasing the viscosity of the material. To better understand this complex behavior, storage (G’) and loss (G’’) moduli were measured and are shown as function of temperature in Figure 7 (bottom). In crude humins, a cross-over between G’ and G’’ occurs at around 17 °C. The same cross-over can be observed at 21 °C in dried humins. Below these temperatures, the samples behave more solid-like, showing almost no variation of viscosity with temperature. Above these temperatures, G’’ is higher than G’, which means the material starts behaving more liquid-like, and the viscosity significantly decreases with the temperature increase. The difference on the cross-over temperature between crude humins and vacuum dried humins are in agreement with the difference of Tg during the first
50 100 150 85 90 95 100 W e ig h t (% ) Temperature (°C) -0,00006 -0,00004 -0,00002 0,00000 d T G (1 /s) Crude humins Dried Humins 20 40 60 80 100 120 140 160 180 200 85 90 95 100 W e ig h t (% ) Temperature (°C) -20 0 20 40 60 Tg (° C ) 0,1 1 10 100 10-1 100 101 102 103 C o mp le x vi scosi ty (Pa.s) Angular frequency (Hz) 40°C 60°C 80°C 100°C 120°C 140°C
DSC scan (Figure 3). Crude humins have a liquid-like behavior up to around 90 °C. The same happens for dried humins samples, with a delay of about 10 °C. Amplitude of 0.1% was used throughout the whole measurement. This might create artifacts when the material goes from a more solid-like to a more liquid-like behavior, exemplified by the G’ fluctuations between 50 and 90 °C. This might also be affected by loss of volatiles during the heating up. Indeed, G’ is more sensitive to this fluctuation, being significantly lower than G’’ at this temperature. This behavior can be correlated to what observed in Figure 5. Up to around 100 °C, humins undergoes loss of weakly-bonded water on the surface. Starting from 100 °C, elastic modulus stops decreasing and its variation with temperature becomes almost linear. This is due to loss of volatiles, and beginning of cross-linking reactions that lead to level-off the decrease of G’ with the temperature. This behavior is indeed affecting also the variation of viscosity with temperature, showing a decrease in the slope of the viscosity decrease for temperatures higher than 90 °C. Viscosity, storage modulus and loss modulus tends to be constant for temperature higher than 130 °C. At this temperature, these parameters are regulated by formation of cross-linking which compensate the viscosity decrease due to temperature increase.
Figure 7. Evolution of complex viscosity (top). Storage modulus (dash line) and loss modulus (solid line) (bottom) as function of temperature. Heating rate 1 °C min-1.
Effect of thermal treatment
Based on these previous results, effect of thermal treatment at 120 °C and 140 °C was studied. This temperature range seems to be the most suitable to better understand cross-linking reactions occurring in humins and the capacity of this material to build new cross-links.
Figure 8 shows the variation of the Tg of humins after isothermal
treatment at 120 °C and 140 °C for different hours. At this temperature, the thermal treatment is sufficiently high to induce formation of cross-links and thus to impact significantly the glass transition temperature. The Tg increase reflects the reduction of
molecular mobility due to formation of cross-links between the chains. For isothermal treatment at 120 °C, the increase of Tg is
almost linear for the first 24 hours. After ~ 24 hours of thermal annealing at 120 °C a plateau is reached and the Tg is not
increasing further than around 70 °C. In case of thermal treatment at 140 °C, a sharp increase in the Tg is observed already in the
first few hours. After 4 hours at 140 °C, the Tg is already increased
of ~ 65 °C. Above 4 hours of thermal annealing, the Tg increase
is low, and again a plateau at around 70 °C is reached. These results suggest that the formation of new interconnections is almost complete and an “infinite” glass transition is reached. This agrees with the model of thermoset resins, such as epoxy resins, which reach a so-called “infinite” glass transition temperature (Tg,∞) when the degree of cross-linking is maximal.
Figure 8. Tg evolution in humins at different time of thermal treatment at 120 °C
and 140 °C.
To obtain more insights concerning the effect of thermal treatment on the final structure and properties of humins, UPLC, GC, and elemental analysis were performed. Humins samples were shown to be very rich in free monomeric units. GC and UPLC analysis were tested on thermally treated samples to obtain more information concerning the variation of monomers concentration inside the samples. Hydroxymethylfurfural (HMF), methoxymethylfurfural (MMF) and levulinic acid (LA) were
0 20 40 60 80 100 120 140 10-2 10-1 100 101 102 103 104 105 106 107 Dried humins C o mp le x vi scosi ty (Pa.s) Temperature (°C) Crude humins 0 25 50 75 100 125 150 10-3 10-2 10-1 100 101 102 103 104 105 106 107 108 T = 21°C G' St o ra g e mo d u lu s (Pa) Temperature (°C) T = 17°C G'' Crude humins Dried humins 10-3 10-2 10-1 100 101 102 103 104 105 106 107 108 L o ss mo d u lu s (Pa) -10 0 10 20 30 40 50 60 70 -40 -20 0 20 40 60 80 Treated at 120o C Treated at 140oC G la ss tra n si ti o n t e mp e ra tu re ( o C)
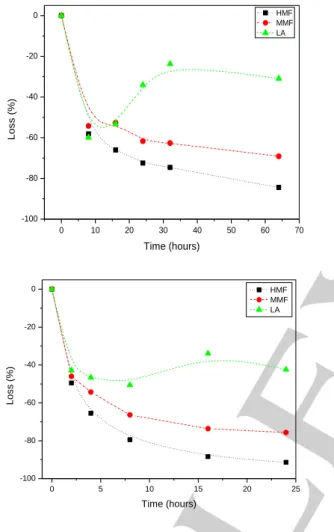
detected. The analysis was done on raw humins and compared with samples thermally treated at 120 °C and 140 °C for different hours. Figure 9 shows the loss of the monomeric units compared with raw humins after thermal treatment at 120 °C (top) and at 140 °C (bottom). HMF, MMF and LA concentration sharply decreases already after the first few hours of treatment and keep on decreasing for all the time of treatment.
Figure 9. GC and UPLC analysis from humins thermally treated at 120 °C (top) and 140 °C (bottom) for different time.
The effect of thermal treatment at 120 °C for 8 hours is comparable to the effect of thermal treatment at 140 °C for 2 hours: monomer concentration almost halves. It is significant to observe that for longer time of treatment the decrease in monomer concentrations is less pronounced, most of all when treating at 120 °C. Decrease in HMF and MMF concentration is partially due to monomers volatizing during the thermal treatment and partially due to cross-linking reaction with humins. This is in good agreement with the Headspace GC-MS investigations (Figure SI 1) that highlight volatilization of HMF and MMF at 100 and 170 °C. In case of LA, a sharp decrease of monomer concentration is followed by an increase in LA. Probably, it indicates that after a certain time of thermal treatment LA is
produced over time. This is again in very good agreement with the conclusions obtained from the HeadSpace GC-MS data which showed that levulincs are preferentially formed above 100 °C. It confirms that at these temperatures furan ring opening can occur thus leading to the formation of LA in the media. This was for instance observed during the polycondensation of furfuryl alcohol.[43]
Elemental analysis of long time thermal treated samples does not show a significant variation in the final composition. A slight increase in C concentration, in favor of a decrease in mainly O concentration and H concentration is observed in Table 3.
Table 3. Elemental analysis of raw humins and long-time thermal treated humins. Raw humins Humins 24h@120°C Humins 64h@120°C Humins 24h@140°C C (mass %) 56.53 57.99 58.60 59.65 H (mass %) 5.49 5.05 4.93 4.94 O (mass %) 37.5 35.8 35.4 35.1 H/C 1.17 1.05 1.01 0.99 O/C 0.50 0.46 0.45 0.44
The data are visualized by a van Krevelen plot in Figure 10. During the treatment, the ratio of H atoms lost per O atoms is around 2.2 : 1, nearly corresponding to the dehydration ratio (i.e. 2 : 1). This slight difference is explained by the volatilization of other compounds such as furanics, levulinics and oxygenate aliphatics, as shown in Figure SI1. The data are in agreement with what observed in previous study after severe thermal treatment.[37,38] This suggests that water was released during the
treatment. This could be related to water contained in the humins but also from water released during condensation reactions. Indeed the condensation of free HMF onto humins leads to an increase of C content with respect to O/H content. At sufficiently high temperature dehydration of hydroxyl groups can also occurs.
Figure 10. van Krevelen plot showing changes in the elemental composition of raw humins and thermally treated humins.
0 10 20 30 40 50 60 70 -100 -80 -60 -40 -20 0 HMF MMF LA L o ss (% ) Time (hours) 0 5 10 15 20 25 -100 -80 -60 -40 -20 0 HMF MMF LA L o ss (% ) Time (hours) 0,75 1,00 1,25 0,375 0,500 0,625 24h@120°C O /C H/C 64h@120°C 24h@140°C -H 2O Raw humins
Conclusions
This study has shown that humins is a highly promising biobased thermoset material. Depending on the thermal treatment conditions, it is possible to obtain material with different Tg,
different structure and different properties. First, condensation reactions after thermal treatment of humins are shown in IR data, particularly reflected in the decreasing of O-H bond to C-H bond intensities. DSC measurements of crude and vacuum dried humins highlight that physi-sorbed volatiles have practically no influence on the molecular mobility of humins. However, the initiation of crosslinking and further volatilization in a temperature range between 120 °C and 140 °C lead to important increase of the glass transition. An infinite glass transition of ~70 °C can be obtained after Rheological properties were analyzed. Important information concerning the microstructure of the material and the flowing behavior at different temperature were obtained. The behavior of humins after thermal treatment was investigated. Depending on the temperature used, time of reaction can be set to obtain different final properties. An infinite Tg of ~70 °C can be
obtained after adequate thermal treatment. Variation of the final structure and composition was investigated by liquid and gas chromatography and elemental analysis. This study set the basis for future research in the field of humins based resin. The ability of crosslinking at different conditions was demonstrated, suggesting a wide range of new applications as biobased thermoset materials. These results are therefore of great interest and importance for valorization of this industrial biopolymer.
Experimental Section
Material and reaction conditions
Humins were supplied by Avantium Chemicals and produced in their pilot plant in Geleen, The Netherlands, by conversion of fructose and glucose. Humins were treated under vacuum to remove volatiles components. Humins appear as a very viscous, sticky and black liquid. Vacuum dried humins sample was prepared by heating humins at 60 °C for 48 hours under vacuum. Humins were thermally treated to obtain a less sticky and finally solid material. Five different samples of approximately three to five grams of humins were prepared and heated at 120 °C respectively for 2 hours, 4 hours, 8 hours, 16 hours and 24 hours. In addition, five different samples of approximately three to five grams of humins were prepared and heated at 140 °C respectively for 2 hours, 4 hours, 8 hours, 16 hours and 24 hours.
Infrared spectroscopy
A Bruker tensor 27 – FTIR spectrometer equipped with a nitrogen-cooled MCT detector, was used to characterize samples using a 1 reflection diamond ATR device. The variation in the structure following thermal treatment was studied. Spectra of raw humins and the 10 thermal treated samples were registered. The spectrum of air was recorded as background before each measurement. A total of 64 scans with a resolution of 2 cm-1 were recorded for each sample.
Differential scanning calorimetry
Conventional differential scanning calorimetry (DSC) and stochastically temperature modulated differential scanning calorimetry (TOPEM® by Toledo) measurements were performed on a heat flux Mettler-Toledo DSC-1 and STAR© software was used for data analysis.
Temperature, enthalpy and tau lag calibrations were performed using indium and zinc standards. 5 to 10 mg of humins were placed in a 40 µL aluminium crucible and closed by a pan lid. The experiments were done under air flow (80 mL min−1). Glass transition temperatures (T
g) were
determined as the inflection point of the specific heat (Cp) increment. Crude and dried humins were measured by regular DSC with a scanning temperature ranging from -60 °C to 180 °C. To erase the thermal history and to avoid overshoot at the glass transition, the samples were cooled and heated at the same rate. Two different set of cooling/heating rates were employed, 30 °C min-1 and 10 °C min-1. First the raw samples were cooled from 25 °C to -60 °C at either 10 or 30 °C min-1 and then heated at the same heating rate (i.e. 10 or 30 °C min-1) between -60 °C and 180 °C. Stochastically temperature modulated DSC measurements were used to study variations of heat flow and heat capacity. The temperature program used in this case is based on a linear temperature and/or isothermal segment, at which small temperatures perturbations are imposed. Then, the so-called “reversing” and “non-reversing” heat flows can be determined after mathematical treatment of the measured data. Moreover, the quasi-static heat capacity (Cp,0) and the frequency-dependent heat capacity can
be determined over a given frequency range in one single measurement. The quasi-static heat capacity is determined by performing an isothermal segment at which small temperatures perturbations are imposed. The non-isothermal measurements were taken in a temperature range from -60 °C to 180 °C. Measurements were done at a heating rate of 1 °C min-1. Quasi-isothermal heat capacity of raw humins at 60 °C, 100 °C, 120 °C and 140 °C was also studied by TOPEM®. The amplitude of the temperature perturbation was fixed at 0.5 °C for all the stochastically modulated experiments and the period of pulses was ranging from 15 to 30 s. Thermally treated samples were studied by standard DSC to check variation of glass transition temperature (Tg), at a heating rate of 30 °C min
-1. Conventionally, exothermic thermal events are represented up in all the figures. All measurements were repeated on 5 different samples to minimize the standard deviation.
Headspace gas chromatography - mass spectroscopy (GC-MS)
GC-MS with two splitless injectors and an autosampler and a headspace-autosampler was used. GC is equipped with a FID and a mass selective detector (MSD) as detector. Only MSD was used. A small amount of humins (between 10 to 15 mg) was weighted in a 20 ml vial. The vial was heated and shaken for 2 hours in the headspace autosampler. A small amount of the vapour is analysed with GC-MS.
Thermogravimetric analysis
Thermogravimetric measurements (TG) were carried out on a TGA/DSC3+ from Mettler-Toledo. Samples were measured at a heating rate of 1 °C min-1 under air flow (80 mL min-1). It was decided to use a method as similar as possible to the DSC measurements, to register the mass loss of the samples during these experiments. All measurements were repeated on 5 different samples to minimize the standard deviation.
Rheology
The viscosity of crude and vacuum humins was registered with a Thermo Scientific HAAKE MARS rheometer. Measurements were obtained on plate-plate geometry (25 mm diameter and 1 mm gap) at increasing temperatures (40 °C, 60 °C, 80 °C, 100 °C, 120 °C, 140 °C). Humins’ linear viscoelastic region was defined for each temperature by a strain sweep. Then the material was characterized using a frequency sweep at a strain below the critical strain. The values of complex viscosity, storage and loss modulus were registered at decreasing angular frequency (10 to 0.1 Hz). Humins were also tested in temperature sweep mode, from -15 °C to 140 °C, with a heating rate of 1 °C min-1. Complex viscosity, storage and loss modulus variation with temperature were analysed. All measurements were repeated on 5 different samples to minimize the standard deviation.
Gas chromatography (GC) and ultra-performance liquid chromatography (UPLC)
Impurities present in raw humins and thermal treated humins were investigated by GC and UPLC. An Interscience Trace GC equipped with FID detector and column VF WAXms, 0.25 mm id, film thickness 0.25 µm was used. The sample was dissolved in external standard solution and water before analysis. UPLC analyses were performed with a column Waters Acquity UPLC HSS C18, 2.1x100 mm, 1.8 µm, equipped with UV and ELSD detectors. Samples were dissolved in acetonytrile and water before testing.
Elemental analysis
All elemental analyses were performed by Mikroanalytisches Labor Pascher, Germany.
Acknowledgements
This work was carried out in the framework of the European Project HUGS «HUmins as Green and Sustainable precursors of eco-friendly building blocks and materials» Innovative Training Networks (ITN) Call: H2020-MSCA-ITN-2015-EID. The authors also wish to thank Mettler-Toledo Inc. for fruitful collaboration.
Keywords: humins • thermal behaviour • thermosetting resin •
biomass • biorefinery
[1] B. R. Caes, R. E. Teixeira, K. G. Knapp and R. T. Raines 2015, ACS
Sustain. Chem. Eng., 3, 2591–2605.
[2] J. M. Pin, N. Guigo, A. Mija, L. Vincent, N. Sbirrazzuoli, J. C. Van Der Waal and E. De Jong 2014 ACS Sustain. Chem. Eng., 2, 2182– 2190.
[3] L. Filiciotto, A. M. Balu, J. C. Van der Waal and R. Luque 2017, Catal. Today, 302, 2-15
[4] Van Zandvoort, Y. Wang, C. B. Rasrendra, E. R. H. Van Eck, P. C. A. Bruijnincx, H. J. Heeres and B. M. Weckhuysen 2013,
ChemSusChem, 6, 1745–1758.
[5] J. Kumalaputri, C. Randolph, E. Otten, H. J. Heeres and P. J. Deuss 2018, ACS Sustain. Chem. Eng., 6, 3419–3425.
[6] Girisuta, L. P. B. M. Janssen and H. J. Heeres 2006, Chem. Eng.
Res. Des., 84, 339–349.
[7] Girisuta, L. P. B. M. Janssen, H. J. Heeres, A. Morone, M. Apte, R. A. Pandey, K. Yan, C. Jarvis, J. Gu, Y. Yan, N. A. S. Ramli, N. A. S. Amin, S. X. Chin, C. H. Chia, S. Zakaria, Z. Fang and S. Ahmad 2015, Renew. Sustain. Energy Rev., 51, 986–997.
[8] B. Girisuta, L. P. B. M. Janssen and H. J. Heeres 2006, Green
Chem., 8, 701.
[9] R.-J. van Putten, J. van der Waal, E. de Jong, B. Rasrendra, H. J. Heeres and J. G. de Vries 2013, Chem.Rev., 113, 1499–1597. [10] J. J. E. Eerhart, M. K. Patel and A. P. . Faaij 2015, Biofuels, Bioprod.
Biorefining, 9, 307–325.
[11] P. Imhof, A. S. Dias and G. J. G. de Jong, Nam.Confex.Com, 2008, 1446, 2008–2008.
[12] E. De jong, M. A. Dam, L. Sipos and G.-J. . Gruter 2011, Soc. Plast.
Eng. - EUROTEC 2011 Conf. Proc., 1–13. [13] Schweizer 1937,Rec. Trav. Chim., 57, 345–382.
[14] S. K. R. Patil and C. R. F. Lund 2011, Energy and Fuels, 25, 4745– 4755.
[15] V. Sumerskii, S. M. Krutov and M. Y. Zarubin 2010, Russ. J. Appl.
Chem., 83, 320–327.
[16] G. Tsilomelekis, M. J. Orella, Z. Lin, Z. Cheng, W. Zheng, V. Nikolakis and D. G. Vlachos 2016, Green Chem., 18, 1983–1993. [17] S. Constant, C. S. Lancefield, B. M. Weckhuysen and P. C. A.
Bruijnincx 2017, ACS Sustain. Chem. Eng., 5, 965–972.
[18] S. K. R. Patil, J. Heltzel and C. R. F. Lund 2012, Energy and Fuels, 26, 5281–5293.
[19] Z. Cheng, J. Everhart, G. Tsilomelekis, V. Nikolakis, B. Saha and D. Vlachos 2018, Green Chem., 20(5), 997-1006
[20] J. Herzfeld, D. Rand, Y. Matsuki, E. Daviso, M. Mak-Jurkauskas and I. Mamajanov 2011, J. Phys. Chem. B, 115, 5741–5745.
[21] L. Filiciotto, A. M. Balu, A. A. Romero, E. Rodríguez-Castellón, J. C. van der Waal and R. Luque 2017, Green Chem., 19, 4423–4434. [22] P. Tosi, G. P. M. van Klink, A. Celzard, V. Fierro, L. Vincent, E. de
Jong and A. Mija 2018, ChemSusChem, 11(16), 2797-2809 [23] van Zandvoort, E. J. Koers, M. Weingarth, P. C. A. Bruijnincx, M.
Baldus and B. M. Weckhuysen 2015, Green Chem., 17, 4383–4392. [24] Mija, J. C. van der Waal, J. M. Pin, N. Guigo and E. de Jong 2017,
Constr. Build. Mater., 139, 594–601.
[25] T. M. C. Hoang, E. R. H. van Eck, W. P. Bula, J. G. E. Gardeniers, L. Lefferts and K. Seshan, 2015, Green Chem., 17, 959–972. [26] L. Filiciotto, G. De Miguel, A. M. Balu, A. A. Romero, J. C. Van Der
Waal and R. Luque 2017, Chem. Commun., 53, 7015–7017. [27] S. Kang, J. Fu, G. Zhang, W. Zhang, H. Yin and Y. Xu 2017,
Polymers (Basel)., 9, 373.
[28] F. Björnerbäck, D. Bernin and N. Hedin 2018, ACS Omega, 3, 8537–8545.
[29] S. Kang, J. Fu, Z. Deng, S. Jiang, G. Zhong, Y. Xu, J. Guo and J. Zhou 2018, Sustain., 10, 16–19.
[30] D. Chernysheva, Y. Chus, V. Klushin, T. Lastovina, L. Pudova, N. Smirnova, O. Kravchenko, V. Chernyshev and V. P. Ananikov 2018, ChemSusChem, DOI:10.1002/cssc.201801757.
[31] T. M. C. Hoang, L. Lefferts and K. Seshan 2013, ChemSusChem, 6, 1651–1658.
[32] Y. Wang, S. Agarwal, A. Kloekhorst and H. J. Heeres, 2016,
ChemSusChem, 9, 951–961.
[33] D. G. Vlachos, Z. Cheng and B. Saha, ChemSusChem, DOI:10.1002/cssc.201801535.
[34] Y. Wang, S. Agarwal and H. J. Heeres 2017, ACS Sustain. Chem.
Eng., 5, 469–480.
[35] Y. Wang, S. Agarwal, Z. Tang and H. J. Heeres 2017, RSC Adv., 7, 5136–5147.
[36] S. G. Maerten, D. Voß, M. A. Liauw and J. Albert 2017,
ChemistrySelect, 2, 7296–7302.
[37] S. Agarwal, D. van Es and H. J. Heeres 2017, J. Anal. Appl.
Pyrolysis, 123, 134–143.
[38] C. B. Rasrendra, M. Windt, Y. Wang, S. Adisasmito, I. G. B. N. Makertihartha, E. R. H. Van Eck, D. Meier and H. J. Heeres 2013,
J. Anal. Appl. Pyrolysis, 104, 299–307.
[39] H. Janshekar and a Fiechter 1983, Adv. Biochem. Eng. Biotechnol., 27, 119–178.
[40] N. Guigo, A. Mija, L. Vincent and N. Sbirrazzuoli 2009, Phys. Chem.
Chem. Phys., 11, 1227–36.
[41] Y. I. Matveev, V. Y. Grinberg and V. B. Tolstoguzov 2000, Food
Hydrocoll., 14, 425–437.
[42] T. Hatakeyama, H. Hatakeyama in Thermal properties of green
polymers and biocomposites (Vol. 4), Springer Science & Business
Media, 2006
[43] G. Falco, N. Guigo, L. Vincent and N. Sbirrazzuoli 2018,
ChemSusChem, 11, 1805–1812.
Entry for the Table of Contents (Please choose one layout)
Layout 1:
FULL PAPER
Focus on humins, a co-product from biorefineries, to highlight their capacity to tune their structures and properties upon thermal treatment.Anna Sangregorio, Nathanael Guigo,* Jan C. van der Waal, Nicolas Sbirrazzuoli,*
Page No. – Page No.
Humins from biorefineries
as thermo-reactive
macromolecular systems
Layout 2:
FULL PAPER
Text for Table of Contents
Author(s), Corresponding Author(s)*
Page No. – Page No. Title