HAL Id: hal-02969136
https://hal.archives-ouvertes.fr/hal-02969136
Submitted on 19 Oct 2020
HAL is a multi-disciplinary open access
archive for the deposit and dissemination of
sci-entific research documents, whether they are
pub-lished or not. The documents may come from
teaching and research institutions in France or
abroad, or from public or private research centers.
L’archive ouverte pluridisciplinaire HAL, est
destinée au dépôt et à la diffusion de documents
scientifiques de niveau recherche, publiés ou non,
émanant des établissements d’enseignement et de
recherche français ou étrangers, des laboratoires
publics ou privés.
Pronounced and unavoidable impacts of low-end global
warming on northern high-latitude land ecosystems
Akihiko Ito, Christopher Reyer, Anne Gädeke, Philippe Ciais, Jinfeng Chang,
Min Chen, Louis François, Matthew Forrest, Thomas Hickler, Sebastian
Ostberg, et al.
To cite this version:
Akihiko Ito, Christopher Reyer, Anne Gädeke, Philippe Ciais, Jinfeng Chang, et al.. Pronounced
and unavoidable impacts of low-end global warming on northern high-latitude land ecosystems.
En-vironmental Research Letters, IOP Publishing, 2020, 15 (4), pp.044006. �10.1088/1748-9326/ab702b�.
�hal-02969136�
LETTER • OPEN ACCESS
Pronounced and unavoidable impacts of low-end global warming on
northern high-latitude land ecosystems
To cite this article: Akihiko Ito et al 2020 Environ. Res. Lett. 15 044006
View the article online for updates and enhancements.
Environ. Res. Lett. 15(2020) 044006 https://doi.org/10.1088/1748-9326/ab702b
LETTER
Pronounced and unavoidable impacts of low-end global warming on
northern high-latitude land ecosystems
Akihiko Ito1,2 , Christopher P O Reyer3 , Anne Gädeke3 , Philippe Ciais4 , Jinfeng Chang4 , Min Chen5 , Louis François6 , Matthew Forrest7 , Thomas Hickler7,8 , Sebastian Ostberg3 , Hao Shi9 , Wim Thiery10,11and Hanqin Tian9
1 National Institute for Environmental Studies, Tsukuba 305-8506, Japan
2 Japan Agency for Marine-Earth Science and Technology, Yokohama 236-0001, Japan
3 Potsdam Institute for Climate Impact Research, Member of the Leibniz Association, Telegrafenberg, 14412 Potsdam, Germany 4 Laboratoire des Sciences du Climate et de l’Environment, IPSL-LSCE, CEA-UVSQ-UPSACLAY, Gif sur Yvette F-91191, France 5 Joint Global Change Research Institute, Pacific Northwest National Laboratory, College Park, MD 20740, United States of America 6 U R SPHERES, Univeristé de Liège, Liège B-4000, Belgium
7 Senckenberg Biodiversity and Climate Research Centre(BiK-F), Senckenberganlage 25, D-60325 Frankfurt am Main, Germany 8 Department of Physical Geography, Goethe University, Altenhöferallee1, D-60438 Frankfurt am Main, Germany
9 International Center for Climate and Global Change Research, School of Forestry and Wildlife Sciences, Auburn University, Auburn, AL
36849, United States of America
10 ETH Zurich, Institute for Atmospheric and Climate Science, Universitaetsstrasse 16, 8092 Zurich, Switzerland 11 Vrije Universiteit Brussel, Department of Hydrology and Hydraulic Engineering, Pleinlaan 2, B-1050 Brussels, Belgium
E-mail:itoh@nies.go.jp
Keywords: biome sector, ISIMIP2b, northern high latitudes, Paris agreement, climatic impacts Supplementary material for this article is availableonline
Abstract
Arctic ecosystems are particularly vulnerable to climate change because of Arctic amplification. Here,
we assessed the climatic impacts of low-end, 1.5
°C, and 2.0 °C global temperature increases above
pre-industrial levels, on the warming of terrestrial ecosystems in northern high latitudes
(NHL, above
60
°N including pan-Arctic tundra and boreal forests) under the framework of the Inter-Sectoral
Impact Model Intercomparison Project phase 2b protocol. We analyzed the simulated changes of net
primary productivity, vegetation biomass, and soil carbon stocks of eight ecosystem models that were
forced by the projections of four global climate models and two atmospheric greenhouse gas pathways
(RCP2.6 and RCP6.0). Our results showed that considerable impacts on ecosystem carbon budgets,
particularly primary productivity and vegetation biomass, are very likely to occur in the NHL areas.
The models agreed on increases in primary productivity and biomass accumulation, despite
considerable inter-model and inter-scenario differences in the magnitudes of the responses. The
inter-model variability highlighted the inadequacies of the present models, which fail to consider
important components such as permafrost and wild
fire. The simulated impacts were attributable
primarily to the rapid temperature increases in the NHL and the greater sensitivity of northern
vegetation to warming, which contrasted with the less pronounced responses of soil carbon stocks.
The simulated increases of vegetation biomass by 30–60 Pg C in this century have implications for
climate policy such as the Paris Agreement. Comparison between the results at two warming levels
showed the effectiveness of emission reductions in ameliorating the impacts and revealed unavoidable
impacts for which adaptation options are urgently needed in the NHL ecosystems.
1. Introduction
Terrestrial ecosystems, especially in the northern high latitude (NHL) area, are predicted to undergo
substantial impacts associated with changes of land use and climate in the next several decades (Wars-zawski et al2013, IPCC2014,2019). Such changes in
terrestrial ecosystems are likely to influence human
OPEN ACCESS
RECEIVED
3 October 2019
REVISED
25 January 2020
ACCEPTED FOR PUBLICATION
27 January 2020
PUBLISHED
13 March 2020
Original content from this work may be used under
the terms of theCreative
Commons Attribution 4.0 licence.
Any further distribution of this work must maintain attribution to the author(s) and the title of the work, journal citation and DOI.
societies through deterioration of ecosystem services such as climate regulation, recreational services, and provision of foods and goods (Malinauskaite et al
2019). Moreover, the fact that changes in ecosystem
structures and functions are highly likely to exert climatic feedbacks on the human-induced warming (e.g. Arora et al2013) demands that we understand
and predict the ecosystem responses to global change. Ecosystems in the NHL region will be exposed to climatic warming greater than the global average (IPCC2013, Post et al2019) and may thus be strongly
impacted. Biological processes such as plant leaf phe-nology, primary production, and soil decomposition in the temperature-limited environments of the NHL are particularly sensitive to climatic warming (McGuire et al2009, Richardson et al2018). One of the
characteristics of changes in terrestrial ecosystems is that they occur over temporal scales that range from instantaneous (e.g. photosynthetic gas exchange) to centuries or millennia. Examples of the latter include vegetation succession(Hickler et al2012), tree
migra-tion(Neilson et al2005), and soil development.
Trans-formation of carbon cycling in the NHL region has attracted particular attention as an early warning of climatic impacts on ecosystems and in relation to cli-mate–carbon cycle feedbacks. Changes in northern plant productivity have been deduced from the ampli-fication of the seasonal cycle of atmospheric CO2
con-centrations (e.g. Graven et al 2013). Also, greening
trends of northern vegetation have been detected by satellite observations for decades(Myneni et al1997, Goetz et al2005, Piao et al2020). In contrast, soils in
the NHL, especially perennially frozen soils, are likely to be degraded by physical and biological decomposi-tion related to rapid temperature rise (Schuur et al
2015, Crowther et al2016). It is uncertain whether the
NHL is functioning as a net carbon sink or a source and how the system is changing. Nevertheless, the pre-sence of large carbon stocks in the NHL region(e.g. 1100–1500 Pg C in the permafrost region; Hugelius et al2014) suggests that there is potential for a strong
climate–carbon cycle feedback that will likely act as a positive climate feedback (Schuur et al 2015). The
likely interactions of ecological processes such as vege-tation demography and disturbances with climatic warming will increase the risk of transgressing tipping points for boreal forest dieback and permafrost thaw-ing in this region(Lenton et al2008, Schaphoff et al
2016, Natali et al 2019). In the end, the balance
between the positive effect of increasing productivity versus the negative effect of soil warming will deter-mine future changes of the NHL carbon balance.
At the 21st Conference of the Parties of the United Nations Framework Convention of Climatic Change, a milestone agreement about global warming mitiga-tion, the Paris Agreement, was negotiated and agreed upon by 196 state parties. The goal of the agreement was to keeo the global temperature rise well below 2°C (hopefully 1.5 °C) above pre-industrial levels. To
reinforce the scientific background to these temper-ature targets, intensive assessments have been con-ducted of various sectors such as water resource, agricultural production, and human health (e.g. Jahn2018, Schleussner et al2018). Special reports on
the 1.5°C/2.0 °C climate targets and associated reports with foci on terrestrial, ocean, and cryospheric systems have been published by the Intergovern-mental Panel on Climate Change(IPCC2018,2019).
These reports address various aspects of natural and human systems and demonstrate a higher risk of nega-tive impacts by a 2°C warming versus 1.5 °C or less. Several studies have assessed the NHL region, but they have usually focused on high-end global warming pro-jections(Ito et al2016, McGuire et al2018). More
spe-cific and in-depth analyses using the latest available low-end climate projections are required to better understand climatic impacts in NHL areas so that the effectiveness and limitations of the Paris Agreement can be adequately discussed in terms of climate policy. Several analyses have been conducted in the NHL region, but their reliability and uncertainty differ among sectors because of uneven scientific under-standing and data availability. Impacts on biological systems and related risks are, compared to physical systems, even more difficult to evaluate, because bio-logical systems are very heterogeneous and complex (e.g. non-linear responses, acclimation, and interac-tions among organisms).
This study focused on the impacts of low-end glo-bal warming scenarios(1.5 °C and 2.0 °C versus pre-industrial temperatures) on NHL ecosystems in a miti-gation-oriented world, in accordance with the Paris Agreement. For this purpose, we used output data from eight global vegetation models that contributed to the Inter-Sectoral Impact Model Intercomparison Project(ISIMIP) phase 2b and focused on properties related to the carbon cycle. The ISIMIP phase 2b experiments were designed specifically to quantify impacts of low-end global warming on a mitigation-oriented world using multiple impact models(Frieler et al2017). Use of these ensembles allowed us to assess
the ranges of inter-scenario and inter-model varia-bility. Assessment of drastic and extreme events and phenomena that unfold on a centennial or longer timeframe was beyond the primary scope of this work. Such an assessment would be better conducted by other experiments specifically designed with many ensemble simulations and improved benchmarking models. Our study complements previous work and enabled us to analyze at regional to global scales multi-year and multi-decadal phenomena such as time-lag-ged responses and system transformations that can emerge gradually, especially in ecosystems. Considera-tion of such issues is highly relevant to policy makers.
2. Methods
2.1. ISIMIP2b experiments
The ISIMIP2b experiments were designed primarily to assess the impacts of 1.5°C and 2.0 °C global warming above pre-industrial levels(Frieler et al2017). To allow
analyses of multiple sectors, the protocol describes several simulations that combine greenhouse gas emission pathways, associated land-use patterns, and climate projections consistent with the representative concentration pathway(RCP) 2.6 and 6.0 (van Vuuren et al 2011). In addition to a pre-industrial control
experiment (in this study, used only for checking stability after initialization), the models performed historical (1860–2005), future (2006–2099), and extended future(2100–2299) simulations. Both RCPs assumed the middle-of-the-road socioeconomic path-way, SSP2(Fricko et al2017), but differed with respect
to climate stabilization targets and mitigation policy. The RCP 2.6 scenario represents a mitigation-oriented scenario, in which the degree of global warming may not exceed 2.0°C above pre-industrial levels for an extended period of time, though it may overshoot that target temporarily. To assess long-term, more gradual impacts, climate projections for RCP2.6 were extended to 2299. The RCP6.0 represents a scenario with limited mitigation, in which the degree of global warming may well exceed 2.0°C. This scenario allowed us to assess rapid global warming impacts and put the low-end warming impacts into the context of a wider risk analysis.
This study used the simulation outputs from the ISIMIP global vegetation models (‘biome models’, which are described in the next section) in the histor-ical and future projection periods. Most biome models were integrated at a spatial resolution of 0.5°×0.5° in latitude and longitude and driven by bias-corrected data from as many as four global climate models (GCMs) to cover the range of inter-model variability: GFDL-ESM2M, HadGEM2-ES, IPSL-CM5A-LR, and MIROC5(Frieler et al2017; seefigure S1 is available online atstacks.iop.org/ERL/15/044006/mmediafor their global mean temperatures). The extended cli-mate projections for the period 2100–2099 were sup-plied by only the HadGEM2-ES, IPSL-CM5A-LR, and MIROC5 GCMs. The EarthH2Observe, WFDEI, and ERA-interim climate data were merged for the period from 1979 to 2013 and were used to correct the bias of the climate models(Lange2018). In the historical
per-iod, atmospheric CO2and land-use conditions
chan-ged annually in most models, except for one model (CLM4.5) that used the land-use conditions in 2005 throughout its simulation of historical periods, because the model could not account for transient changes in the extent of irrigation. In the future per-iod, atmospheric CO2 concentrations varied on the
basis of the RCP2.6 and RCP6.0 scenarios. In the NHL regions, future land-use change was predicted to be trivial; hence, for simplicity, we assumedfixed
land-use conditions after 2005(ISIMIP2b Experiments II and III described in Frieler et al2017). The extended
climate projections for the period 2100–2299 were considered by using the HadGEM2-ES, IPSL-CM5A-LR, and MIROC5 GCMs.
2.2. Biome models
Eight biome models participated in ISIMIP2b(table S1; Reyer et al2019): the ‘Carbon Assimilation in the
Biosphere’ model (CARAIB: Dury et al 2010), the
‘Community Land Model version 4.5’ (CLM4.5; Lawrence et al2011), the ‘Dynamic Land Ecosystem
Model’ (Tian et al 2011), the ‘Lund-Potsdam-Jena
model with managed Land’ (LPJmL; Bondeau et al
2007), the ‘Lund-Potsdam-Jena General Ecosystem
Simulator’ (LPJ-GUESS; Smith et al2014), the
‘Orga-nizing Carbon and Hydrology in Dynamic Ecosys-tems’ (ORCHIDEE-MICT; Guimberteau et al2018),
the ‘Vegetation Global Atmosphere Soil’ (VEGAS; Zeng et al 2005), and the ‘Vegetation Integrative
SImulator for Trace gases’ (VISIT; Ito and Ina-tomi 2012). Seven of the eight models (except for
CLM4.5) participated in phase 2a of ISIMIP, in which the models were benchmarked against a wide range of historical, observational data(e.g. Chang et al2017, Chen et al2017, Ito et al2017, García Cantú et al2018, Wartenburger et al2018). The eight models differ in
their conceptualization of ecosystem structure, para-meterization of functional processes, and environ-mental responsiveness, but as the phase 2a benchmarking revealed, they on average captured the present terrestrial carbon budget(figure S2; table S2).
Primarily because of run-time constraints, not all models were driven by all four GCMs. Nevertheless, a total 52 cases of biome model-climate model combi-nations(available as of September 2019) were used in this study. The use of IPSL-CM5A-LR climate projec-tions to force all biome impact models for both the RCP2.6 and RCP6.0 scenarios allowed us to conduct an inter-model comparison across the eight models for this GCM. The submission of output data fromfive biome models for four GCM projections allowed us to conduct an inter-climate comparison across the full range of GCMs. Sixteen cases of simulation results were available for the extended period.
2.3. Analyses
We selected three variables that represented ecosystem properties and were relevant to fundamental support-ing and regulatsupport-ing ecosystem services for the analyses (Millennium Ecosystem Assessment2005): annual net
primary production(NPP, kg C m–2yr–1), vegetation biomass (CVeg, kg C m–2), and soil carbon stock (CSoil, kg C m–2). We used area-weighted grid-cell
average values of these variables. NPP represents ecosystem functional activity and responds directly to environmental change. CVeg, a metric of vegetation height and density, represents vegetation 3
development; its response to cumulative environmen-tal change is based on the turnover of carbon in vegetation pools. CSoil is expected to represent the role of the soil and its effective depth, which are closely related to ecosystem properties (e.g. nutrient- and water-holding capacities). Changes in CVeg and CSoil are key indicators for assessing the carbon balance of the ecosystem. We used the benchmarking results of the ISIMIP2a biome models(e.g. Chang et al2017) to
focus on changes during the 21st century that could be simulated by the present models. The NHL grid points north of 60°N were extracted from the global simula-tion results for the following analyses.
To clarify the regional characteristics and to sepa-rate the effects of multiple factors in a simplified man-ner, we adopted a conventional factorial approach. First, we considered the change indexΦ (dimension-less) for NPP (ΦNPP), CVeg (ΦCVeg), and CSoil (ΦCSoil).
TheΦ index is defined as follows:
( ) /
F = DNHL Dglobal. 1 HereΔNHLis the regional mean change andΔglobalis
the global mean change. In both cases the changes are based on comparisons with the baseline present state (centered around the year ∼2000). The Φ index can be defined at an arbitrary period such as the year when global warming by 1.5°C occurs and indicates how severely the NHL region was influenced by climate change relative to the global average.
The characteristics of the changes in the NHL region may result from climatic and biological factors, which may interact in a complicated way. For simpli-city, we assumed thatΦ could be expressed as the pro-duct of climatic and biological terms as follows:
( ) F = F ´ F .T B 2 HereΦTis a temperature amplification factor, and ΦB
is the ecosystem response factor. The term ΦT is
defined as the ratio of temperature warming in the NHL(ΔTNHL) to the global (land and ocean)
temper-ature warming(ΔTglobal) above pre-industrial
tem-peratures. When ΦT>1, the implication is that
amplified warming occurred in the NHL. The term ΦB
is defined as the ratio of the change of ecosystem variables NPP (ΦB-NPP), CVeg (ΦB-CVeg) or CSoil
(ΦB-CSoil) in the NHL to the corresponding global
change. When ΦB>1, the implication is that the
temperature sensitivity is higher for the carbon variables in the NHL than for the corresponding global variable. By definition and from equation (2), the
biological term can be obtained as follows for the case of NPP: ( ) / FB NPP- = DNPPNHL DNPPglobal 3a ( ) / =FNPP FT. 3b
Note thatΔNPPNHL(% per °C), ΔNPPglobal(%
per°C), and the corresponding terms for CVeg and CSoil were compared during the same period of time to avoid artifacts associated with different levels of atmospheric CO2concentrations.
For further assessments, two ancillary analyses were conducted. First, we investigated long-term changes in the NHL ecosystem carbon budget during the extended projection period from 2100 to 2299. This analysis was expected to reveal the minimal response of northern ecosystems because climate warming was suppressed to the target level of the Paris Agreement. Second, to demonstrate an impacts on multiple sectors, we conducted an analysis that took into account permafrost change related with biome change. Thawing of permafrost is a focal problem associated with the NHL warming, because it affects the habitat of natural organisms and human society. Also, permafrost thawing is likely to enhance the decomposition of carbon released from frozen soils and thereby lead to emissions of greenhouse gases to the atmosphere(Schuur et al2015, Burke et al2018).
Considering the simulation results of the biome mod-els and future permafrost projection maps (Karjalai-nen et al2019), we preliminarily assessed the changes
in CVeg and CSoil in the areas where existing perma-frost might be destabilized in the future.
3. Results
The rate of temperature increase in the NHL by the end of the 21st century is projected to be much higher than the global mean, irrespective of climate model or scenario. The 31 year running mean of ΔTglobal
exceeded 1.5°C by ca. 2010 to ca. 2051, depending on the climate model, whereasΔTNHLexceeded 2.0°C by
the same time (figures 1(a) and (b)). As shown in
figures1(c) and (d), future temperature rise will occur
unevenly over Earth’s surface. Most land areas will undergo greater warming than the ocean at similar latitudes, and greater warming will occur at higher latitudes. Remarkably, ΔTglobal determined by the
GFDL-ESM2M under RCP2.6 did not exceed 1.5°C by the end of the 21st century. Given the close linear relationships between ΔTglobal and ΔTNHL
(figure 1(b)), we estimated ΦT during the period
1950–2099 to range between 1.81 and 2.31 (on average, 2.07) for all climate projections. Close inspec-tion revealed that the relainspec-tionship betweenΔTglobal
andΔTNHLwas approximately linear, but the slopes of
the relationship depended on the scenario; table 1
showsΦTvalues at 1.5 and 2.0°C warming levels.
The eight biome models simulated an increase if NPP under both the 1.5°C and the 2.0 °C warming scenarios(figures2(a) and (d)). The magnitude of the
change differed between the global and NHL; see figures S3 and S4 for results of individual cases. If ΔTglobal was projected equal 1.5°C, global NPP
increased by 5.3%–17.3% (on average, 10.7%) from mid-20th century levels, whereas the NPP of the NHL increased by 12.5%–38.2% (on average, 22.0%). The biome models consistently(i.e. with high probability) simulated the greatest increase of NPP for a large part
of NHL terrestrial ecosystems(figures S5(a), (b) and S6(a), (b)). As a result, ΦB-NPPfor all models equaled
1.32±0.56 for RCP2.6 and 1.38±0.43 for RCP6.0. The corresponding ΦNPP given by equation (2)
equaled 2.18±0.93 and 2.22±0.69, respectively (mean±standard deviation among the models; see tables1and S3 for median). The differences in simu-lated results between the two RCP scenarios were small. The relative changes of NPP in the NHL were, on average, more than double the global mean and were attributable to the interplay of climatic and
biological factors. The biological factor ΦB-NPP
became larger under theΔTglobal=2.0 °C scenario;
in that case ΦB-NPP values were 1.92±0.89 for
RCP2.6 and 1.66±0.91 for RCP6.0 (mean±-standard deviation of all models). These increases of ΦB-NPPindicated an accelerating sensitivity of NPP in
the NHL to global warming.
Similarly pronounced response patterns were also found in the simulated CVeg of the NHL(figures2(b),
(e)) when one outlier result by VEGAS was excluded. If ΔTglobal equaled 1.5°C, global CVeg increased by
Figure 1. Temperature changes in the climate projections used in ISIMIP2b.(a) Time series of global mean temperature change (ΔTglobal) relative to pre-industrial levels (mean of 1661–1690 temperatures). (b) Relationships between ΔTglobaland temperature
change in the NHL(ΔTNHL) relative to pre-industrial levels. Distribution of local temperature change in comparison with the global
mean temperature change for(c) 1.5 °C and (d) 2.0 °C, respectively, warming scenarios (mean of the four climate model projections with RCP6.0). Red areas have higher warming than the global mean, and blue areas have lower warming. Dashed lines in (c) and (d) indicate 60°N latitude.
Table 1. Amplification factors (definitions in equations (1) and (2)) of northern high-latitude lands above 60 °N for
indicated temperature changes and simulated ecosystem carbon budgets at 1°C, 1.5 °C, 2 °C, and 2.5 °C global mean temperature warming levels predicted by the IPSL-CM5A-LR global climate model. Medians and standard deviations(SD) among the sevenamodel results are shown.
1°C 1.5°C 2°C 2.5°C
Factorsb Median SD Median SD Median SD Median SD
ΦT RCP2.6 1.42 1.66 1.83 RCP6.0 1.47 1.62 1.67 1.85 ΦB-NPP RCP2.6 1.29 0.32 1.19 0.28 1.50 0.60 RCP6.0 1.28 0.27 1.24 0.26 1.30 0.41 1.39 0.42 ΦB-CVeg RCP2.6 1.54 0.45 1.36 0.18 1.40 0.27 RCP6.0 1.47 0.41 1.47 0.17 1.26 0.25 1.26 0.33 ΦB-CSoil RCP2.6 0.60 0.48 0.47 0.46 0.51 0.68 RCP6.0 0.59 0.46 0.50 0.46 0.56 0.55 0.78 0.93
aVEGAS results were not included because of anomalous behaviors(table S3 for the result including VEGAS). bΦ
T: temperature change amplification factor, and ΦB-NPP,ΦB-CVeg, andΦB-CSoil: biological factor for changes in NPP,
vegetation biomass(CVeg), and soil carbon (CSoil), respectively.
5
3.9%–15.2% (on average, 7.3%) from mid-20th cen-tury levels, whereas the CVeg of the NHL increased by 8.5%–30.4% (on average, 21.1%). The fact that the biological factor ΦB-CVeg did not change under the
ΔTglobal=2.0 °C scenario (table 1) indicated an
approximately linear relationship between the vegeta-tion carbon stock in the NHL and global warming. The response patterns were clearly different for CSoil. In that case the model simulations differed widely; they ranged from a large increase to a small decrease (figures 2(c), (f)). Regionally, there was little
con-sistency among the simulation cases in West Siberia to Europe and interior North America(figures S5(e), (f) and S6(e), (f)). As a result, the model-ensemble response was close to neutral at both the global and NHL scales (figure S3). This was also reflected by ΦB-CSoilwhich did not differ substantially from 1.0(i.e.
global mean response). The wide range of model-spe-cific ΦB-CSoilvalues(–0.25 to 2.89 among models and
scenarios) made it difficult to derive a robust outcome from the present simulations.
The difference in global NPP between the two degrees of warming(ΔNPP2.0–1.5) was 5.3±3.0% of
the pre-industrial NPP, whereas in the NHL, the corresponding model average difference was as large as 18.4±8.9% (average of four climate models under RCP2.6 and RCP6.0;figure2(d)). The corresponding
differences in NHL biomass(ΔCVeg2.0–1.5) and soil
carbon (ΔCSoil2.0–1.5) were 18.0±9.7% and
1.3±1.8%, respectively (figures2(e) and (f)). These
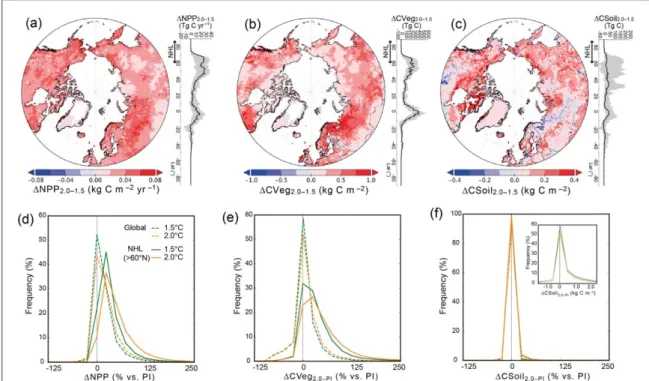
differences were distributed widely and hetero-geneously over the land areas(figures 3(a)–(c)). For
example, West Siberia, Northern Europe, and north-ern North America gained more productivity and plant biomass than other NHL regions under the 2.0°C warming scenario. The increases of NPP and CVeg were widely distributed, whereas negative effects such as degradation by warming occurred in only a few percent of NHL areas(figures3(d)–(f)).
The differences of the biological responses between seasons provided insights concerning the underlying mechanisms and implications for observa-tional detection of the responses. Figure4compares
Figure 2. Simulated changes in terrestrial ecosystem carbon budget at global and NHL scales. Time-series of(a) ΔNPP, (b) ΔCVeg, and(c) ΔCSoil by eight biome models driven by four climate-model projections under RCP2.6 and RCP6.0. Aggregated results of (d) ΔNPP, (e) ΔCVeg, and (f) ΔCSoil at warming levels of 1.0 °C, 1.5 °C, 2.0 °C, and 2.5 °C for the global (ΔTglobal) and NHL (ΔTNHL).
the simulated monthly NPPs during the pre-industrial era, and the 1980s, for the 1.5°C and 2.0 °C warming scenarios. The enhancement of NPP throughout the growing season caused the summer NPP in June– August to increase by about 30% because of enhanced photosynthetic capacity. WhenΔNPPNHLwas
calcu-lated based on comparisons with the 1980s(i.e. the beginning of Earth observations by satellite remote sensing), spring and autumn NPPs were also sensitive to climate variability because of the phenological response of vegetation. However, the absolute magni-tude of NPP was low in these early and late growing
seasons; therefore the annual change was determined mainly by the summer response.
Extended simulations to the end of the 22nd cen-tury (figure S7) highlighted long-term ecosystem responses. Along with stabilization of atmospheric CO2 concentration and global warming, the biome
models simulated gradual changes of biomass and less conclusive changes in soil carbon stocks. The range of variability among the biome models and climate pro-jections was comparable for CVeg but became larger for CSoil in both the global simulations (standard deviation among simulations, from 14.7% in 2100 to 19.9% in 2299) and NHL simulations (from 13.4% in
Figure 3. Distributions of the simulated terrestrial carbon budget variables,(a) NPP, (b) CVeg, and (c) CSoil. The differences between results at 1.5°C and 2.0 °C global warming levels are shown. The line graphs at the right of each map show global latitudinal distributions of the simulated variables.(d)–(f) Frequency distributions of the relative changes (in %) of (d) NPP, (e) CVeg, and (f) CSoil in the global and NHL results at the two global warming levels compared with pre-industrial(PI) conditions. Inset: changes in CSoil, but in units of kg C m–2.
Figure 4. Monthly net primary production(NPP) in the NHL areas simulated by ISIMIP2b models driven by four climate model projections under RCP2.6 and RCP6.0. Mean monthly NPP in the 1980s, whenΔTglobalreached 1.5°C (11 year mean), and when
ΔTglobalreaches 2.0°C (11 year mean).
7
2100 to 29.2% in 2299). Several models (LPJ-GUESS, LPJmL, and ORCHIDEE-MICT) showed a ‘peak-out’ of biomass caused by the overshoot of atmospheric CO2 concentrations. Also, several models showed
continuous(or time-lagged) increases of soil carbon stock, by as much as 10%(i.e. hundreds of Pg C) by the end of the 22nd century. Such gradual responses of terrestrial ecosystems to climate change are important for detecting potential long-term impacts and con-sidering ecosystem adaptation.
Further implications of the impacts simulated by the biome models were revealed by the changes in per-mafrost areas. Whereas only a tiny area was subject to permafrost destabilization under the RCP2.6 scenario, considerable destabilization was projected to occur over a vast area(2.7×10⁶km2), mainly in southern-most areas where permafrost is sporadic, during the late 21st century under the RCP4.5 and 8.5 scenarios (figure S8(a), red area). Interestingly, in these areas, the LPJml model, which included a permafrost scheme has simulated declines of CSoil by 2299, whereas other models, which did not represent dedicated permafrost processes, simulated gradual increase of soil carbon.
4. Discussion
The results of this study imply that pronounced changes in NHL ecosystems are likely to occur, because of a combination of the amplification of the temperature rise in the NHL and the higher than global-mean responsiveness of especially NPP and CVeg to increases of temperature and CO2. The
simulated increases of NPP and CVeg as well as the small changes of CSoil, in the NHL at around the near-contemporary warming level of 1.0°C (figure2) are
consistent with observed changes caused by the ongoing temperature rise. For example, such trends have been apparent as greening of the land detected by satellite remote sensing during the last decades(Zhu et al2016, but see Yuan et al2019for declining trends of productivity induced by dryness) and other scenario studies with global vegetation models(Scholze et al
2006, Sitch et al2008, Gonzalez et al2010, Warszawski et al 2013, IPCC 2014). The trend of increasing
amplitude of the seasonal cycle of atmospheric CO2
concentrations in the northern latitudes, which can be attributed largely to enhanced photosynthetic activity of NHL vegetation, is also consistent with the simu-lated enhancements of NPP and CVeg(Forkel et al
2016, Piao et al 2018). Moreover, the increase of
carbon stocks in northern ecosystems is consistent with the observed long-term trend of the atmospheric CO2inter-hemispheric gradient(Ciais et al2019). The
simulation results of this study imply that these observed terrestrial trends will continue to some extent at warming levels of 1.5°C and 2.0 °C.
There are ongoing arguments about whether the NHL and surrounding regions will act as a net carbon
sink or a source(e.g. Webb et al2016, Euskirchen et al
2017), because processes with conflicting effects are
exerting influences on ecosystems simultaneously. For example, winter CO2 emissions may be
under-estimated in current estimates and future projections of the NHL carbon budget(Natali et al2019). Several
long-term monitoring and experimental warming stu-dies have been conducted to estimate future changes in the localized areas of NHL(Bjorkman et al in press). However, the heterogeneous, somewhat inconsistent results of ecosystem responses to a certain magnitude of warming revealed by localfield experiments have made it difficult to extrapolate from past observations to the future. The simulated impacts of this study were sometimes inconsistent with typical experimental findings. For example, on the basis of estimates by 98 experts, Abbott et al(2016) have stated that total
bio-mass in the Arctic could decrease due to water stress and disturbances such as thermokarst, which are not usually included in the present ecosystem models. Crowther et al (2016) up-scaled the results of soil
warming experiments and concluded that warming by 1°C–2 °C will lead to serious carbon loss from NHL soils. In contrast, the fact that no clear decline of soil carbon has been consistently found in the future CSoil simulated by ISIMIP2b models suggests that a sub-stantial range of uncertainties remains in the carbon stocks simulation by present biome models(Friend et al2014, Tian et al2015). Vegetation biomass is
pro-jected to increase by 32.8±19.2 Pg C and by 63.4±38.9 Pg C under +1.5 °C and +2.0 °C warm-ing scenarios, respectively. These net carbon uptakes are equal to the amount of contemporary anthro-pogenic CO2presently emitted in 3–6 years
(Friedling-stein et al2019). Such a large carbon sequestration by
vegetation may imply a significant mitigation poten-tial that would help achieve the goals of the Paris Agreement.
Whether the ongoing climatic change will cause the NHL to reach a tipping point(e.g. boreal forest dieback and permafrost thawing) is a critical question in NHL areas, even under the low-end warming sce-nario. The increase of NPP and CVeg simulated in most cases implies:(1) that there is a high probability of enhancement of vegetation activity and a low possi-bility of extensive boreal forest dieback under both the 1.5°C and 2.0 °C warming scenarios (even under the 2.5°C warming scenario, figure2(e)), or (2) that none
the models used in this study have parameterizations that take into consideration non-linear effects such as shifts infire regimes, insect outbreaks, and dieback from drought. Indeed, there is recent evidence for an increasing influence and interaction of disturbances such as drought,fire and insect outbreaks due to cli-mate change(Seidl et al2017, Hartmann et al2018).
These disturbances could significantly influence the NHL, even if they do not formally cross a tipping point, but they were not covered in detail by the biome models used here. The passive responses of the
regional CSoil to the postulated temperature rises might imply a low possibility of extensive soil destabi-lization. However, we should note that the models used in the present study did not have an accurate scheme of permafrost dynamics to capture enhanced thawing under global warming. These tipping ele-ments might be triggered on a wide scale when high-end global warming levels are reached, and we should take account of their spatial heterogeneity to detect symptoms of regime shifts. Emergence of tipping ele-ments therefore depends on the responsiveness of impact models, and further model constraints are greatly needed to improve research confidence.
Limitations of the present study should be noted. First, the existing biome models are clearly too imma-ture to predict ecological consequences in detail, although the rather robust outcomes across multiple process-based model simulations presented here still have important general implications. Uncertainties in the simulated carbon stocks have been systematically analyzed previously (Nishina et al 2015, Tian et al
2015) and a large part of the CSoil uncertainty has
been attributed to the variability in biome model properties. Second, this study focused on long-term and broad-scale changes; therefore, it did not expli-citly consider the impacts of extreme events and a changing disturbance regime. Extreme weather condi-tions and associated disturbances (e.g. droughts accompanied with severe wildfires) would have pro-found impacts on the ecosystem carbon cycle (Reich-stein et al2013).
Nevertheless, the in-depth analyses of climatic impacts across different sectors that are achievable by ISIMIP2b gives us many advantages that were demon-strated in this study. Notably, theΦTvalues obtained
in this study imply that limiting the global temper-ature rise to 1.5°C rather than 2.0 °C should be more effective in the NHL regions than the global mean: i.e. the 0.5°C reduction of global mean temperature would limit regional warming by 0.7°C–0.9 °C. On the one hand, the difference of the climatic impacts on NPP and CVeg between under the 1.5°C and 2.0 °C scenarios indicated that mitigation efforts could sup-press the impacts of an additional 0.5°C warming. This possibility is most apparent in the NHL regions. On the other hand, the impacts on CSoil simulated by certain models were insensitive to the degree of warm-ing. In terms of climate policy, the ISIMIP will help us to identify effective mitigation and adaptation options in a more informed manner.
Acknowledgments
The Inter-Sectoral Impact Model Intercomparison Project (ISIMIP) is funded through the German Federal Ministry of Education and Research(BMBF, Grant No. 01LS1711A). AI was supported by the Climate Change Adaptation Research Program of
National Institute for Environmental Studies, Japan. WT acknowledges support from the Uniscientia Foundation and the ETH Zurich Foundation(Fel-45 15-1). MC acknowledges support from the NASA Terrestrial Ecology program under project NNH18ZDA001N (award number 80HQTR19T0055). HT and HS acknowledge support from US National Science Foundation(Award num-ber 1903722). CPOR acknowledges funding from the German Federal Ministry of Education and Research (BMBF, Grant No. 01LS1711A).
Author contributions
AI designed the study, conducted analyses, and drafted the manuscript. CPOR and PC led the ISIMIP2b biome sector coordination. JC, MF, SO, and WT conducted simulations. CPOR, PC, MC, MF, TH, and WT commented on the manuscript. AG also com-mented on the manuscript from the perspective of the permafrost sector.
Data availability statement
The data that support thefindings of this study are openly available at10.5880/PIK.2019.012.
ORCID iDs
Akihiko Ito
https://orcid.org/0000-0001-5265-0791
Philippe Ciais
https://orcid.org/0000-0001-8560-4943
Min Chen https://orcid.org/0000-0001-6311-7124
Matthew Forrest https: //orcid.org/0000-0003-1858-3489
Sebastian Ostberg
https://orcid.org/0000-0002-2368-7015
References
Abbott B W et al 2016 Biomass offsets little or none of permafrost carbon release from soils, streams, and wildfire: an expert assessment Environ. Res. Lett.11 034014
Arora V K et al 2013 Carbon-concentration and carbon-climate feedbacks in CMIP5 earth system models J. Clim.26 5289–314
Bjorkman A D et al Status and trends in Arctic vegetation: evidence from experimental warming and long-term monitoring Ambio49 678–92
Bondeau A et al 2007 Modelling the role of agriculture for the 20th century global terrestrial carbon balance Glob. Change Biol.
13 679–706
Burke E J et al 2018 CO2loss by permafrost thawing implies
additional emissions reductions to limit warming to 1.5 or 2 °C Environ. Res. Lett.13 024024
Chang J et al 2017 Benchmarking carbonfluxes of the ISIMIP2a biome models Environ. Res. Lett.12 045002
Chen M et al 2017 Regional contribution to variability and trends of global gross primary productivity Environ. Res. Lett.12 105005
9
Ciais P et al 2019 Five decades of northern land carbon uptake revealed by the interhemispheric CO2gradient Nature568
221–5
Crowther T W et al 2016 Quantifying global soil carbon losses in response to warming Nature540 104–8
Dury M et al 2010 Responses of European forest ecosystems to 21st century climate changes in interannual variability andfire intensity iForest—Biogeosci. Forestry4 82–99
Euskirchen E S et al 2017 Long-term release of carbon dioxide from arctic tundra ecosystems in Alaska Ecosystems20 960–74
Forkel M et al 2016 Enhanced seasonal CO2exchange caused by
amplified plant productivity in northern ecosystems Science
351 696–9
Fricko O et al 2017 The marker quantification of the shared socioeconomic pathway 2: a middle-of-the-road scenario for the 21st century Glob. Environ. Change42 251–67
Friedlingstein P et al 2019 Global carbon budget 2019 Earth Syst. Sci. Data11 1783–838
Frieler K et al 2017 Assessing the impacts of 1.5°C global warming— simulation protocol of the inter-sectoral impact model intercomparison project(ISIMIP2b) Geosci. Model Dev.10 4321–45
Friend A D et al 2014 Carbon residence time dominates uncertainty in terrestrial vegetation responses to future climate and atmospheric CO2Proc. Natl Acad. Sci. USA111 3280–5
García Cantú A et al 2018 Evaluating changes of biomass in global vegetation models: the role of turnoverfluctuations and ENSO events Environ. Res. Lett.13 075002
Goetz S J et al 2005 Satellite-observed photosynthetic trends across boreal North America associated with climate andfire disturbance Proc. Natl Acad. Sci. USA102 13521–5
Gonzalez P et al 2010 Global patterns in the vulnerability of ecosystems to vegetation shifts due to climate change Glob. Ecol. Biogeogr.19 755–68
Graven H D et al 2013 Enhanced seasonal exchange of CO2by
northern ecosystems since 1960 Science341 1085–9
Guimberteau M et al 2018 ORCHIDEE-MICT(v8.4.1), a land surface model for the high latitudes: model description and validation Geosci. Model Dev.11 121–63
Hartmann H et al 2018 Research frontiers for improving our understanding of drought-induced tree and forest mortality New Phytol.218 15–28
Hickler T et al 2012 Projecting the future distribution of European potential natural vegetation zones with a generalized, tree species-based dynamic vegetation model Glob. Ecol. Biogeogr.
21 50–63
Hugelius G et al 2014 Estimated stocks of circumpolar permafrost carbon with quantified uncertainty ranges and identified data gaps Biogeoscience11 6573–93
Intergovernmental Panel on Climate Change(IPCC) 2013 Climate Change 2013: The Physical Science Basis(Cambridge: Cambridge University Press)
IPCC 2014 Climate Change 2014: Impacts, Adaptation, and Vulnerability(Cambridge: Cambridge University Press) IPCC 2018 Global Warming of 1.5°C. An IPCC Special Report on the
Impacts of Global Warming of 1.5°C above Pre-industrial Levels and Related global Greenhouse Gas Emission Pathways, in the Context of Strengthening the Global Response to the Threat of Climate Change, Sustainable Development, and Efforts to Eradicate Poverty(Cambridge: Cambridge University Press) IPCC 2019 Special Report on Climate Change, Desertification, Land Degradation, Sustainable Land Management, Food Security, and Greenhouse Gas Fluxes in Terrestrial Ecosystems (Cambridge: Cambridge University Press)
Ito A and Inatomi M 2012 Water-use efficiency of the terrestrial biosphere: a model analysis on interactions between the global carbon and water cycles J. Hydrometeorol.13 681–94
Ito A, Nishina K and Noda H M 2016 Impacts of future climate change on the carbon budget of northern high-latitude terrestrial ecosystems: an analysis using ISI-MIP data Polar Sci.10 346–55
Ito A et al 2017 Photosynthetic productivity and its efficiencies in ISIMIP2a biome models: benchmarking for impact assessment studies Environ. Res. Lett.12 085001
Jahn A 2018 Reduced probability of ice-free summers for 1.5°C compared to 2°C warming Nat. Clim. Change8 409–13
Karjalainen O et al 2019 Circumpolar permafrost maps and geohazard indices for near-future infrastructure risk assessment Sci. Data6 190037
Lange S 2018 Bias correction of surface downwelling longwave and shortwave radiation for the EWEMBI dataset Earth Syst. Dyn.
9 627–45
Lawrence D M et al 2011 Parameterization improvements and functional and structural advances in version 4 of the community land model J. Adv. Model Earth Syst.3 M03001
Lenton T M et al 2008 Tipping elements in the Earth’s climate system Proc. Natl Acad. Sci. USA105 1786–93
Malinauskaite L, Cook D, Davíðsdóttir B and Ögmundardóttir H 2019 Ecosystem services in the Arctic: a thematic review Ecosyst. Serv.36 100898
McGuire A D et al 2009 Sensitivity of the carbon cycle in the Arctic to climate change Ecol. Monogr.79 523–55
McGuire A D et al 2018 Dependence of the evolution of carbon dynamics in the northern permafrost region on the trajectory of climate change Proc. Natl. Acad. Sci. USA115 3882–7
Millennium Ecosystem Assessment 2005 Ecosystems and Human Well-being: Synthesis(Washington, DC: Island Press) Myneni R B et al 1997 Increased plant growth in the northern high
latitudes from 1981 to 1991 Nature386 698–702
Natali S M et al 2019 Large loss of CO2in winter observed across the
northern permafrost region Nat. Clim. Change9 852–7
Neilson R P et al 2005 Forecasting regional to global plant migration in response to climate change BioScience55 749–59
Nishina K et al 2015 Decomposing uncertainties in the future terrestrial carbon budget associated with emission scenario, climate projection, and ecosystem simulation using the ISI-MIP result Earth Syst. Dyn.6 435–45
Piao S et al 2018 On the causes of trends in the seasonal amplitude of atmospheric CO2Glob. Change Biol.24 608–16
Piao S et al 2020 Characteristics, drivers and feedbacks of global greening Nat. Rev. Earth Environ.1 14–27
Post E et al 2019 The polar regions in a 2°C warmer world Sci. Adv.5 eaaw9883
Reichstein M et al 2013 Climate extremes and the carbon cycle Nature500 287–95
Reyer C P O et al 2019 ISIMIP2b Simulation Data from Biomes Sector. GFZ Data Services((http://doi.org/10.5880/PIK. 2019.012))
Richardson A D et al 2018 Ecosystem warming extends vegetation activity but heightens vulnerability to cold temperatures Nature560 368–71
Schaphoff S, Reyer C P O, Schepaschenko D, Gerten D and Shvidenko A 2016 Tamm review: observed and projected climate change impacts on Russia’s forests and its carbon balance For. Ecol. Manage.361 432–44
Schleussner C-F et al 2018 Crop productivity changes in 1.5°C and 2°C worlds under climate sensitivity uncertainty Environ. Res. Lett.13 064007
Scholze M, Knorr W, Arnell N W and Prentice I C 2006 A climate-change risk analysis for world ecosystems Proc. Natl Acad. Sci. USA103 13116–20
Schuur E A G et al 2015 Climate change and the permafrost carbon feedback Nature520 171–9
Seidl R et al 2017 Forest disturbances under climate change Nat. Clim. Change7 395–402
Sitch S et al 2008 Evaluation of the terrestrial carbon cycle, future plant geography and climate-carbon cycle feedbacks using five dynamic global vegetation models (DGVMs) Glob. Change Biol.14 2015–39
Smith B et al 2014 Implications of incorporating N cycling and N limitations on primary production in an individual-based dynamic vegetation model Biogeoscience11 2027–54
Tian H et al 2011 Net exchanges of CO2, CH4, and N2O between
contributions to global climate warming J. Geophys. Res.116 G02011
Tian H et al 2015 Global patterns and controls of soil organic carbon dynamics as simulated by multiple terrestrial biosphere models: current status and future directions Glob. Biogeochem. Cycles29 775–92
van Vuuren D P et al 2011 The representation concentration pathways: an overview Clim. Change109 5–31
Warszawski L et al 2013 A multi-model analysis of risk of ecosystem shift under climate change Environ. Res. Lett.8 044018
Wartenburger R et al 2018 Evapotranspiration simulations in ISIMIP2a—evaluation of spatio-temporal characteristics
with a comprehensive ensemble of independent dataset Environ. Res. Lett.13 075001
Webb E E et al 2016 Increased wintertime CO2loss as a result of
sustained tundra warming J. Geophys. Res. Biogeosci.121 249–65
Yuan W et al 2019 Increased atmospheric vapor pressure deficit reduced global vegetation growth Sci. Adv.5 eaax1396
Zeng N et al 2005 Terrestrial mechanisms of interannual CO2
variability Glob. Biogeochem. Cycles19 GB1016
Zhu Z et al 2016 Greening of the Earth and its drivers Nat. Clim. Change6 791–5
11