HAL Id: hal-00369558
https://hal.archives-ouvertes.fr/hal-00369558
Submitted on 20 Mar 2009
HAL is a multi-disciplinary open access archive for the deposit and dissemination of sci-entific research documents, whether they are pub-lished or not. The documents may come from teaching and research institutions in France or abroad, or from public or private research centers.
L’archive ouverte pluridisciplinaire HAL, est destinée au dépôt et à la diffusion de documents scientifiques de niveau recherche, publiés ou non, émanant des établissements d’enseignement et de recherche français ou étrangers, des laboratoires publics ou privés.
Classification of NPY-expressing neocortical
interneurons.
Anastassios Karagiannis, Thierry Gallopin, Csaba Dávid, Demian Battaglia,
Hélène Geoffroy, Jean Rossier, Elizabeth M C Hillman, Jochen F Staiger,
Bruno Cauli
To cite this version:
Anastassios Karagiannis, Thierry Gallopin, Csaba Dávid, Demian Battaglia, Hélène Geoffroy, et al.. Classification of NPY-expressing neocortical interneurons.. Journal of Neuroscience, Society for Neu-roscience, 2009, 29 (11), pp.3642-59. �10.1523/JNEUROSCI.0058-09.2009�. �hal-00369558�
The Journal of Neuroscience
http://jneurosci.msubmit.net
Classification of NPY-expressing neocortical interneurons
Anastassios Karagiannis*1,2, Thierry Gallopin*1,Csaba Dávid*3, Demian Battaglia*4,5, Hélène Geoffroy1, Jean Rossier1, Elizabeth MC Hillman6
, Jochen F Staiger3 and Bruno Cauli1,2.
1- Laboratoire de Neurobiologie et Diversité Cellulaire, CNRS UMR 7637, Ecole Supérieure de Physique et de Chimie Industrielles, 10 rue Vauquelin, 75005 Paris, France
2- Laboratoire de Neurobiologie des processus adaptatifs, Université Pierre et Marie Curie, CNRS UMR7102, 9 Quai St Bernard, 75005 Paris, France.
3- Albert-Ludwigs-University Freiburg, Institute of Anatomy and Cell Biology, Department of Neuroanatomy, D-79001 Freiburg, Germany.
4- Laboratoire de Neurophysique et Physiologie, Université Paris Descartes, CNRS UMR 8119, 45 rue des Saints Pères 75270 Paris Cedex 06, France
5- Bernstein Center for Computational Neuroscience, D-37073 Göttingen, Germany
6- Department of Biomedical Engineering, Columbia University, 351L Engineering Terrace, 1210 Amsterdam Avenue, New York, NY 10027, USA
* A.K., T.G., C.D. and D.B. contributed equally to this work. Running title: NPY interneurons
Corresponding author: Bruno Cauli, NPA CNRS UMR 7102, UPMC, 9 Quai St. Bernard 75005 Paris, France.
Telephone: (33 1) 44 27 33 89 Facsimile: (33 1) 44 27 25 84. E-mail: [email protected] Figures: 8 - Table: 8
Text: 57 pages - Abstract: 216 words - Introduction: 465 words - Discussion: 1346 words. Keywords: Petilla terminology, neurogliaform, Martinotti, nitric oxide synthase, unsupervised clustering, polythetic classification
Acknowledgements
This work was supported by Human Frontier Science Program grant RGY0070/2007-C (E.M.RGY0070/2007-C.H. and B.RGY0070/2007-C.), by National institutes of health, NINDS grants R21NS053684 and R01NS063226 (E.M.C.H.), by DFG grants Sta 431/5-4 and Sta 431/8-1 (J.F.S.) and by ANR grants "LARSEN" (D.B.) and "Neurovasc" (J.R.). The authors wish to thank Antonin Blot, Nicolas Brunel, David Hansel and Bertrand Lambolez for their valuable help.
Abstract
Neuropeptide Y (NPY) is an abundant neuropeptide of the neocortex involved in numerous physiological and pathological processes. Due to the large electrophysiological, molecular and morphological diversity of NPY-expressing neurons their precise identity remains unclear. To define distinct populations of NPY neurons we characterized, in acute slices of rat barrel cortex, 200 cortical neurons of layers I-IV by means of whole-cell patch-clamp recordings, biocytin labeling and single cell Reversed Transcriptase-Polymerase Chain Reaction (scRT-PCR) designed to probe for the expression of well established molecular markers for cortical neurons. To classify reliably cortical NPY neurons we used and compared different unsupervised clustering algorithms based on laminar location, electrophysiological and molecular properties. These classification schemes confirmed that NPY neurons are nearly exclusively γ-aminobutyric acid (GABA)-ergic and consistently disclosed three main types of NPY-expressing interneurons. (1) Neurogliaform-like neurons exhibiting a dense axonal arbor, were the most frequent, superficial, and substantially expressed the neuronal isoform of nitric oxide synthase (NOS-I). (2) Martinotti-like cells characterized by an ascending axon ramifying in layer I co-expressed somatostatin (SOM) and were the most excitable type. (3) Among fast spiking (FS) and parvalbumin (PV) positive basket cells, NPY expression was correlated with pronounced spike latency. By clarifying the diversity of cortical NPY neurons, this study establishes a basis for future investigations aiming at elucidating their physiological roles.
Introduction
The 36 amino acids NPY is one of the most abundantly and widely distributed neuropeptides of the central nervous system (Allen et al., 1983). In the cerebral cortex it is involved in distinct physiological processes such as synaptic transmission (Bacci et al., 2002) or cerebral blood flow regulation (Dacey, Jr. et al., 1988) as well as numerous pathological conditions like epilepsy (Baraban et al., 1997), migraine (Choudhuri et al., 2002), anxiety (Bannon et al., 2000) or withdrawal behavior (Clausen et al., 2001).
NPY-expressing neurons are widely distributed throughout the depth of the cortex but are more frequent in layers II-III and VI (Hendry et al., 1984b;Kubota et al., 1994;Kuljis and Rakic, 1989a) in which they form two dense plexuses targeting neuronal (Abounader and Hamel, 1997;Aoki and Pickel, 1989;Hendry et al., 1984b;Kuljis and Rakic, 1989a) as well as astrocytic and vascular elements (Abounader and Hamel, 1997;Bao et al., 1997;Cauli et al., 2004;Estrada and DeFelipe, 1998). NPY neurons are mainly GABAergic (Aoki and Pickel, 1989;Demeulemeester et al., 1988;Hendry et al., 1984a;Kubota et al., 1994). They are morphologically very diverse, being either bipolar, bitufted or multipolar at the somatodendritic level (Abounader and Hamel, 1997;Hendry et al., 1984b;Kuljis and Rakic, 1989b). In addition, a molecular diversity, reflected by the co-expression of NPY with NOS-1, neuropeptides and/or calcium binding proteins defines neurochemical subclasses of NPY neurons (Gonchar et al., 2007;Hendry et al., 1984b;Kubota et al., 1994). Furthermore these neurons are also physiologically heterogeneous since they exhibit either adapting, FS or accelerating firing patterns (Cauli et al., 1997;Cauli et al., 2000;Cauli et al., 2004;Férézou et al., 2006;Gallopin et al., 2006;Toledo-Rodriguez et al., 2005;Wang et al., 2002;Wang et al., 2004).
Together, the pleiotropic actions, widespread distribution and large morphological, molecular and physiological diversity suggest that NPY neurons are composed of several functionally diverse neuronal subpopulations which so far have remained poorly defined.
Today's neuroscientists agree that neuronal type definition cannot be considered complete until multimodal information regarding physiological, molecular and morphological features are considered (Ascoli et al., 2008). This goal was pursued here for cortical NPY neurons of superficial layers by combining whole cell current-clamp recordings, scRT-PCR and biocytin labeling in acute slices of rat somatosensory cortex. The scRT-PCR protocol was designed to probe simultaneously for the expression of well established neurochemical markers of cortical neurons (Bayraktar et al., 1997;Celio, 1986;Celio, 1990;Demeulemeester et al., 1991;Estrada and DeFelipe, 1998;Gonchar and Burkhalter, 1997;Hendry et al., 1984b;Jacobowitz and Winsky, 1991;Kubota et al., 1994;Morrison et al., 1984;Rogers, 1992;Somogyi et al., 1984). To define distinct subtypes of NPY neurons we used and compared different unsupervised clustering algorithms taking simultaneously into account the numerous features determined for each neuron. This approach allowed the identification of three different main types of NPY neurons with distinctive morphological, molecular and physiological properties, thus providing a reliable polythetic classification scheme (Tyner, 1975).
Materials and Methods
Slice preparationAll experiments were carried out in accordance with the guidelines published in the European Communities Council Directive of 24 November 1986 (86/609/EEC). Juvenile male Wistar rats (postnatal days 19 ± 2, Charles River, L’Arbresle, France) were deeply anesthetized with halothane and decapitated. The brains were quickly removed and placed into cold (~4°C) oxygenated artificial cerebrospinal fluid (aCSF) (in mM): 126 NaCl, 2.5 KCl, 1.25 NaH2PO4, 2 CaCl2, 1 MgCl2, 26 NaHCO3, 10
glucose, 15 sucrose, and 1 kynurenic acid (nonspecific glutamate receptor antagonist, Sigma, St Louis, Missouri). Coronal slices (300 µm thick) from rat somatosensory cortex containing the barrel cortex were prepared as described previously (Schubert et al., 2001). Slices were cut with a vibratome (VT1000S; Leica, Nussloch, Germany), transferred to a holding chamber containing aCSF saturated with O2/CO2 (95%/5%) and held at room temperature.
Whole-cell recordings
Individual slices were transferred to a submerged recording chamber and perfused (1–2 ml/min) with oxygenated aCSF. Patch pipettes (2.5-8 MΩ) pulled from borosilicate glass were filled with 8 µl of autoclaved RT-PCR internal solution (in mM): 144 K-gluconate; 3 MgCl2; 0.5 EGTA; 10 HEPES, pH 7.2 (285/295 mOsm), and
3 mg/ml biocytin (Sigma, St. Louis, MO) for intracellular labeling. Neurons were visualized in the slice using infrared videomicroscopy (Stuart et al., 1993) with Dodt gradient contrast optics (Luigs and Neumann, Ratingen, Germany, (Dodt and Zieglgansberger, 1998)). Whole-cell recordings in current-clamp mode were
performed at room temperature (24.5 ± 1.5 °C) using a patch-clamp amplifier (Axopatch 200A, Molecular Devices, Foster City, CA). Data were filtered at 5 kHz and digitized at 50 kHz using an acquisition board (Digidata 1322A, Molecular Devices) attached to a personal computer running pCLAMP 9.2 software package (Molecular Devices). Electrophysiological properties were recorded using the I-clamp fast mode of the amplifier. All membrane potentials were corrected for liquid junction potential (-11 mV).
Cytoplasm harvest and Single-Cell Reverse Transcription-Polymerase Chain reaction
At the end of the recording, the cytoplasmic content of the cell was aspirated in the recording pipette and expelled into a test tube, and reverse transcription (RT) was performed in a final volume of 10 µl as previously described (Lambolez et al., 1992). After cytoplasm collection the patch pipette was gently withdrawn to allow the closure of the cell membrane (Cauli et al., 1997). Slices were then fixed by overnight immersion in 4% paraformaldehyde in phosphate buffer (PB 0.1 M, pH 7.4) for subsequent biocytin staining (see below).
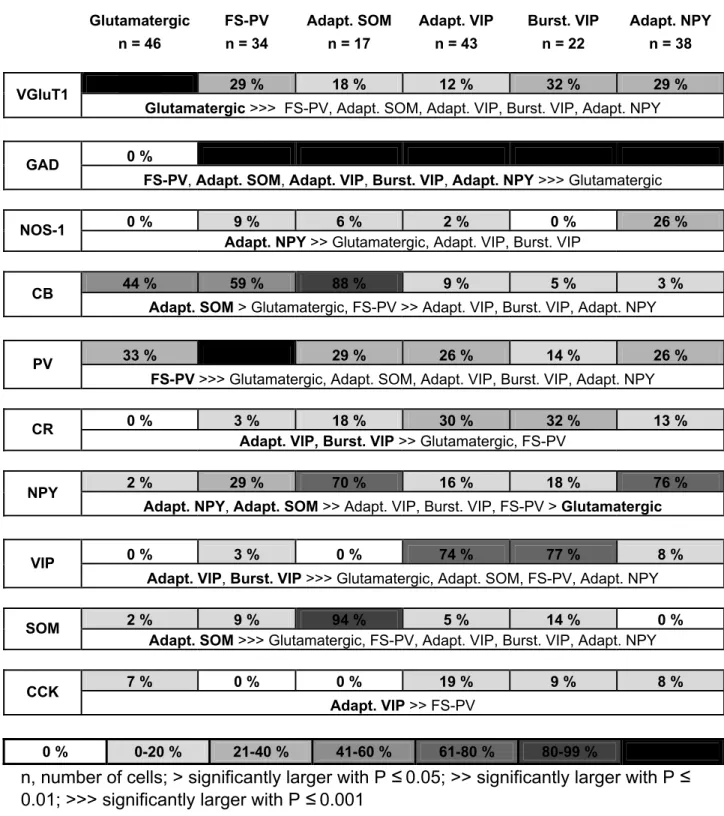
The scRT-PCR protocol was designed to detect simultaneously the expression of the vesicular glutamate transporter 1 (vGlut1), the two isoforms of glutamic acid decarboxylase (GAD65 and GAD67), the neuronal isoform of nitric oxide synthase (NOS-1), three calcium binding proteins: calbindin D28k (CB), calretinin (CR), PV, and four neuropeptides: NPY, SOM, vasoactive intestinal polypeptide (VIP) and cholecystokinin (CCK). Two amplification steps were performed essentially as described (Cauli et al., 1997). Briefly, the cDNAs present in 10 µl of the RT reaction were first amplified simultaneously by using the primer pairs listed in Table 1 (for
each pair the sense and antisense primers were intron-overspanning). Taq polymerase (2.5 U; Qiagen, Hilden, Germany) and 20 pmol of each primer were added to the buffer supplied by the manufacturer (final volume, 100 µl), and 21 cycles (94°C for 30 sec, 60°C for 30 sec, and 72°C for 35 sec) of PCR were run. Second rounds of amplification were performed using 1 µl of the first PCR product as template. In this second round, each cDNA was amplified individually with a second set of a primer pair internal to the pair used in the first PCR (nested primers, see Table 1). Thirty-five PCR cycles were performed as described earlier (Cauli et al., 1997). Then 10 µl of each individual PCR product was run on a 2% agarose gel using φX174 digested by HaeIII as molecular weight maker and stained with ethidium bromide. All the transcripts were detected from 500 pg of neocortical RNA using this protocol (data not shown). The sizes of the PCR-generated fragments were as predicted by the mRNA sequences (see Table 1).
Electrophysiological analysis
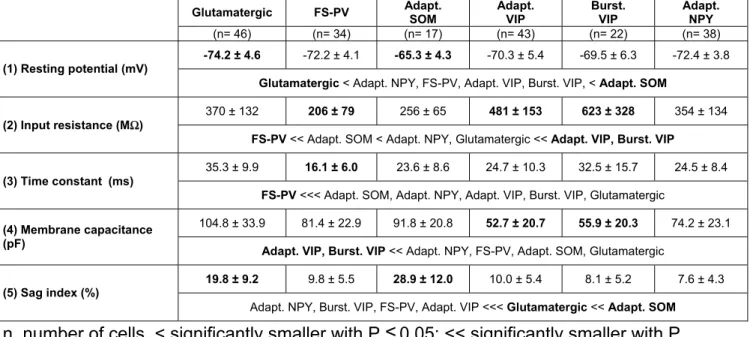
In order to describe different electrophysiological behaviors observed in cortical neurons 32 electrophysiological parameters adopting Petilla terminology (Ascoli et al., 2008) were determined for each cell. (1) Resting membrane potential was measured just after passing in whole-cell configuration, and only cells with a resting membrane potential more negative than -61 mV were analyzed further. (2) Input resistance (Rm) and (3) membrane time constant (τm) were determined on responses
to hyperpolarizing current pulses (duration, 800 ms) eliciting voltage shifts of 10-15 mV negative to rest (Kawaguchi, 1993;Kawaguchi, 1995). Time constant was determined by fitting this voltage response to a single exponential. (4) Membrane capacitance (Cm) was calculated according to Cm = τm / Rm. In some neurons,
injection of hyperpolarizing current pulses induced pronounced “sag”, indicative of a hyperpolarization-activated cationic current (Ih), that followed the initial
hyperpolarization peak. Thus, whole-cell conductance was measured when the sag conductance was inactive (Ghyp) or active (Gsag). Gsag was measured as the slope of
the linear portion of a current–voltage (I–V) plot, where V was determined at the end of 800 ms hyperpolarizing current pulses (-100 to 0 pA) and Ghyp as the slope of the
linear portion of an I–V plot, where V was determined as the maximal negative potential during the 800 ms hyperpolarizing pulses. (5) Sag index was quantified as a relative decrease in membrane conductance according to (Gsag-Ghyp)/Gsag. (Halabisky
et al., 2006). (6) Rheobase, a measure of electrical excitability, was quantified as the minimal depolarizing current pulse intensity (800 ms duration, 10 pA increments) generating at least one action potential. A pronounced (7) first spike latency or delayed firing (Ascoli et al., 2008;Gupta et al., 2000), previously referred as "late spiking" (Kawaguchi, 1995;Tamas et al., 2003), has been reported to be a distinctive feature of neurons of the morphological neurogliaform class. This property was measured at rheobase as the time needed to elicit the first action potential. Firing behavior near threshold is also very informative about the electrophysiological diversity of cortical neurons. For instance, when depolarized just above threshold neurons can exhibit: "continuous firing" (Ascoli et al., 2008;Kawaguchi, 1995;McCormick et al., 1985) that corresponds to "type 1 neurons" (Hodgkin, 1948) defined by a low minimal frequency increasing with stimulus intensity, "burst firing" (Cauli et al., 1997;Kawaguchi and Kubota, 1996;McCormick et al., 1985;Porter et al., 1998) defined by their inability to fire below a minimal frequency at the onset of firing (type 2 neurons) or an "accelerating firing" (Simon et al., 2005). To describe these different behaviors, spike frequency was determined near spike threshold on the first
trace in which at least three spikes were triggered. Under these conditions, instantaneous discharge frequencies were measured and fitted to a straight line according to Fthreshold = mthreshold.t + Fmin., where mthreshold is the slope termed (8)
adaptation, t the time and Fmin, the (9) minimal steady state frequency. This
parametric description of the firing pattern allows to differentiate the three different firing classes described above: bursting neurons are characterized by a high Fmin and
a pronounced adaptation, accelerating neuron exhibit a negative adaptation, and a
low Fmin, whereas continuous firing neurons exhibit intermediateFmin and adaptation.
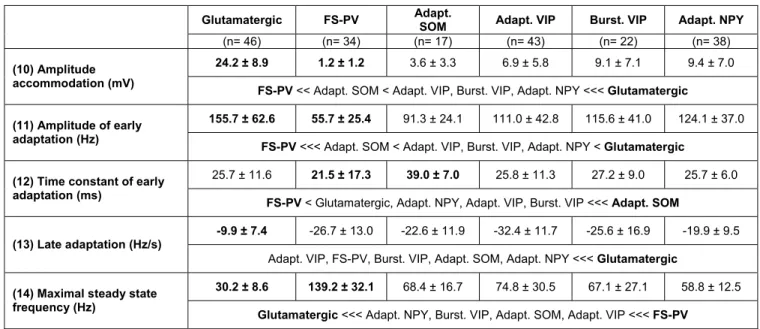
(10). A complex spike amplitude accommodation during a train of action potentials, consisting in a transient decrease of spikes amplitude, preeminent in some cortical neurons was measured as the difference between the peak of the smallest action potential and the peak of the following biggest action potential (Cauli et al., 2000). At the highest stimulation intensities, a high firing rate is characteristic of FS class neurons (Cauli et al., 1997;Kawaguchi, 1993;McCormick et al., 1985). Maximal firing rate was defined as the last trace before prominent reduction of action potentials amplitude indicative of a saturated discharge. To take into account the biphasic spike frequency adaptation (early and late) occurring at high firing rates (Cauli et al., 1997;Cauli et al., 2000;Gallopin et al., 2006), instantaneous firing frequency was fitted to a single exponential (Halabisky et al., 2006) with a sloping baseline,
according to -t/ sat max
sat.e .m F A
.= sat +t +
FSaturation τ . Where Asat corresponds to the (11)
amplitude of early frequency adaptation, τsat to (12) time constant of early adaptation,
msat to the (13) slope of late adaptation and Fmax to the (14) maximal steady state
frequency. Under these conditions, FS class neurons are typically characterized by a high steady state frequency with little or no frequency adaptation (Cauli et al., 1997;Cauli et al., 2000). Analysis of the action potentials waveforms was done on the
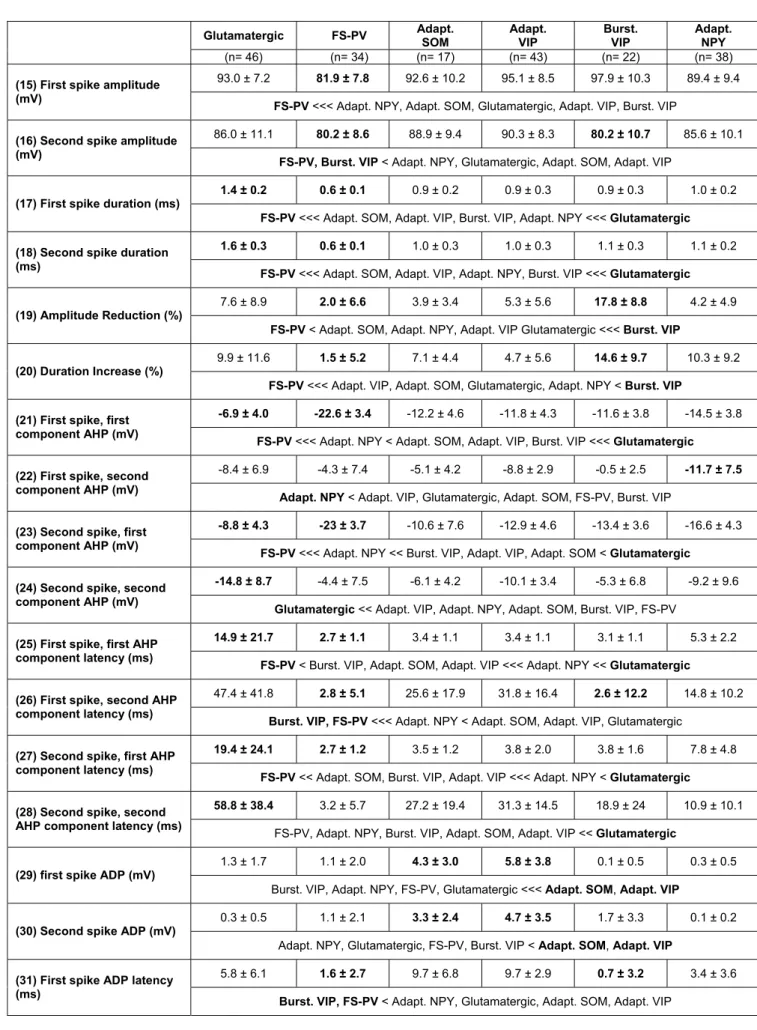
first two spikes. Their (15, 16) amplitude (A1 and A2) was measured from threshold to the positive peak of the spike. Their (17, 18) duration (D1 and D2) was measured at half amplitude (Cauli et al., 1997;Kawaguchi, 1993), short duration of action potentials being also a characteristic feature of FS class neurons (Kawaguchi, 1993;Kawaguchi and Kubota, 1993;McCormick et al., 1985). Their (19) amplitude reduction and the (20) duration increase were calculated according to (A1-A2)/A1 and (D2-D1)/D1 respectively (Cauli et al., 1997;Cauli et al., 2000). In some cortical neurons a complex waveform of afterpotential has been reported in some cortical neurons (Beierlein et al., 2003;Povysheva et al., 2007). Therefore the amplitude (21-24) and the latency (25-28) of the first and second components of afterhyperpolarization (AHPf and AHPs) was measured for the first two action potentials as the difference between spike threshold and the negative peak of the AHP (Kawaguchi, 1993). In some cortical neurons (Haj-Dahmane and Andrade, 1997) this complex repolarization is accompanied by a fast afterdepolarization (ADP). Its (29, 30) amplitude and (31, 32) latency were measured as the difference between the negative peak of the AHPf and the positive peak of the ADP and between the spike threshold and the peak of the ADP, respectively. When neurons did not exhibit AHPs or ADP, amplitude and latency were arbitrarily set to 0.
Visualization and imaging of the intracellular biocytin-filled neurons
The slices were basically processed as described previously (Staiger et al., 2002). In brief, the 300 µm thick slices were cut to 100 µm thick sections on a vibratome (Microm HM650 V, Walldorf, Germany), on the one hand to facilitate the penetration of the reagents and on the other hand to create sections that can be scanned with confocal microscopy throughout the whole thickness.
For the fluorescent staining the sections were washed in 0.05 M Tris-buffered saline (TBS, pH 7.4) containing 0.3% Triton to permeabilize the tissue by removing membrane lipids. The sections were incubated with Alexa-488 coupled streptavidin (Molecular Probes, Leiden, The Netherlands) for 6 hours.
For brightfield staining the sections were washed several times with PB and incubated with cryoprotectant (25% saccharose, 10% glycerol in 0.01 M PB) until the sections sank. The sections were frozen three times over liquid nitrogen. The cryoprotectant was washed out with PB and the sections were stored in PB containing 0.05% sodium azide until further processing. The intrinsic peroxidase activity was blocked by incubating the sections in 1% H2O2 diluted in PB for 10
minutes. Afterwards the sections were washed in PB until the bubble formation stopped. Then the buffer was exchanged to TBS (pH 7.6). Avidin-biotinylated peroxidase-complex (ABC, Vector Laboratories, Burlingame, CA) was diluted 1:400 in TBS and added to the sections overnight. For visualization the sections were preincubated with 0.5% 3,3'-diaminobenzidine-hydrochloride (DAB; Sigma) for 10 minutes, then 0.01% hydrogen peroxide was added to start the reaction. After reaching optimal color intensity the reaction was stopped by washing with TB. The DAB reaction product was intensified by a modified silver impregnation technique (Dávid et al., 2007;Gorcs et al., 1986) resulting in a dark brown to black staining of the biocytin filled cells and their processes.
The cells visualized by fluorescent dye were automatically imaged by an LSM510 laser scanning microscope (Zeiss, Oberkochen, Germany). The acquired image stacks were reconstructed in 3D using the confocal module of the software Neurolucida (MBF Bioscience Europe, Magdeburg, Germany). The brightfield
sections were reconstructed with a standard Neurolucida set-up based on an Eclipse 80i (Nikon, Ratingen, Germany).
Morphological analysis
Somatic features were measured from infrared Dodt Gradient contrast pictures of the recorded neurons. Briefly, the soma was manually delineated using Image-Pro 5.1 software (Media Cybernetics Inc., San Diego CA) and length of major and minor axes, perimeter and area were extracted. The soma elongation was calculated as the ratio between major and minor axis. Somata exhibiting an elongation larger than 2 were defined as fusiform (Cauli et al., 2000). Roundness was calculated according to : area perimeter × π 4 2
; a value close to 1 is indicative of round somata.
From the labeled and reconstructed neurons, the following parameters were extracted: orientation of major axis relative to the radial axis, number of primary dendrites, vertical and horizontal span of the dendritic tree. Two further features of the cells were calculated from the basic data: “verticality” and “multipolarity” (see supplementary materials). Verticality was defined as the ratio between vertical and horizontal spans of the dendritic tree. Radially oriented cells displayed a verticality larger than 1. For the calculation of multipolarity, the centroid of the cell was used as a point of origin, from which the angle of each dendrite was measured relative to the closest pole of the cell, defined by the crossing point of the major axis of the cell and the cell membrane. Multipolarity was defined as the ratio between the dendrite-containing sectors and the dendrite-free lateral sectors. High multipolarity values indicate a homogeneous distribution of dendrites in space whereas values close to 0 describe polarized cells.
Cells were classified according to their somatodendritic morphology as: (i) Bipolar cells (n=28 of 68) if they possessed two dendrites emerging from the upward and downward poles of the soma. Similar neurons exhibiting a third very short, non-branching and thin dendrite were considered as modified bipolar cells (n=4). (ii) Tufted cells (n=19) were basically similar to bipolar neurons, but displayed at least one (single tufted) or two (bitufted) dendritic tufts (i.e., at least 2 separate primary dendrites) emanating from the pole(s), single and bitufted cells were not differentiated. (iii) Multipolar cells (n=32) displayed at least 4 dendrites distributed around the perimeter of the cell.
Unsupervised clustering
To classify cells unsupervised clustering was performed using 32 electrophysiological parameters (see above), 10 molecular parameters (Vlgut1, GAD65 and/or GAD67, NOS-1, CB, PV, CR, NPY, VIP, SOM and CCK) and the laminar location determined by infrared videomicroscopy and confirmed after biocytin labeling (see above). For neurons located at the border of layers I-II and III-IV, the laminar location was digitized by 1.5 and 3.5, respectively. Neurons positive for GAD65 and/or GAD67 were denoted as GAD positive and these mRNAs were considered as a single molecular variable as previously described (Gallopin et al., 2006). Parameters were standardized by centering and reducing all of the values. Cluster analysis was run on Statistica 6 software (Statsoft, Tulsa, OK) and within the MATLAB environment (The Mathworks, Boston, MA).
In Ward's method (Ward, 1963) individual cells are first linked to their nearest neighbor and combined two-by-two into objects of a superior hierarchic order. This linkage procedure is repeated on these objects until when the top hierarchic level is
reached. The final number of clusters was established by hierarchically subdividing the clustering tree into higher order clusters to achieve a relative enrichment of NPY-expressing neurons. Comparison of the occurrence of a given molecular marker
between populations of cortical neurons was done according to:
b a b a
n
pq
n
pq
p
p
+
−
=
ε
where pa, pb, represent the percentage of occurrence and na, nb, the number of
individuals in populations a and b. The variable p denotes the percentage of occurrence in the overall population with q=1-p. This quantity |ε| was tested against a normal distribution to determine statistical significance of the difference of expression (Fisher and Yates, 1963). Comparison of electrophysiological and morphological properties between populations was performed using a Mann-Whitney U-test. All reported values are means ± s.d. unless otherwise stated.
Clustering validation
The obtained Ward's classification was first validated by comparing it with an alternative clustering of the same data performed with the K-means algorithm (McQueen, 1964;Hartigan and Wong, 1979). This method generates clusters, for a given pre-imposed number of K clusters, in a top-down manner. The positions of the K clusters centroids are initially randomly generated and are iteratively optimized until when the cluster centroid positions converge to a stable position. This method potentially achieves a more statistically significant discrimination between cellular classes, since suboptimal attributions of cells to specific clusters can be dynamically corrected across the iterations, unlike the Ward’s method. However, the number of K clusters has to be set according to a substantially arbitrary criterion. Clusters were
therefore generated for several increasing values of K. For each K, the K-means algorithm was run starting from 1000 different random initial positions of the K cluster centroids, with a cutoff number of iterations per run equal to 1000. In the case of the present validation analysis, the best value of K was determined by comparison with the reference Ward's clustering. A cluster Ak-means generated by K-means clustering
was considered to match a cluster AWard generated by Ward's clustering if a
sufficiently large fraction of its elements belonged as well to the cluster AWard. K was
then fixed by taking its smallest value for which all the K-means clusters of NPY neurons matched a Ward's cluster.
The significance of the classification obtained by unsupervised clustering was further validated by comparison with randomized databases. To perform the randomization, the experimental dataset was represented as a matrix whose 43 columns corresponded to the different measured features (i.e. laminar location, the 32 electrophysiological parameters and the 10 molecular parameters) and whose rows corresponded to different neurons. A randomized database was then built by permuting randomly and independently the order of entries within each column. This scrambling did not alter the mean values and the standard deviations of the randomized parameters but disrupted the structured correlations between the measurements of the different features. Clustering of the randomized databases was performed using the same parameters as for the K-means clustering of the original database. The quality of different clustering was quantitatively assessed by means of silhouette analysis (Rousseeuw, 1987). Given a data-point i in a cluster A, let a(i) denote the average Euclidean distance between i and other data-points in the cluster A; let b(i) denote the average Euclidean distance between i and points in the second closest cluster. The silhouette value S(i) was then computed using the following
formula: S(i)= b(i)− a(i)
max[a(i),b(i)]. The inequality −1≤ S(i) ≤1 holds. A silhouette value about zero means that the data-point lies equally far away from more than one cluster. Large negative silhouette values indicate on the other hand a potential misclassification. The overall silhouette width S(A) for a given clustering A is defined as the average of the S(i) over the whole dataset and is used as global measure of quality of a possible clustering. The silhouette widths of the clusterings of different randomized databases were computed and compared with the silhouette width of the K-means clustering of the original, non-randomized database. A significant reduction of the clustering quality was expected to arise after randomization, whenever the clustering quality of the original clustering is “meaningful”, i.e., not just generated by accidental random correlations between the measurements. Silhouette widths were computed for 2000 independently randomized databases and the effective loss of quality assessed by averaging the quantity [S(scrambled) − S(original)]/S(original) over all these realizations.
Unsupervised clustering inclusive of morphological properties
For a subset of n=68 morphologically recovered GABAergic interneurons, an additional clustering was performed considering also the measurements of 12 somatodendritic morphological properties, in addition to laminar location, electrophysiological and molecular properties. Unsupervised clustering was performed using the K-means method.
In order to evaluate the relevance for classification of the different classes of properties, comparison was performed with randomized databases. A first randomized database was obtained by scrambling laminar location and the 12
morphological properties; a second database was built by scrambling the 32 electrophysiological properties; and a third by scrambling the 10 molecular properties. Losses in the clustering quality were once again quantified by comparing silhouette widths before and after the randomization.
Results
Two hundred cortical neurons of superficial layers (I-IV) were first selected according to their laminar location and the shape of their soma as seen by infrared videomicroscopy (Stuart et al., 1993). In order to increase the probability of recording NPY neurons, cells exhibiting at least one vertically oriented process, a morphological feature frequently observed for NPY neurons (Hendry et al., 1984b), were preferentially selected. Neurons from layers I (n=8), II-III (n=133) and IV (n=59) were then characterized by combining patch-clamp recordings, scRT-PCR and biocytin labeling (Cauli et al., 1997) for physiological, molecular and morphological identification, respectively. To take into account the electrophysiological diversity of cortical neurons, 32 electrophysiological features adopting Petilla terminology (Ascoli et al., 2008) were determined for each cell (see Materials and Methods). The scRT-PCR protocol was designed to detect mRNAs encoding 10 molecular markers commonly used to define subpopulations of cortical neurons: VGluT1, GAD, NOS-1, CB, PV, CR, NPY, VIP, SOM and CCK (see Materials and Methods). The somatodendritic morphology of physiologically and molecularly characterized neurons was successfully revealed for n=96 out of 200 neurons and basic morphometric analysis of the soma and dendritic arbor were determined for n=68 interneurons. As expected from our sampling procedure and in accordance with the literature (Jin et al., 2001) neurons were mostly radially oriented (Fig. 1B and Table 8).
To identify and define NPY neuron subtypes with similar, but not necessarily identical properties, we used a polythetic classification scheme (Tyner, 1975) defined according to: (i) neurons of a group must share a large number of common features (ii) each feature must be possessed by a large but unstated number of individuals in the group and (iii) no feature is necessarily possessed by all members of the group. Ward's clustering (Ward, 1963), which group together individuals with large similarities, meets these prerequisites and has been extensively used for neuronal classes definition based on multiple electrophysiological, molecular and/or morphological features (Andjelic et al., 2008;Cauli et al., 2000;Dávid et al., 2007;Dumitriu et al., 2006;Gallopin et al., 2006;Halabisky et al., 2006;Helmstaedter et al., 2008;Karube et al., 2004;Tamas et al., 1997). This algorithm works by grouping together cells with the largest overall similarity into clusters and then by grouping these high-order clusters into new clusters of increasingly lower order. A clustering tree (dendrogram) is then built, starting from its leaves (individual cells), and grouping them into branched ramifications up to a common root (Fig. 1A).
The hierarchic clustering tree generated by the Ward’s method showed that cortical neurons are first segregated into two clusters (Fig. 1A. All neurons of cluster 1 (n=46) expressed VGluT1 but not GAD (Table 3) and thus are glutamatergic neurons. Since NPY was rarely expressed in glutamatergic cluster neurons (1 out of 46 (2%), Fig. 1A and table 3), this group was not considered for further subdivision. In contrast, all neurons of cluster 2 (n=154) expressed GAD with (23%) or without VGluT1 (77%) and corresponded to GABAergic neurons. In good agreement with previous observations (Cauli et al., 2000;Gallopin et al., 2006) glutamatergic neurons were perfectly segregated from GABAergic interneurons. These GABAergic neurons exhibited a much higher proportion of NPY-expressing cells (40%, p<0.001, Fig. 1A).
This cluster was further divided into 2 second order branches (Fig. 1A). Cluster 2.1 (n=34 neurons), in which 29% of the neurons expressed NPY (Fig. 1A), was otherwise exclusively composed of PV-expressing neurons displaying brief spikes and high and sustained firing rates characteristic of the FS neurons (Kawaguchi, 1993;Kawaguchi and Kubota, 1993;McCormick et al., 1985), and was termed FS-PV cluster (Kawaguchi and Kubota, 1993). The molecular diversity of cluster 2.2 neurons was much larger since all used molecular markers of GABAergic neurons, including NPY in a high proportion (43%), were detected in different combinations (n=120, data not shown), suggesting that it contained different neuronal populations in its higher order branches. Cluster 2.2 neurons exhibited indeed different firing behaviors: continuous adapting (n=95), bursting (n=17) and delayed (n=8) and different morphologies (Fig. 1B). Its two branches revealed heterogeneous molecular, electrophysiological and morphological features as well (Fig. 1A and B). In addition, cluster 2.2.1 contained the majority of adapting neurons (61%) whereas cluster 2.2.2 contained the large majority of bursting neurons (88%) and all delayed neurons suggesting that both clusters are composed of different populations and can be further subdivided (Fig. 1A). Almost all cluster 2.2.1.1 neurons expressed SOM (94%) in addition to NPY (70%, Fig. 1A and Table 3). At high firing rates, these cells also displayed a marked frequency adaptation characteristic of adapting (n=16) and burst firing (n=1) neurons and were therefore termed adapting SOM neurons. Cluster 2.2.1.2 neurons rarely expressed NPY (16%, Fig. 1A and Table 3) but frequently VIP (74%, Table 3). All neurons of this cluster (but one) were adapting cells and were termed adapting VIP neurons. Similarly cluster 2.2.2.1 neurons rarely expressed NPY (18%, Fig. 1A) as compared to VIP (77%, Table 3). The majority of these cells (n=17 out of 22) displayed a burst firing behavior and were termed bursting VIP neurons.
NPY was frequently expressed (76%, Fig. 1A) in cluster 2.2.2.2 neurons which mainly contained adapting neurons (n=30) and all delayed neurons (n=8). Since at high firing rates, both spiking behaviors exhibit a marked frequency adaptation (Kawaguchi, 1995) these cells were termed adapting NPY neurons. In summary, this Ward's clustering allowed to discriminate 3 different clusters of neurons for which NPY was detected with a relatively high occurrence: 29, 70 and 76% for FS-PV, adapting SOM and adapting NPY neurons.
Three main classes of NPY-expressing neurons
FS-PV cells, absent from layer I, were among the deepest neurons of our sample (Table 2) and generally displayed large fusiform somata (Fig. 2A, E and Table 2). In good agreement with previous reports (Cauli et al., 1997;Cauli et al., 2000;Fuentealba et al., 2008;Gallopin et al., 2006;Gonchar et al., 2007;Kubota et al., 1994;Wang et al., 2002), PV was frequently co-expressed with CB and to a lesser extent NPY (Fig. 2B and D and Table 3). These cells were characterized by low input resistance, short membrane time constant (Fig. 2A and C, Table 4) and the highest rheobase (Fig. 2A and C and Table 5) of our sample. They also typically (Kawaguchi, 1993;Kawaguchi and Kubota, 1993) fired action potentials of short duration and small amplitude (Table 7) with sharp and monophasic (n=25 out 34 neurons) fast AHP (Fig. 2A and C, Table 7). However, in some FS-PV neurons (n=9 out of 34) action potential repolarization consisted of a first fast AHP component followed by a fast ADP and a second late AHP component (data not shown). The majority (56%) of FS-PV neurons exhibited an acceleration of their firing rate when depolarized just above threshold (Table 5). Interestingly, NPY-expressing FS-PV neurons (n=10) fired action potentials with a longer latency (512.8 ± 242.9 ms, Fig. 2A, B and E) than other
FS-PV neurons (264.1 ± 231.1 ms, p<0.05, Fig. 2C, D and E). However, no other statistically significant difference in electrophysiological, molecular or morphological features could be observed between these two classes of FS-PV neurons (data not shown). At higher stimulation intensities FS-PV neurons were distinctly able to sustain a high firing rate resulting in a high steady state frequency with little or no frequency adaptation (Fig. 2A and C and Table 6).
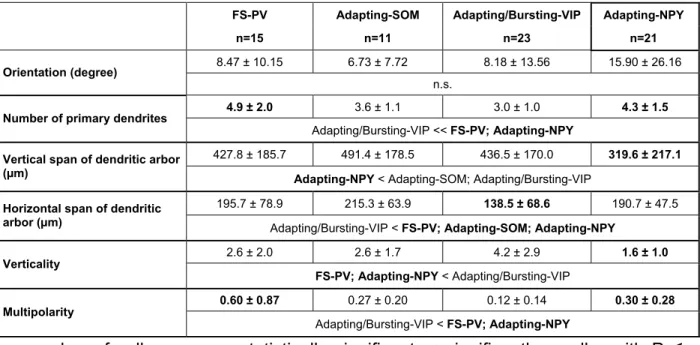
FS-PV neurons contained a high number of primary dendrites emanating in all directions which results in a high multipolarity value (Table 8). The majority of FS-PV cells (n=11 out of 15) displayed a multipolar dendritic morphology (Fig. 1B a4-5, Table 8), the remaining FS-PV neurons being either tufted (n=2) or bipolar (n=2). The axon of the multipolar FS-PV cells was basically restricted to their home layer with an overall configuration being compatible with basket cells (Fig. 1B a4-5; (Kawaguchi, 1995;Wang et al., 2002)) but not with chandelier cells (Kawaguchi, 1995). The FS-PV cells with the most vertically biased dendritic trees tended to project into the neighboring layers, too.
Similarly to FS-PV neurons, adapting SOM neurons were absent from layer I and exhibited large fusiform somata (Fig. 3A and Table 2). SOM was detected in all (but one) neurons (n=17) of this cluster and was frequently co-expressed with CB and NPY (Fig. 1A and 3B and Table 3), two molecular markers classically associated with SOM. (Gonchar et al., 2007;Gonchar and Burkhalter, 1997;Kubota et al., 1994). A very low proportion of SOM neurons (n=1 out of 17) expressed NOS-1 (Fig. 1A). Remarkably, adapting SOM neurons exhibited a depolarized resting membrane potential (Table 4) and, as indicated by their low rheobase (Table 5), were electrically more excitable than any other neuronal type of the present study, in marked contrast to the FS-PV type. Another highly distinctive feature of adapting SOM neurons was
the pronounced voltage sag induced by hyperpolarizing current pulses (Fig 3A, Table 4). Typically, at high stimulation intensities, the pronounced frequency adaptation of these neurons developed slowly resulting in a slow time constant of early frequency adaptation (Table 6). These neurons fired action potentials of a duration intermediate between FS-PV neurons and glutamatergic neurons (Table 7) making difficult their identification based on spike width.
Morphologically recovered adapting SOM neurons (n=11) displayed a radially oriented dendritic arbor (Fig. 1B a6 and Table 8) and were either bipolar (n=3), tufted (n=4) or multipolar (n=4). Basic inspection of their axonal arbor revealed an axon ascending (n=8 out of 11) into and arborizing in layer I (n=5 out of 11; Fig. 1B a6), a morphological feature of SOM-expressing Martinotti cells of rats (Cauli et al., 1997;Kawaguchi and Kubota, 1996;Wang et al., 2004) and transgenic mice (Dumitriu et al., 2006;Halabisky et al., 2006;Ma et al., 2006).
In contrast to other types of NPY-expressing neurons, adapting NPY cells were the most superficial neuronal class (Table 2) and the majority of layer I neurons (n= 7 out of 8) fall into this cell population. The adapting NPY cluster contained the largest proportion of NPY-expressing neurons (n=29 out of 38, Fig. 1A, 4B and D and Table 3) and NOS-1 was more frequently detected in these neurons than in any other cell class (Fig. 1A, 4B and Table 3). Adapting NPY neurons exhibited the lowest minimal frequency of our study (Table 5) indicative of a slow spiking behavior near threshold. In addition, adapting NPY neurons fired action potentials with a biphasic afterpotential consisting of early and late component AHP (n=28 out of 38) with little or no fast ADP (n=17 out of 34, Fig. 4A, C and Table 7) being in marked contrast with other clusters of GABAergic neurons (Table 7) which exhibited either monophasic (FS-PV neurons) or complex afterpotential waveforms (adapting SOM, VIP and
bursting VIP). Despite these considerations it was difficult to find other discriminative electrophysiological features for adapting NPY neurons. Indeed, these cells shared some properties with other neuronal classes. For instance and similarly to FS-PV neurons, some (n=11 out of 38) adapting NPY cluster neurons displayed an acceleration of their firing rate including 2 neurons that could be clearly identified as delayed cells (data not shown). On the other hand, high stimulation intensity resulted in a marked frequency adaptation and a pronounced amplitude accommodation (Fig. 4A, C and Table 6), two physiological behaviors also observed in VIP-expressing neurons (Cauli et al., 2000) but not in other GABAergic neuronal classes.
Similarly to FS-PV neurons, morphologically examined adapting NPY neurons (n=21) displayed a large number of primary dendrites emanating in all direction (Fig. 1B a9-10). The dendritic arbor was most evenly distributed resulting in a relatively high multipolarity value (Table 8). In addition the compact dendritic arbors exhibited a small vertical span and verticality (Table 8). Adapting NPY neurons were either multipolar (n=13), tufted (n=5) or bipolar (n=3) at the somatodendritic level. Basic examination of the axon of adapting NPY neurons revealed, in most instance (n=7 out of 8), a very thin and dense axon ramifying in all directions (Fig. 1B a9-10) resembling those of neurogliaform neurons (Hestrin and Armstrong, 1996;Kawaguchi, 1995;Povysheva et al., 2007;Tamas et al., 2003;Zhou and Hablitz, 1996).
Classes of infrequently NPY-expressing cortical neurons
In addition to the three types of NPY-expressing cells described above, Ward's clustering retrieved three other neuronal groups (i.e. glutamatergic, adapting VIP and bursting VIP) corresponding to previously described populations (Cauli et al.,
1997;Cauli et al., 2000;Connors and Gutnick, 1990;Kawaguchi and Kubota, 1996;McCormick et al., 1985;Staiger et al., 2004).
Glutamatergic neurons, absent from layer I, were among the deepest neurons of our study and exhibited small somata (Fig. 5A and C and Table 2), These cells displayed either adapting (originally referred as "regular spiking", n= 33, Fig. 5A, (Connors and Gutnick, 1990;McCormick et al., 1985;Mountcastle et al., 1969)) or intrinsically bursting (n= 13, Fig. 5C) firing behaviors. Adapting cells were found in layers II to IV whereas, and in good agreement with previous reports (Connors and Gutnick, 1990;McCormick et al., 1985;Schubert et al., 2003;Staiger et al., 2004), bursting cells were almost exclusively found in layer IV, except for one neuron located in layer III (cf. (de Kock and Sakmann, 2008)). Glutamatergic neurons were characterized by a hyperpolarized resting membrane potential (Table 4) and a relatively pronounced voltage sag (Fig. 5A, 5C and Table 4). Remarkably, and in good agreement with previous observations (Cauli et al., 1997;Cauli et al., 2000;Connors and Gutnick, 1990;Kawaguchi, 1993;McCormick et al., 1985), glutamatergic neurons fired long duration action potentials with marked amplitude reduction and duration increase (Fig. 5A, 5C and Table 7). Their first AHP components were distinctly long lasting and of small amplitude (Fig. 5A, 5C and Table 7). At high stimulation intensities glutamatergic neurons also exhibited a marked spike amplitude accommodation, a pronounced early frequency adaptation (Fig. 5A, 5C and Table 6) and a low maximal steady state frequency (Table 6) which were also distinctive features.
Glutamatergic neurons were relatively homogeneous at the electrophysiological and molecular levels but they revealed heterogeneous morphologies (Fig. 1B a1-3) supporting the idea that glutamatergic neurons are composed of more than one neuronal type (Connors and Gutnick, 1990;McCormick et al., 1985;Nelson et al.,
2006;Sugino et al., 2006). The same characteristics were used to distinguish three types of morphology as in (Staiger et al., 2004). Briefly, spiny neurons in layer IV without an apical dendrite extending out of the barrel into supragranular layers were categorized as (i) spiny stellate cells. Spiny neurons with a prominent apical dendrite were divided into two further classes: if the other primary dendrites were distributed around the whole perimeter of the cell body then the cell was classified as (ii) star pyramidal cell, and if the other (non-apical) dendrites were clustered in a zone around the basal pole of the cell body the cell was classified as pyramidal cell. Glutamatergic neurons exhibited either spiny stellate (n=10, Fig. 1B a2), star pyramidal (n=2, Fig. 1B a3) or pyramidal cell (n=16, Fig. 1B a1), morphologies that could not be correlated with either adapting or bursting behaviors (Connors and Gutnick, 1990;McCormick et al., 1985;Staiger et al., 2004).
Although, Ward's method defined two different classes of VIP-expressing neurons (i.e. adapting VIP and bursting VIP), these two neuronal groups possessed numerous common properties. Both classes were virtually (n=64 out of 65) absent from layer I, as previously described (Bayraktar et al., 2000;Gonchar et al., 2007;Uematsu et al., 2008). However, in contrast with adapting VIP neurons, bursting VIP neurons exhibited smaller and rounder somata which could not generally be categorized as fusiform (Table 2).
Adapting and bursting VIP cells were characterized by a high occurrence of VIP and CR to a lesser extent (Table 3) and exhibited the highest input resistance (Fig. 6A and C and Table 4) and the lowest membrane capacitance (Table 4) of our sample. This suggests that adapting and bursting VIP neurons might correspond to a single neuronal type whose bursting behavior can be viewed as an "uncommon" feature (Tyner, 1975). The Ward subdivision of VIP neurons in two clusters is presumably
reflected by electrophysiological features affected by the high firing rate that occurs in bursts of action potentials. Indeed, bursting behavior being defined by high frequency at the onset of firing followed by a strong adaptation (Ascoli et al., 2008), this results in higher minimal steady state frequency and a more pronounced adaptation in bursting VIP than in adapting VIP neurons (Fig. 6C, Table 5). Bursting VIP neurons also fired action potentials (Fig. 6C) with shorter spike latency (Table 5) and displayed a more pronounced amplitude reduction and a larger duration increase (Fig. 6C, Table 7). On the other hand, adapting VIP neurons typically (n=40 out 43) displayed complex repolarization phase of their first two action potentials consisting of a first component AHP, followed by a pronounced ADP and a late AHP component (Fig. 6A). In bursting VIP neurons this repolarization behavior was almost never observed (n=1 out of 22, p<0.001) for the first spike (Fig. 6C) and rarely for the second one (n= 9 out of 22).
In good agreement with previous reports (Cauli et al., 1997;Porter et al., 1998) both adapting VIP and bursting VIP neurons displayed the lowest and the most polarized number of primary dendrites which formed a slender vertical dendritic tree (Fig. 1B a7-8, Table 8) spanning at least layers I to IV (some of them reaching layer Vb or VI). VIP cells were indeed dominated by bipolar (n= 11 out of 23) and tufted (n=9) somatodendritic morphology, the remaining neurons (n=3) being multipolar. As previously observed for both adapting and bursting VIP neurons (Cauli et al., 1997;Kawaguchi and Kubota, 1996;Porter et al., 1998), their axonal arbor was mainly descending (Fig. 1B a7-8) and, in some cases, reached the border of the white matter (Fig. 1B a7). The VIP cells with multipolar morphology (n=3 out of 23; not shown) could belong to the small basket cell population (Kawaguchi and Kubota, 1996;Wang et al., 2002). The difference in firing pattern of VIP neurons was not
found to correlate with other differences of either connectivity (Porter et al., 1998), pharmacological profile (Cauli et al., 2000;Férézou et al., 2002;Férézou et al., 2006;Porter et al., 1999) or morphology (Cauli et al., 1997;Kawaguchi and Kubota, 1996;Porter et al., 1998;Wang et al., 2002). This strongly argues in favor of adapting VIP and bursting VIP neurons as being a single neuronal type that can exhibit an "uncommon" feature (burst of action potential) in a polythetic classification scheme (Tyner, 1975).
Validation of Ward's clustering
The bottom-up approach of Ward's clustering provides a hierarchic classification but can constitute as well a limitation. Indeed, single cells are early assigned to a branch of the tree without the possibility to correct this initial assignment. This can result in a relatively poor accuracy of clusters, especially at higher levels of clustering. In contrast, K-means clustering (Hartigan and Wong, 1979;MacQueen, 1967), generates clusters for a given pre-imposed number of K clusters (see Materials and Methods), in a top-down manner. Suboptimal attributions of cells to specific clusters can be detected and corrected dynamically across the algorithm iterations. Therefore, this method potentially achieves a more statistically significant discrimination between cellular clusters, the major difficulty being to determine the optimal number of clusters K.
The reliability of Ward's clustering was then assessed by comparing it with the clusters generated by the K-means method (see Materials and Methods). The lowest K value generating clusters matching all the three Ward’s clusters of NPY neurons was obtained for K=7 (Fig. 7A). For this value, 94, 82 and 95% of FS-PV, adapting SOM and adapting NPY neurons respectively were matching the corresponding
Ward's clusters (Fig. 7A). In addition, K-means clustering also generated 3 glutamatergic clusters, strictly included within the Ward’s glutamatergic cluster, and were merged into a single glutamatergic cluster for the sake of simplicity. Finally, a single cluster of VIP neurons containing the Ward's adapting and bursting VIP clusters was generated (Fig. 7A and B; see also supplementary Tables S1-5). Interestingly, K-means could not generate a separated cluster matching the Ward's bursting VIP cluster. This further indicates that adapting VIP and bursting VIP neurons share important similarities (see above). The smaller K value matching all the clusters of the reference Ward clustering, including the bursting VIP cluster, was K=12. Interestingly, for this value, additional subdivisions of the Ward adapting VIP and adapting NPY clusters were also generated (see Supplementary Fig. S1 and tables S6 to S10). One of the adapting NPY subclusters (n=26, adapting NPY 2 subcluster) was characterized by a higher occurrence of NOS-1 associated with a higher rheobase (see Supplementary tables S6 and S8) and larger spike amplitudes. Interestingly, also all neurons of the left branch of the Ward adapting NPY cluster (n=8, Fig. 1A) expressed NOS-1. It was however difficult, for both Ward and K-means clustering, to find striking distinctive electrophysiological feature(s) allowing a clear cut discrimination of adapting NPY (and VIP) neurons into robust subclasses.
Similarly, K-means clustering restricted to the sample of NPY-positive neurons (n=63) also reliably reproduced the three classes of NPY neurons for a K value as small as K=3. For this value, 80, 100, and 93% of FS-PV, adapting SOM and adapting NPY neurons respectively were matching the reference Ward’s cluster of frequently NPY-expressing neurons (see Supplementary Fig. S2 A). The remaining NPY cells, corresponding mainly to adapting and bursting VIP neurons, were grouped with adapting NPY neurons. A K value of K=4, for which the matching of the
three types of frequently expressing NPY neurons was maintained, was necessary to segregate adapting/bursting VIP neurons from adapting NPY neurons (see Supplementary Fig. S2 B). Interestingly, for K=5 K-means algorithm also reproduced the subdivision of adapting NPY cells in adapting NPY 1 and NPY 2 neurons while preserving the matching of FS-PV and adapting SOM neurons (see Supplementary Fig. S2 C). These observations indicate that unsupervised clustering limited to NPY-expressing neurons did not improve the discrimination between NPY neuron subtypes, but notably matched the cluster subdivision obtained by K-means over the whole sample.
The overall quality of the reference Ward's clustering and of the K-means clustering was evaluated by computing their silhouette width (see Materials and Methods). The silhouette width of the Ward's clustering was S(Ward) = 0.26 and the silhouette width of the retained K-means clustering (i.e., K=7 with merged glutamatergic clusters) was S(K-means) = 0.30 (Fig. 7C). K-means method provided therefore a refined quality unsupervised classification of the analyzed cells, in substantial agreement with the Ward’s method, as shown by the elevated degree of matching between the two clusterings (Fig. 7A).
In order to assess the statistical significance of these unsupervised classifications, comparisons were also performed with clusterings of randomized databases (see Materials and Methods). The average silhouette width of a K-means clustering of a fully randomized database (for K=7) was S(fully randomized) = 0.034 ± 0.004, which is noteworthy smaller than for the original non-randomized database (overall quality reduction of 89%, Fig. 7C). This large decrease in the quality of clustering after global randomization of the database attests that non-trivial structured correlations between
the measurements of the different features do exist, leading to the possibility of a significant and robust unsupervised classification.
Relevance of the different groups of properties for the classification
For a subset of n=68 morphologically recovered GABAergic interneurons unsupervised clustering was also performed taking into account the 12 somatodendritic morphological features in addition to the previously used properties (n=43). Interestingly, the introduction of morphological descriptors did not modify significantly the obtained classification, since, starting from a value of K=7, most of the obtained clusters matched the Ward’s reference classification (Fig. S3 A and B). Once again, K-means uncovered the potential existence of multiple adapting NPY subclusters. For instance, for K=7, the adapting NPY cluster broke into two subclusters and few NPY neurons belonging to other Ward’s clusters grouped to form a further adapting NPY subcluster (adapting NPY a,b and c subclusters; see Supplementary Information, Tables S11 to S16). This multiplicity of NPY clusters reflected however the over-representation of NPY neurons into the small database used for the full polythetic clustering (NPY expressed by n=35 out of 68 cells, i.e. 51% of cells in the database, against 31% in the full database of 200 cells). The limited number of morphologically reconstructed cells prevented to give an unambiguous simple description of the specificities of the different adapting NPY subtypes.
The full polythetic clustering over 68 GABAergic interneurons had an overall silhouette width of S=0.27 (Fig. 8). Databases in which only layer location and morphological properties were randomized beared clusterings with an average silhouette width of S(morphological scrambled) = 0.22 ± 0.01. When only
electrophysiological properties were randomized, the average silhouette width was S(electrophysiological scrambled) = 0.09 ± 0.01. Finally, when only molecular properties were randomized, the average silhouette width was S(molecular scrambled) = 0.18 ± 0.01. 13 morphological properties (including laminar location), 10 molecular properties, and 32 electrophysiological properties were considered in full polythetic clustering. The loss of clustering quality had therefore to be weighted by the different numbers of scrambled properties (Fig. 8). The scrambling of a single morphological property produced an average quality reduction of the (1.5 ± 0.3%); the scrambling of a single electrophysiological property produced an average quality reduction of the (2.0 ± 0.1%); and the scrambling of a single molecular property produced an average quality reduction of the (3.3 ± 0.4%). This analysis suggests that the measurement of molecular properties is more informative than the measurement of, in the order, electrophysiological and morphological properties for the correct classification of a specific cell.
Discussion
The aim of the present study was the identification and characterization of different subpopulations of NPY-expressing neurons. Electrophysiological, molecular and morphological features of recorded neurons were determined by combining whole-cell current clamp recordings, single-whole-cell RT-mPCR and biocytin labeling. Neuronal types were defined by using two different unsupervised clustering algorithms taking simultaneously into account, laminar location, as well as physiological and molecular properties. Remarkably, this classification scheme clearly disclosed an abundant population of interneurons co-expressing NPY and NOS-I with distinctive electrophysiological, molecular and morphological properties. In addition, it consistently retrieved two other types of NPY-expressing neurons (adapting SOM and FS-PV).
Polythetic classification schemes of cortical neurons
Our classification of cortical neurons was based on laminar location, electrophysiological and molecular features (see Materials and Methods) chosen to describe physiological and molecular phenotypes described in the literature (Ascoli et al., 2008). In order to (i) avoid an arbitrary choice of features considered to be "essential" for membership and (ii) restrict the number of generated neuronal classes we used a polythetic classification scheme (Tyner, 1975), which intrinsically tolerates a certain degree of variability within cell classes.
For this same reason, it is not surprising that the clusterings obtained by the Ward’s and the K-means methods are slightly different. A small number of individual cells are assigned to different clusters by the two methods, but matching clusters continue to share similar average features, thus corresponding to completely equivalent
polythetic classifications. The robustness of such a classification is made manifest by the fact that it is consistently generated by multiple methods belonging to qualitatively different algorithmic families. Although Ward’s clustering achieves a statistically lesser significant discrimination between cellular classes than K-means clustering, this algorithm offers the advantage that it does not require any preliminary assumption about the number of cell classes.
Functional diversity of NPY-expressing interneurons types
The relevance of our classification of NPY-expressing interneurons into three main types is further supported by functional evidence. Indeed, specific function is considered to be the ultimate criterion for neuronal type definition (Ascoli et al., 2008). The well established FS-PV type (Cauli et al., 1997;Kawaguchi and Kubota, 1993) was mainly composed of basket cells (Kawaguchi and Kubota, 1993;Wang et al., 2002). These interneurons exert perisomatic inhibition (Freund and Katona, 2007;Reyes et al., 1998;Tamas et al., 2004) and form an electrically coupled network (Galarreta and Hestrin, 1999;Gibson et al., 1999). In good agreement with previous studies, about one third of cortical FS-PV neurons co-expressed NPY at the mRNA (Cauli et al., 1997;Cauli et al., 2000;Gallopin et al., 2006;Wang et al., 2002) and protein levels (Fuentealba et al., 2008), a molecular feature that correlates with the first spike latency (present study). These electrophysiological behavior is due to an ID-type K+ current mediated by channels composed of Kv1.1 subunits as indicated by
modeling (Golomb et al., 2007), pharmacological and immunocytochemical evidence (Goldberg et al., 2008;Povysheva et al., 2008). Based on their axon, and to a lesser extent dendrites, FS-PV basket cells can be subdivided in two subclasses : large and nest basket cells that also exhibit different firing properties : large basket cells being
delayed whereas nest basket cells can be either delayed or continuous (Wang et al., 2002). However, and presumably due to the harvesting procedure, the axon of most of our FS-PV cells was not sufficiently stained to determine precisely their morphological subclass. Similarly, no statistically significant differences in the somatodendritic features of NPY-positive and -negative FS-PV neurons could be determined.
Adapting SOM type interneurons corresponded mainly to Martinotti cells characterized by an ascending axon (Cauli et al., 1997;Kawaguchi and Kubota, 1996;Wang et al., 2004). Adapting SOM interneurons receive facilitating excitatory postsynaptic potentials from pyramidal cells (Reyes et al., 1998) that result in strong recurrent inhibition (Kapfer et al., 2007). Similarly to FS-PV neurons, adapting SOM cells also form a network of electrically coupled interneurons (Gibson et al., 1999) whose rhythmic activity is synchronized by group I metabotropic glutamate agonists (Beierlein et al., 2000) through the activation of the mGluR1α receptors they express (Baude et al., 1993;Cauli et al., 2000).
Remarkably, adapting NPY neurons exhibited electrophysiological and morphological properties very similar to those of neurogliaform cells (Ascoli et al., 2008;Chu et al., 2003;Kawaguchi, 1995;Simon et al., 2005) known to express α-actinin 2 (Price et al., 2005;Uematsu et al., 2008), NPY and NOS-1 (Cauli et al., 2004;Estrada and DeFelipe, 1998;Price et al., 2005;Zaitsev et al., 2008). Neurogliaform cells, responsible for the slow GABAergic inhibition of pyramidal cells (Szabadics et al., 2007;Tamas et al., 2003) and interneurons (Olah et al., 2007), occupy a particular place in the cortical circuit. Indeed and in contrast to FS-PV and adapting SOM interneurons, their electrical coupling is much more complex as neurogliaform cells are not only coupled with other neurogliaform cells (Chu et al., 2003) but also with
FS-PV and putative adapting SOM neurons (Simon et al., 2005). Adapting NPY neurons might orchestrate a complex network composed of the three main types of NPY-expressing cells. Furthermore these neurons exhibit pharmacological profiles distinct form other NPY-expressing interneurons but, interestingly, similar to VIP neurons since they are responsive to nicotinic (Christophe et al., 2002;Gulledge et al., 2006;Porter et al., 1999), µ-opioids (Férézou et al., 2006) and presumably 5-HT3 agonists (Férézou et al., 2002;Zhou and Hablitz, 1999).
Taken together their differential connectivity and pharmacological profile indicate that FS-PV, adapting SOM and adapting NPY neurons constitute three functionally distinct populations of NPY interneurons that now can be easily identified in acute slices within a few minutes of whole-cell recording.
Diversity of NOS-1 expressing neurons
Nitrergic neurons are usually classified according to the intensity of NADPH diaphorase staining and/or NOS-1 immunoreactivity (Dawson et al., 1991;Gabbott et al., 1997;Judas et al., 1999;Lee and Jeon, 2005;Yan et al., 1996;Yan and Garey, 1997) and to the size of their soma as type I (large and heavily labeled somata) or type II neurons (small and lightly stained somata) that differ in areal, laminar distribution and density (Bidmon et al., 1997). Immunohistochemical reports have shown that nitrergic neurons are one of the rarest neuronal population and co-express NPY and SOM (Dawson et al., 1991;Estrada and DeFelipe, 1998;Gonchar and Burkhalter, 1997;Kubota et al., 1994;Smiley et al., 2000). This is in marked contrast with two recent studies which revealed that nitrergic interneurons constitute an abundant class of cortical neurons co-expressing NPY but not SOM (Fuentealba et al., 2008;Price et al., 2005). It appears that, due to technical considerations
inherent to the weak staining of type II neurons (Gerashchenko et al., 2008;Lee and Jeon, 2005), this neuronal population has been largely neglected leading to an inaccurate estimation of the degree of co-expression between NOS-1 and other molecular markers. Our study confirmed a high degree of co-expression for NPY (80%, 12 out of 15) but not for SOM (13%, 2 out of 15). Neurons co-expressing NOS-1, NPY and SOM were particularly rare (1.3 % of our sample of GABAergic neurons) and presented relatively large somata (Table 2), two features shared by type I neurons. In contrast the other nitrergic neurons were much more frequent and displayed relatively small somata (Table 2), indicating that they correspond to type II neurons. Interestingly, nitrergic adapting NPY neurons do not express SOM and exhibit electrophysiological and molecular features distinct from those of adapting SOM neurons. These observations indicate that type I and type II neurons constitute two functionally different neuronal populations differentially recruited within the cortical network as suggested by their difference in electrical excitability. Interestingly type I nitrergic neurons constitute a population of projecting GABAergic neurons (Higo et al., 2007;Tomioka et al., 2005;Tomioka and Rockland, 2007) and were recently found to be activated during sleep states (Gerashchenko et al., 2008). The puzzling co-expression of a vasodilator (NO) and a vasoconstrictor (NPY) of diving arterioles (Cauli et al., 2004) suggest that nitrergic neurons, either adapting SOM and/or adapting NPY might actively participate in the center/surround pattern of vasodilations/vasoconstrictions that occurs in vivo under sensory stimulations (Devor et al., 2007). The valuable identification of distinctive morphological, electrophysiological and molecular features for type I and type II nitrergic neurons will help to uncover their respective role(s) in this complex physiological process.
Table 1. PCR primers
Genes
Accession # First PCR primers
Size
(bp) Second PCR nested primers
Size (bp)
VGluT1
NM_053859.1 Sense, 361 GGCTCCTTTTTCTGGGGGTAC Antisense, 600: CCAGCCGACTCCGTTCTAAG 259 Sense, 373: TGGGGGTACATTGTCACTCAGA Antisense, 553:ATGGCAAGCAGGGTATGTGAC 201
GAD65
NM_012563.1 Sense, 99: CCAAAAGTTCACGGGCGG
Antisense, 454: TCCTCCAGATTTTGCGGTTG 375 Sense, 156: TGAGAAGCCAGCAGAGAGCG Antisense, 392:TGGGGTAATGGAAATCAATCACTT 260
GAD67 NM_017007.1 |
Sense, 83: ATGATACTTGGTGTGGCGTAGC
Antisense, 314: GTTTGCTCCTCCCCGTTCTTAG 253 Sense, 159: CAATAGCCTGGAAGAGAAGAGTCG Antisense, 314: GTTTGCTCCTCCCCGTTCTTAG 177
NOS-1
NM_052799.1 Sense, 1668: CCTGGGGCTCAAATGGTATG Antisense, 2021: CACAATCCACACCCAGTCGG 373 Sense, 1689: CCTCCCCGCTGTGTCCAA Antisense, 1937: GAGTGGTGGTCAACGATGGTCA 270
CB
NM_031984.2 Sense, 139: GAAAGAAGGCTGGATTGGAG Antisense, 544: CCCACACATTTTGATTCCCTG 426 Sense, 194: ATGGGCAGAGAGATGATGGG Antisense, 400: TATCATCCACGGTCTTGTTTGC 228
PV
NM_022499.2 Sense, 104: GCCTGAAGAAAAAGAGTGCGG Antisense, 266: GTCCCCGTCCTTGTCTCCAG 181 Sense, 121: GCGGATGATGTGAAGAAGGTG Antisense, 246 : CAGCCATCAGCGTCTTTGTT 145
CR
NM_053988.1 Sense, 83: TTGATGCTGACGGAAATGGGTA Antisense, 327: CAAGCCTCCATAAACTCAGCG 265 Sense, 141: GCTGGAGAAGGCAAGGAAAGG Antisense, 272: ATTCTCTTCGGTTGGCAGGA 151
NPY
NM_012614.1 Sense, 18: CGAATGGGGCTGTGTGGA; Antisense, 289: AGTTTCATTTCCCATCACCACAT 295 Sense, 41: CCCTCGCTCTATCCCTGCTC Antisense, 249: GTTCTGGGGGCATTTTCTGTG 229
VIP
XM_217838.4 Sense, 216: TTATGATGTGTCCAGAAATGCGAG
Antisense, 616: TTTTATTTGGTTTTGCTATGGAAG 424 Sense, 321: TGGCAAACGAATCAGCAGTAGC Antisense, 461: GAATCTCCCTCACTGCTCCTCT 162
SOM
NM_012659.1 Sense, 1: ATGCTGTCCTGCCGTCTCCA Antisense, 231: GCCTCATCTCGTCCTGCTCA 250 Sense, 41: GCATCGTCCTGGCTTTGGG Antisense, 191: AGGCTCCAGGGCATCGTTCT 170
CCK
NM_012829.1 Sense, 16: TGTCTGTGCGTGGTGATGGC Antisense, 546 GCATAGCAACATTAGGTCTGGGAG 554 Sense, 192 : ATACATCCAGCAGGTCCGCAA Antisense, 391 : GGTCGTGTGCGTGGTTGTTT 219
Table 2. Somatic properties of different cortical neurons
Glutamatergic FS-PV Adapt. SOM Adapt. VIP Burst. VIP Adapt. NPY (n= 46) (n= 34) (n= 17) (n= 43) (n= 22) (n= 38) 3.4 ± 0.8 3.2 ± 0.7 2.8 ± 0.7 2.5 ± 0.6 2.6 ± 0.6 2.1 ± 0.7 Layer
Adapt. NPY < Adapt. VIP Burst. VIP, Adapt. SOM < FS-PV, Glutamatergic
17.1 ± 3.8 21.3 ± 4.3 22.4 ± 6.3 18.8 ± 3.3 16.4 ± 3.1 20.4 ± 7.7 Major axis (µm)
Burst. VIP, Glutamatergic < Adapt. VIP, Adapt. NPY, FS-PV, Adapt. SOM
9.4 ± 1.5 9.4 ± 1.1 8.6 ± 1.1 8.3 ± 0.9 8.8 ± 1.2 9.0 ± 1.5 Minor axis (µm)
Adapt. VIP, Adapt. SOM < FS-PV, Glutamatergic
1.9 ± 0.6 2.3 ± 0.5 2.6 ± 0.7 2.3 ± 0.4 1.9 ± 0.4 2.3 ± 0.8 Elongation
Burst. VIP, Glutamatergic < Adapt. VIP, FS-PV, Adapt. NPY, Adapt. SOM
119.4 ± 29.1 152.3 ± 31.4 147.7 ± 45.9 115.2 ± 22.1 107.2 ± 28.4 139.9 ± 56.7 Area (µm2)
Burst. VIP, Adapt. VIP, Glutamatergic < Adapt. SOM, FS-PV
45.4 ± 7.5 52.1 ± 7.6 52.9 ± 12.5 45.9 ± 6.5 42.1 ± 6.9 50.5 ± 14.9 Perimeter (µm)
Burst. VIP < glutamatergic, Adapt. VIP < FS-PV, Adapt. SOM and Burst. VIP < Adapt. NPY 1.4 ± 0.3 1.4 ± 0.2 1.5 ± 0.3 1.6 ± 1.0 1.3 ± 0.2 1.5 ± 0.3 Roundness
Burst. VIP < FS-PV, Adapt. SOM, Adapt. NPY, Adapt. VIP
n, number of cells; < significantly smaller with P ≤0.05; << significantly smaller with P